The Implications of Grain Size Variation in Magnetic Field Alignment of Block Copolymer Blends
Abstract
Recent experiments have highlighted the intrinsic magnetic anisotropy in coil-coil diblock copolymers, specifically in poly(styrene-block-4-vinylpyridine) (PS-b-P4VP), that enables magnetic field alignment at field strengths of a few tesla. We consider here the alignment response of two low molecular weight (MW) lamallae-forming PS-b-P4VP systems. Cooling across the disorder-order transition temperature () results in strong alignment for the higher MW sample (5.5K), whereas little alignment is discernible for the lower MW system (3.6K). This disparity under otherwise identical conditions of field strength and cooling rate suggests that different average grain sizes are produced during slow cooling of these materials, with larger grains formed in the higher MW material. Blending the block copolymers results in homogeneous samples which display , d-spacings and grain sizes that are intermediate between the two neat diblocks. Similarly, the alignment quality displays a smooth variation with the concentration of the higher MW diblock in the blends and the size of grains likewise interpolates between limits set by the neat diblocks, with a factor of 3.5X difference in the grain size observed in high vs low MW neat diblocks. These results highlight the importance of grain growth kinetics in dictating the field response in block copolymers and suggests an unconventional route for the manipulation of such kinetics.
pacs:
82.35.Jk,82.35.Lr,81.16.DnI Introduction
Magnetic fields can be used to direct the self-assembly of block copolymers (BCPs) in a facile manner under appropriate conditions Osuji et al. (2004); Tao et al. (2007); Gopinadhan et al. (2010, 2012). Thermodynamically, it is the combination of grain size, field strength, and magnetic susceptibility anisotropy that leads to magnetic field alignment in a variety of BCP systems. The driving force for alignment of an anisotropic object is its angle dependent magnetostatic energy density defined in Eq. 1,
| (1) | |||||
| (2) |
where and are the magnetic susceptibilities parallel and perpendicular to the axis of highest rotational symmetry, is the field strength, and is the permeability of free space. The magnetostatic energy density difference between orthogonal alignments is given in Eq. 2, where . Alignment of an object with volume is possible when the extensive quantity, the magnetostatic energy difference between orthogonal alignments, , exceeds thermal energy , Eq. 3. For BCPs, is the volume of a grain with characteristic dimension .
| (3) |
Mesogen attachment to polymer backbones to yield liquid crystalline (LC) BCPs has been a typical means of providing a sufficiently large ( in dimensionless SI volume units) for field alignment at reasonable field strengthsFerri et al. (1998); Hamley et al. (2004); Gopinadhan et al. (2012); Majewski et al. (2012); Tran et al. (2013), for grain sizes of hundreds of nm. Recently, it has been shown that a simple coil-coil BCP (i.e. non-LC BCP), PS-b-P4VP, displays sufficiently large grain sizes and intrinsic magnetic anisotropy to be well-aligned by a magnetic field at appropriate molecular weights.Rokhlenko et al. (2015) The intrinsic magnetic anisotropy originates in the correlation of the orientations of end-end vectors necessitated by the localization of block junctions at the microdomain interface. The orientation distribution of the end-end vectors has its maximum along the intermaterial dividing surface (IMDS) normal, which, for PS-b-P4VP, imparts a net magnetic anisotropy of 1.6 x for the system overall. Based on this analysis, compared to LC BCPs, coil-coil BCPs have that is roughly 2 orders of magnitude lower. Thus the expected minimum grain size for alignment is about 5 times larger (), as suggested by the linear relationship between the magnetostatic energy, , and volume, in Eq. 3.
As a BCP is cooled through , the blocks begin to microphase separate and the system becomes increasingly magnetically anisotropic. This is accompanied by a sharp decrease in the mobility of the chains, or a rapid increase in viscosity. The increasing viscosity begins to kinetically prohibit alignment, while the increasing magnetic anisotropy favors alignment thermodynamically. Thus, the degree of alignment is a sensitive function of undercooling, and the cooling rate through plays an important role in grain alignment - slower cooling improves alignment until a thermodynamic limit is reached Gopinadhan et al. (2013). Additionally, slower cooling can have an indirect effect on the energetics of field alignment through an increased grain size.
Here we examine differences in alignment of two low MW PS-b-P4VP BCPs at the same cooling rate and field strength. Blending the BCPs produces samples with intermediate , d-spacings and grain sizes. Concurrently, the alignment quality varies with composition, and is related to grain size - samples with larger grains display better alignment. The contrasting alignment quality of the two neat diblocks, which differ in grain size by a factor of 3.5, shows that changes in grain size can have profound effects on field-induced orientational order. Blending of these diblocks provides an unconventional route to vary grain size in block copolymers.
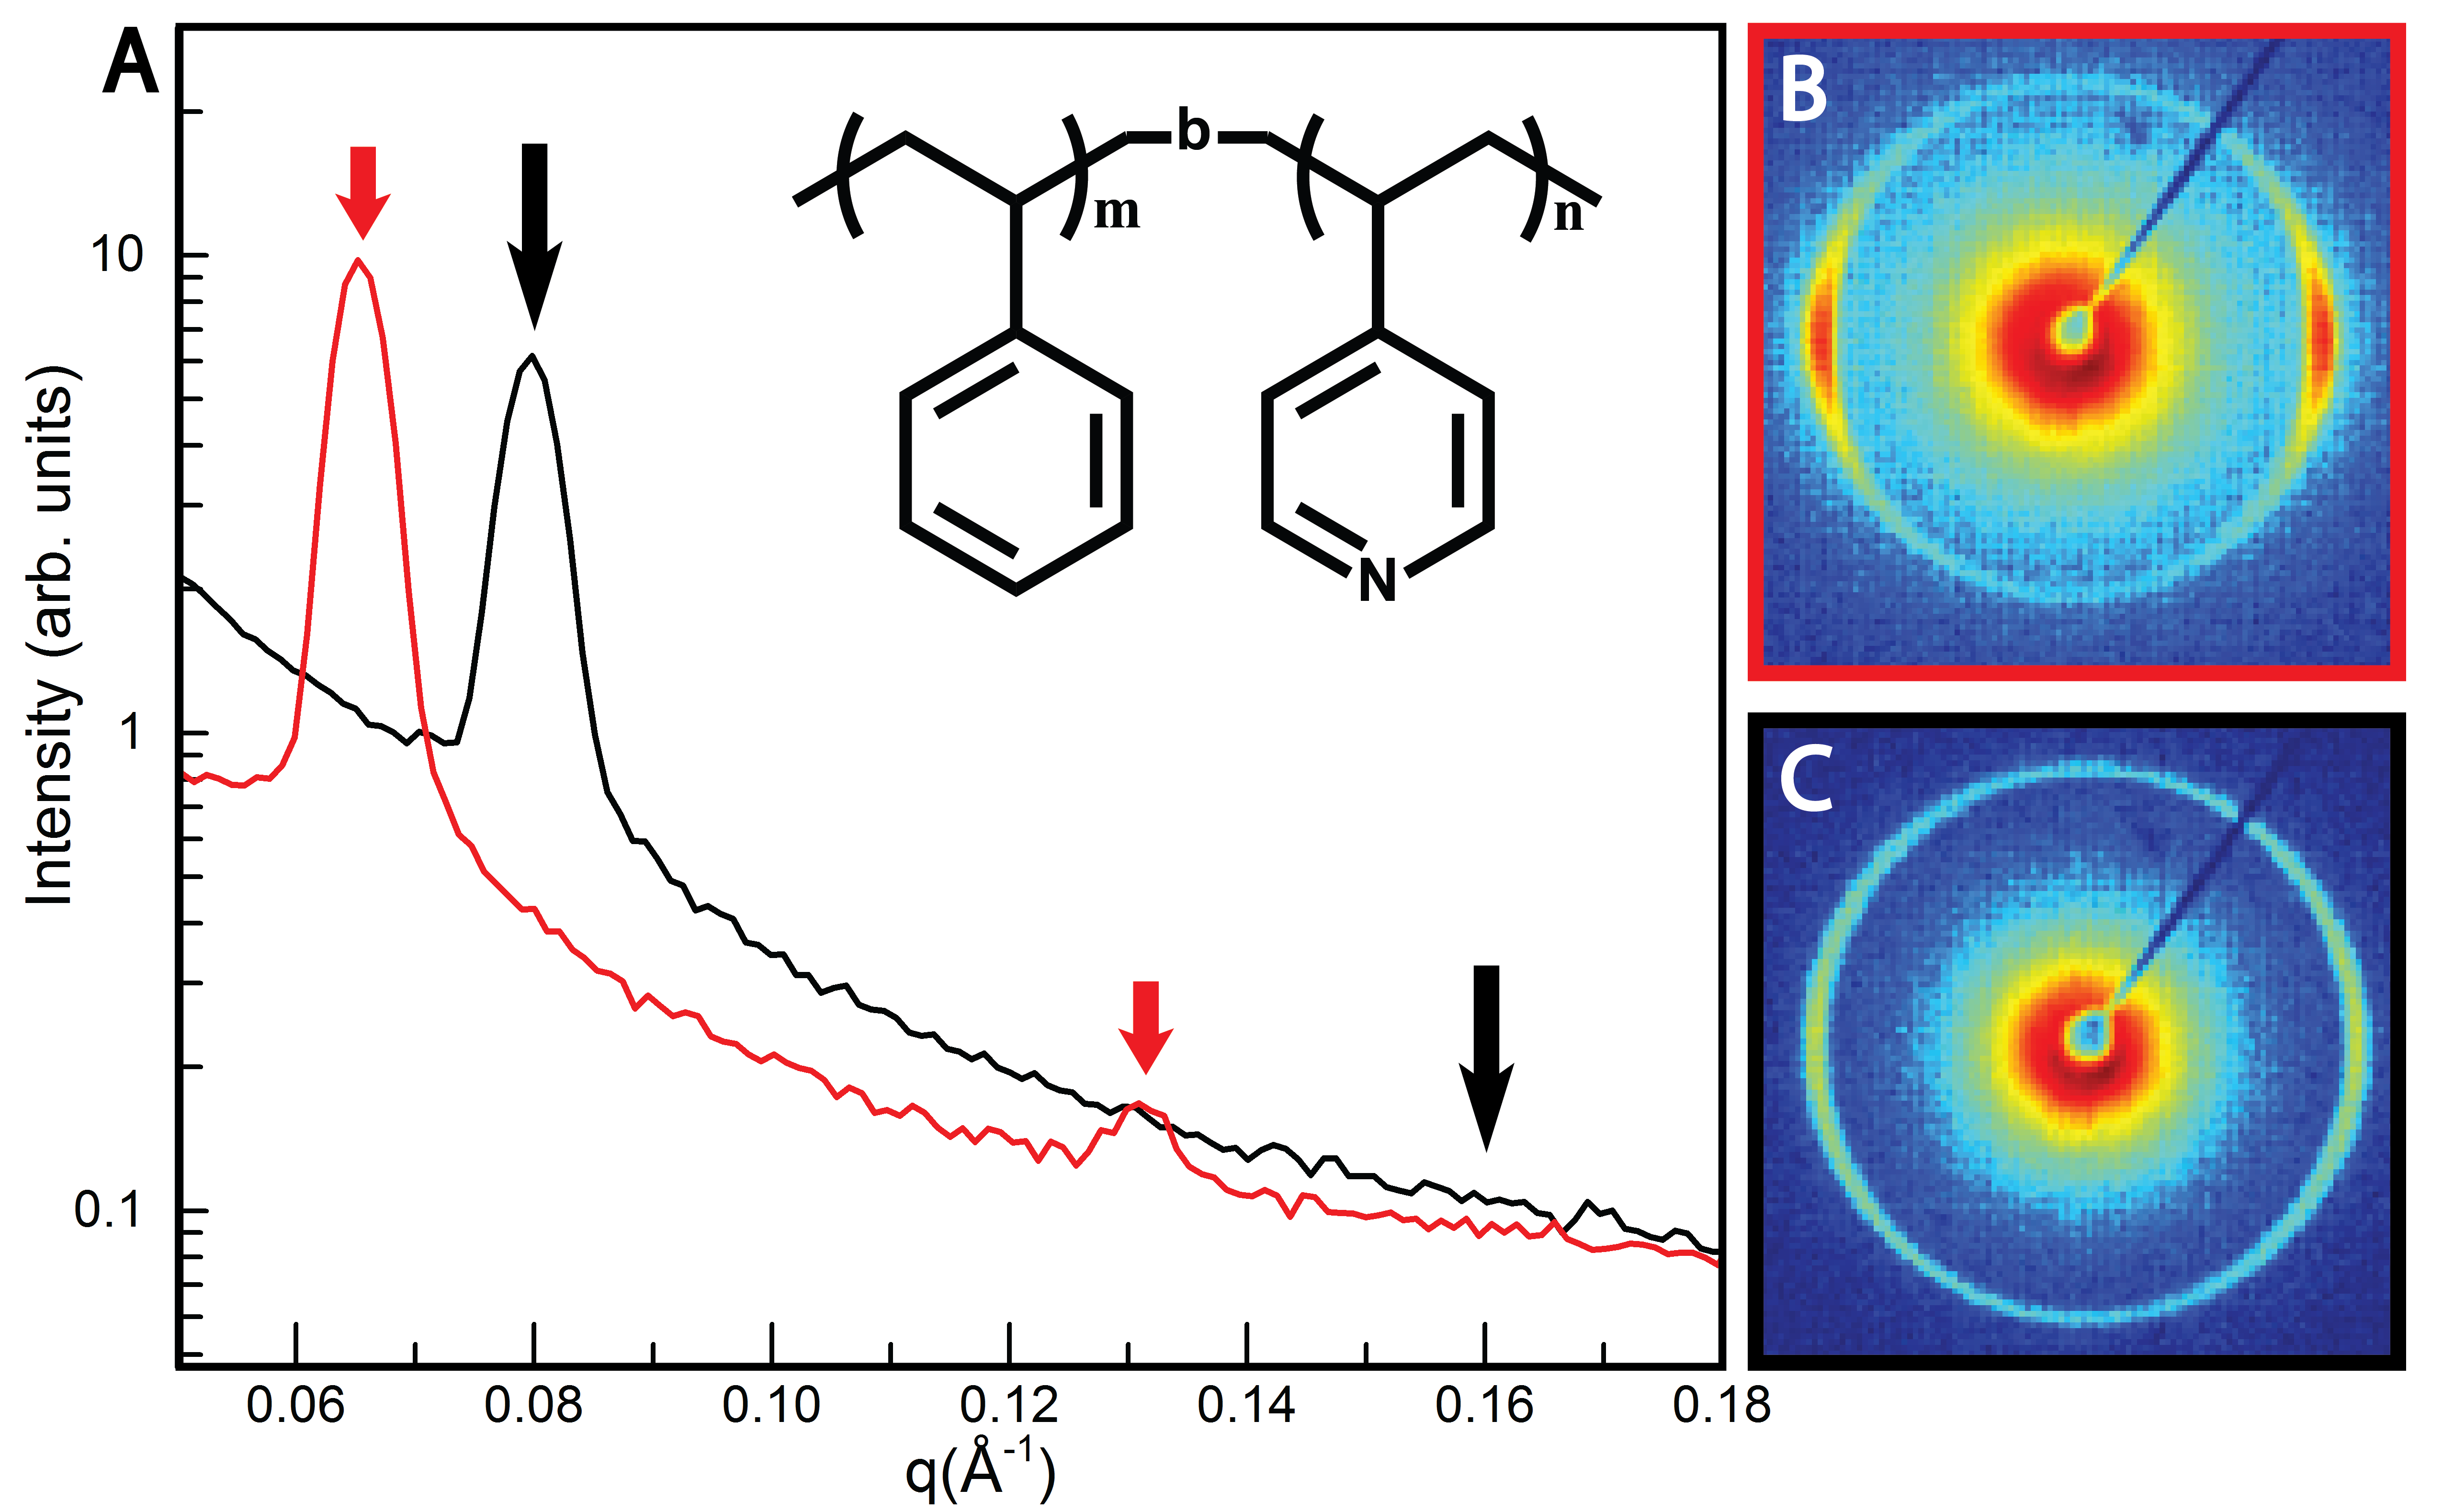
The samples under investigation are lamellae-forming PS-b-P4VP with MWs of 3.6 kg/mol. (K) and 5.5K, with P4VP weight fractions, f and , and d-spacings of 7.9 and 9.5 nm, respectively (Figure 1). Slow cooling the 5.5K sample at 0.3 K/min. under a 6 T field from the disordered melt (T>) results in pronounced alignment of the lamellar normals perpendicular to the applied field, as inferred by small-angle X-ray scattering (SAXS) (Figure 1B). The 3.6K sample shows minimal alignment when subjected to the same protocol, as demonstrated by the isotropic ring-like scattering pattern (Figure 1C).
Given the identical cooling rate and chemistry of the two neat BCPs, it is likely that the differences in alignment behavior are due to variations in grain size, originating from differing nucleation and growth kinetics near . We considered the possibility that blends of the two materials would interpolate their neat field alignment responses, and speculated that any grain size differences would also be reflected in this alignment response.
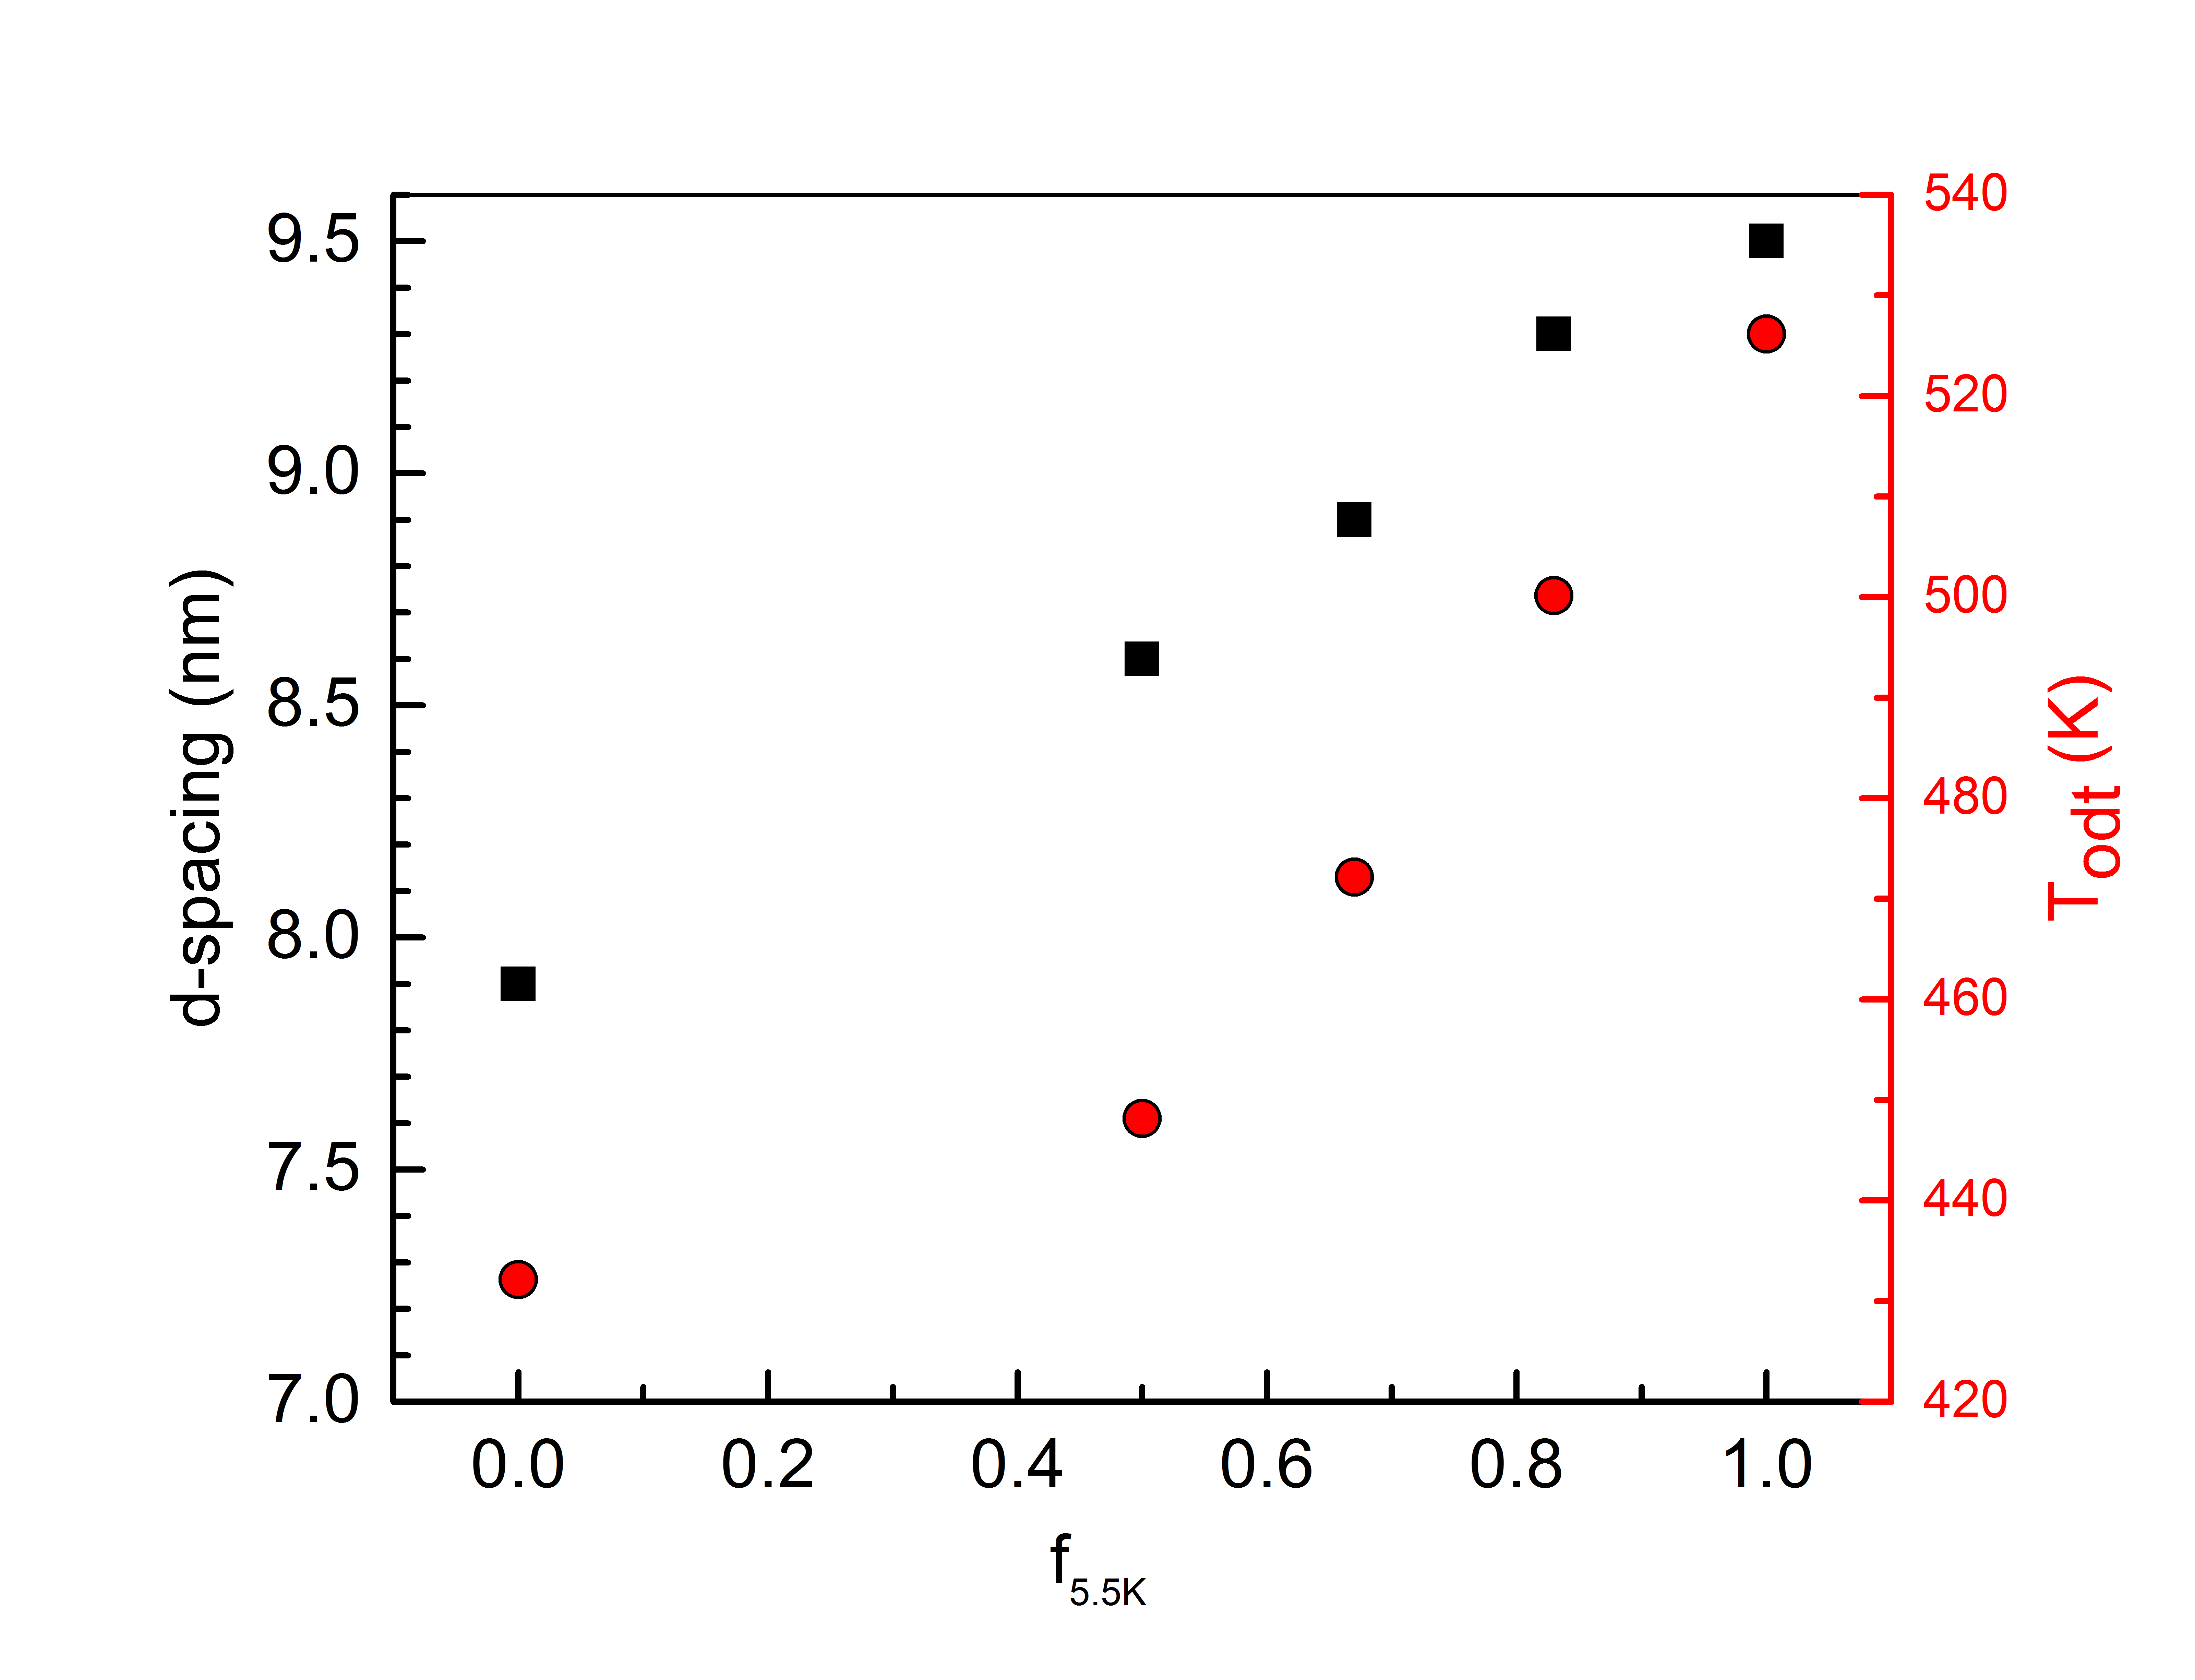
Blending with homopolymer Matsen (1995); Floudas et al. (1997); Perlich et al. (2007) or BCPs with different MWsHashimoto et al. (1993); Kane et al. (1996); Zhang et al. (2011) has been used to tailor both the morphology and microdomain size of BCPs. For binary BCP blends, complete miscibility is observed for MW ratios less than 5. We observe a roughly linear variation of d-spacing with blend ratio, as expected for strongly segregating systems such as PS-b-P4VP (Figure 2). BCP ordering at finite MWs is influenced by fluctuation effects, with ordered states produced by a fluctuation-induced first order transitionFredrickson and Helfand (1987), rather than via the critical point anticipated by the original mean-field theoryLeibler (1980). The lamellar order-disorder transition (ODT) occurs at , where is the effective Flory interaction parameter, is the (statistical) degree of polymerization, and is the invariant degree of polymerization, with the statistical segment length and the monomer concentration. The effective interaction parameter nominally scales inversely proportional to temperature, and so for a MW independent , one expects . In reality, , where and are constants relating to entropic and enthalpic characteristics of the interaction parameter, respectively. A linear dependence on composition is expected if composition variation is interpreted as an effective molecular weight dependence, and only if the entropic term is negligible.
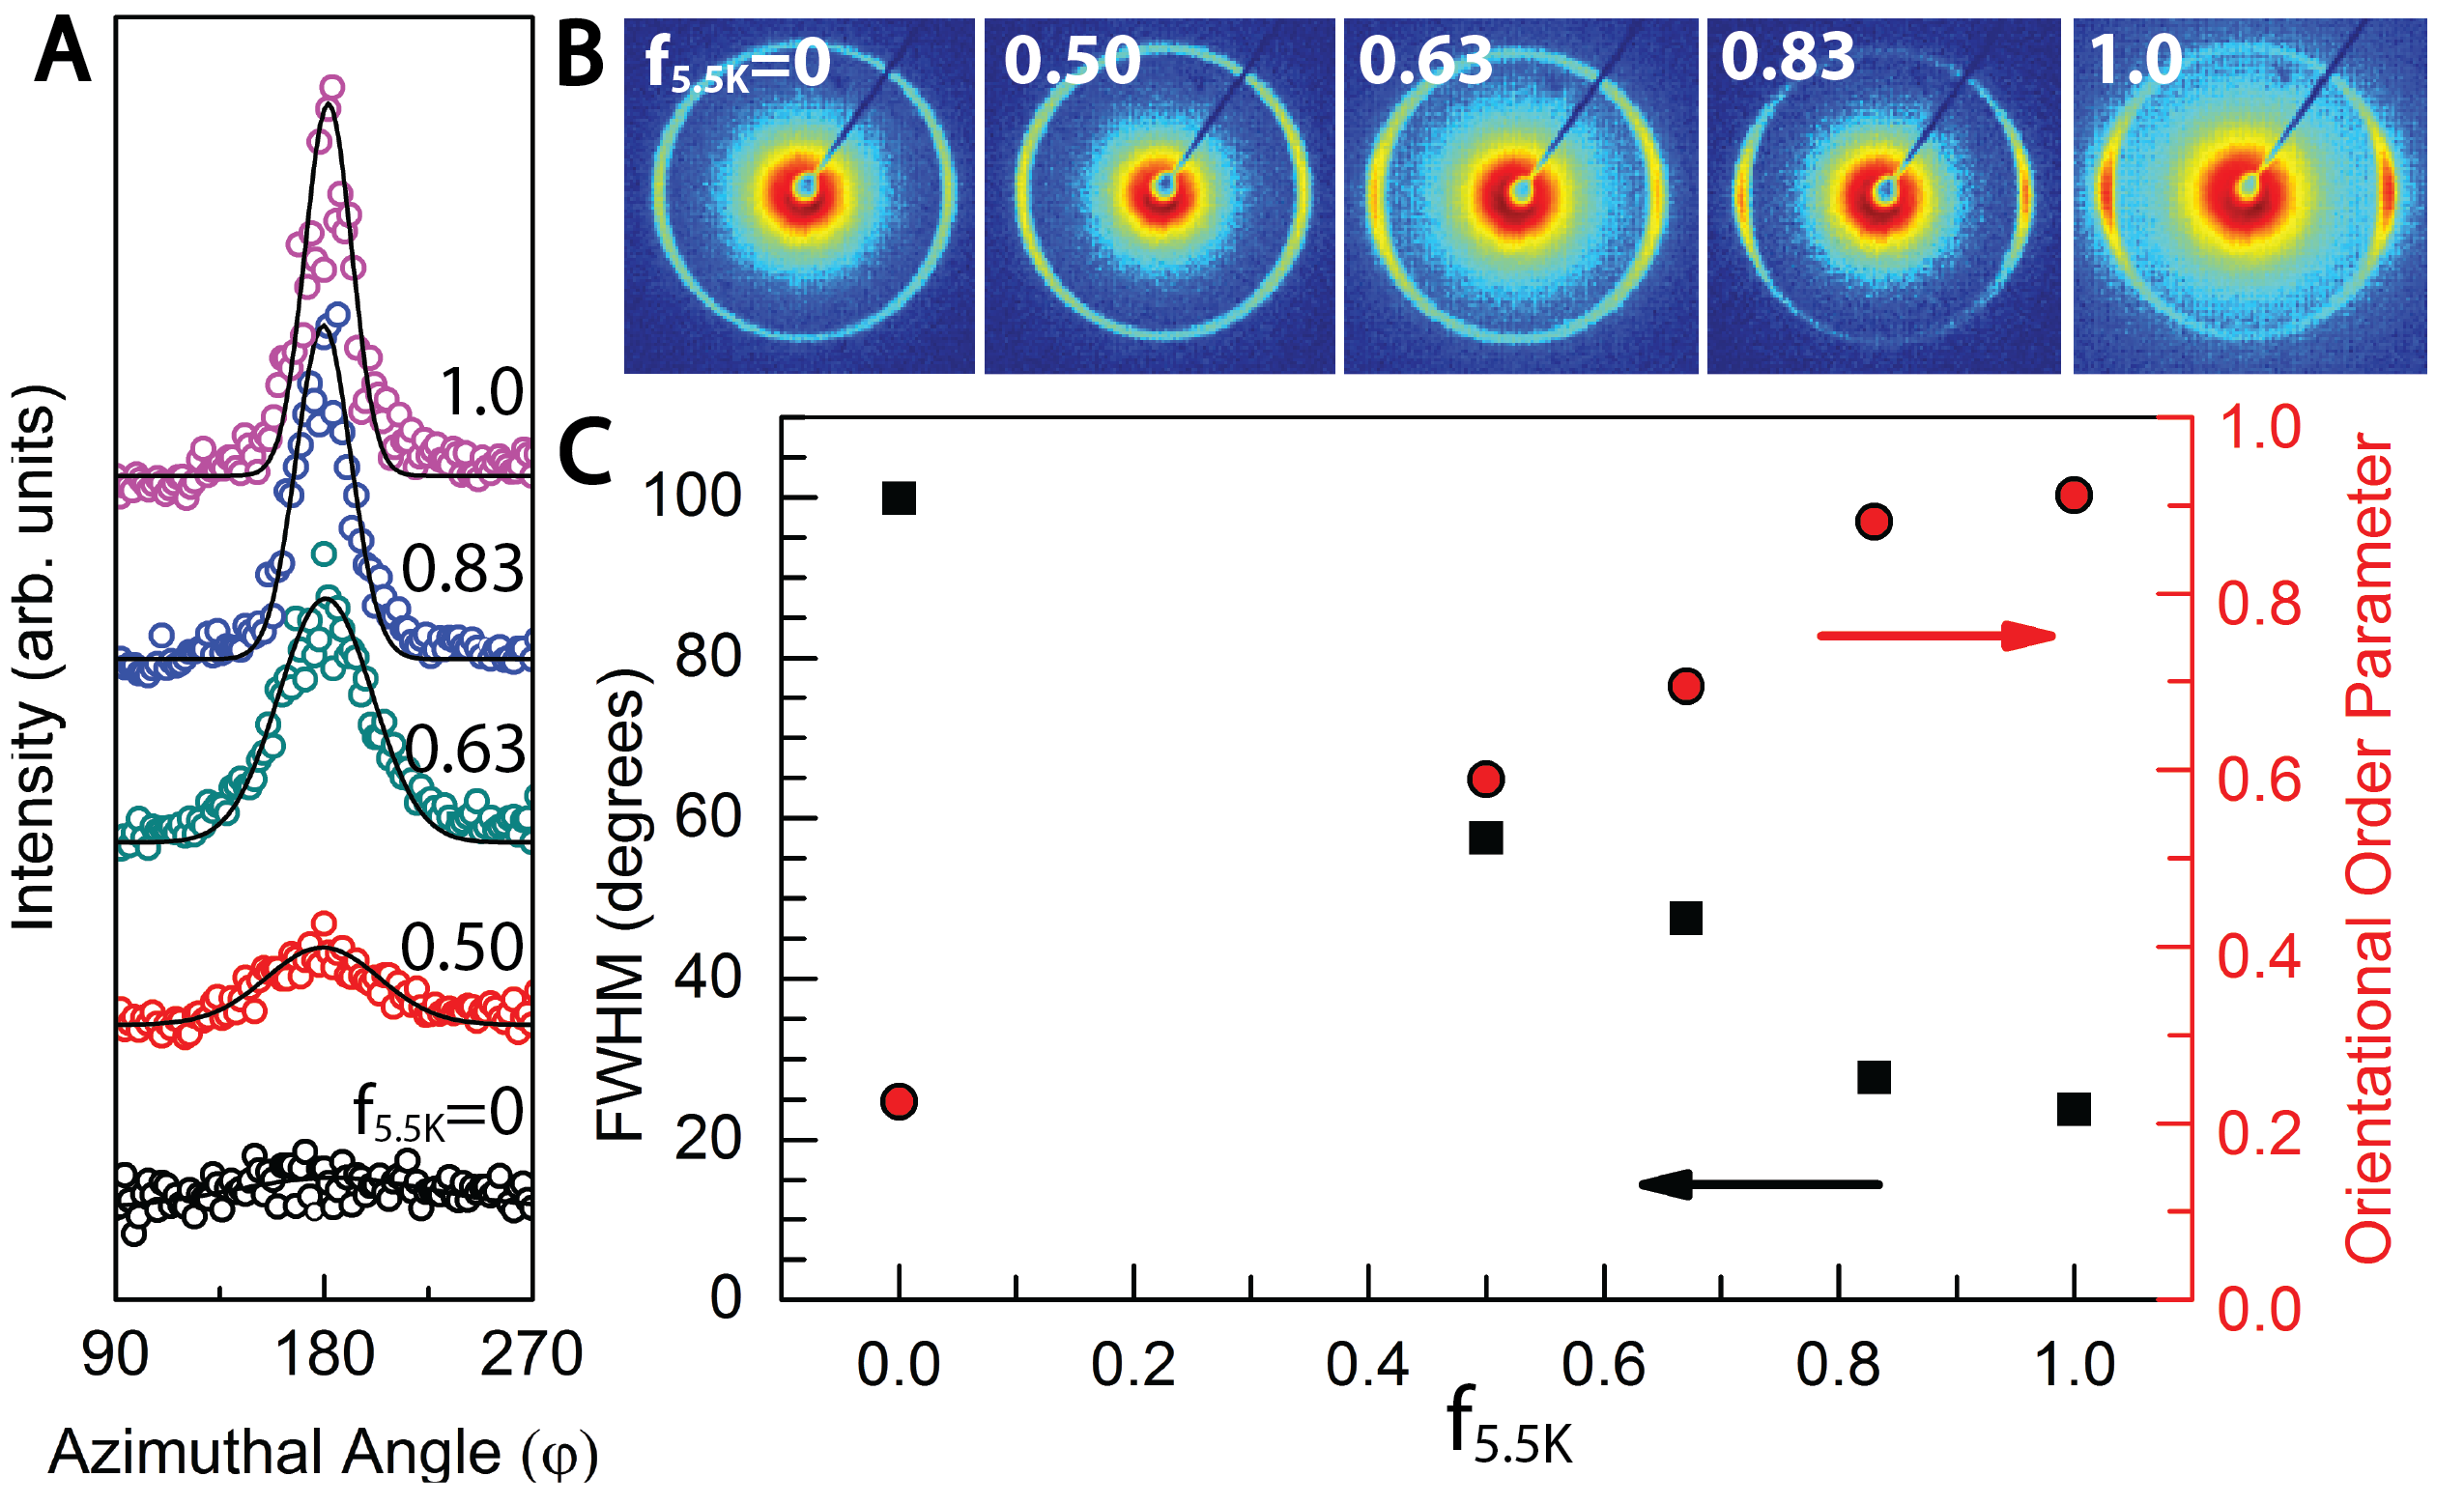
Figure 2 shows values determined from SAXS as described in the Supporting Information. Though the blend values interpolate between those of the neat diblocks (=0 and =1), there appears to be a deviation from linearity for =0, which suggests that some of the underlying assumptions about and the magnitude of the entropic term may be incorrect.
We studied the alignment quality of the blends and compared them to the neat diblocks using in-situ SAXS. The resulting 2D diffractograms after cooling from K to K at 0.3 K/min at 6 T are shown in Figure 3. The orientational order of the lamellar microdomains improves markedly as the weight fraction of 5.5K material in the sample, , increases, as evidenced by the increasing intensity concentration azimuthally. The azimuthal intensity dependence reflects the probability of observing lamellar normals at a given angle with respect to the applied field direction. Because is based on Boltzmann factors incorporating the angle dependent magnetostatic energy , the full width at half maximum (FWHM) from Gaussian fits of can be used to calculate the orientation distribution coefficient of the lamellar microdomains by integration, Eq. 5. Figure 3 shows for the five samples, and the corresponding FWHM and values. The degree of orientation as captured by increases roughly linearly with .
| (4) | |||
| (5) |
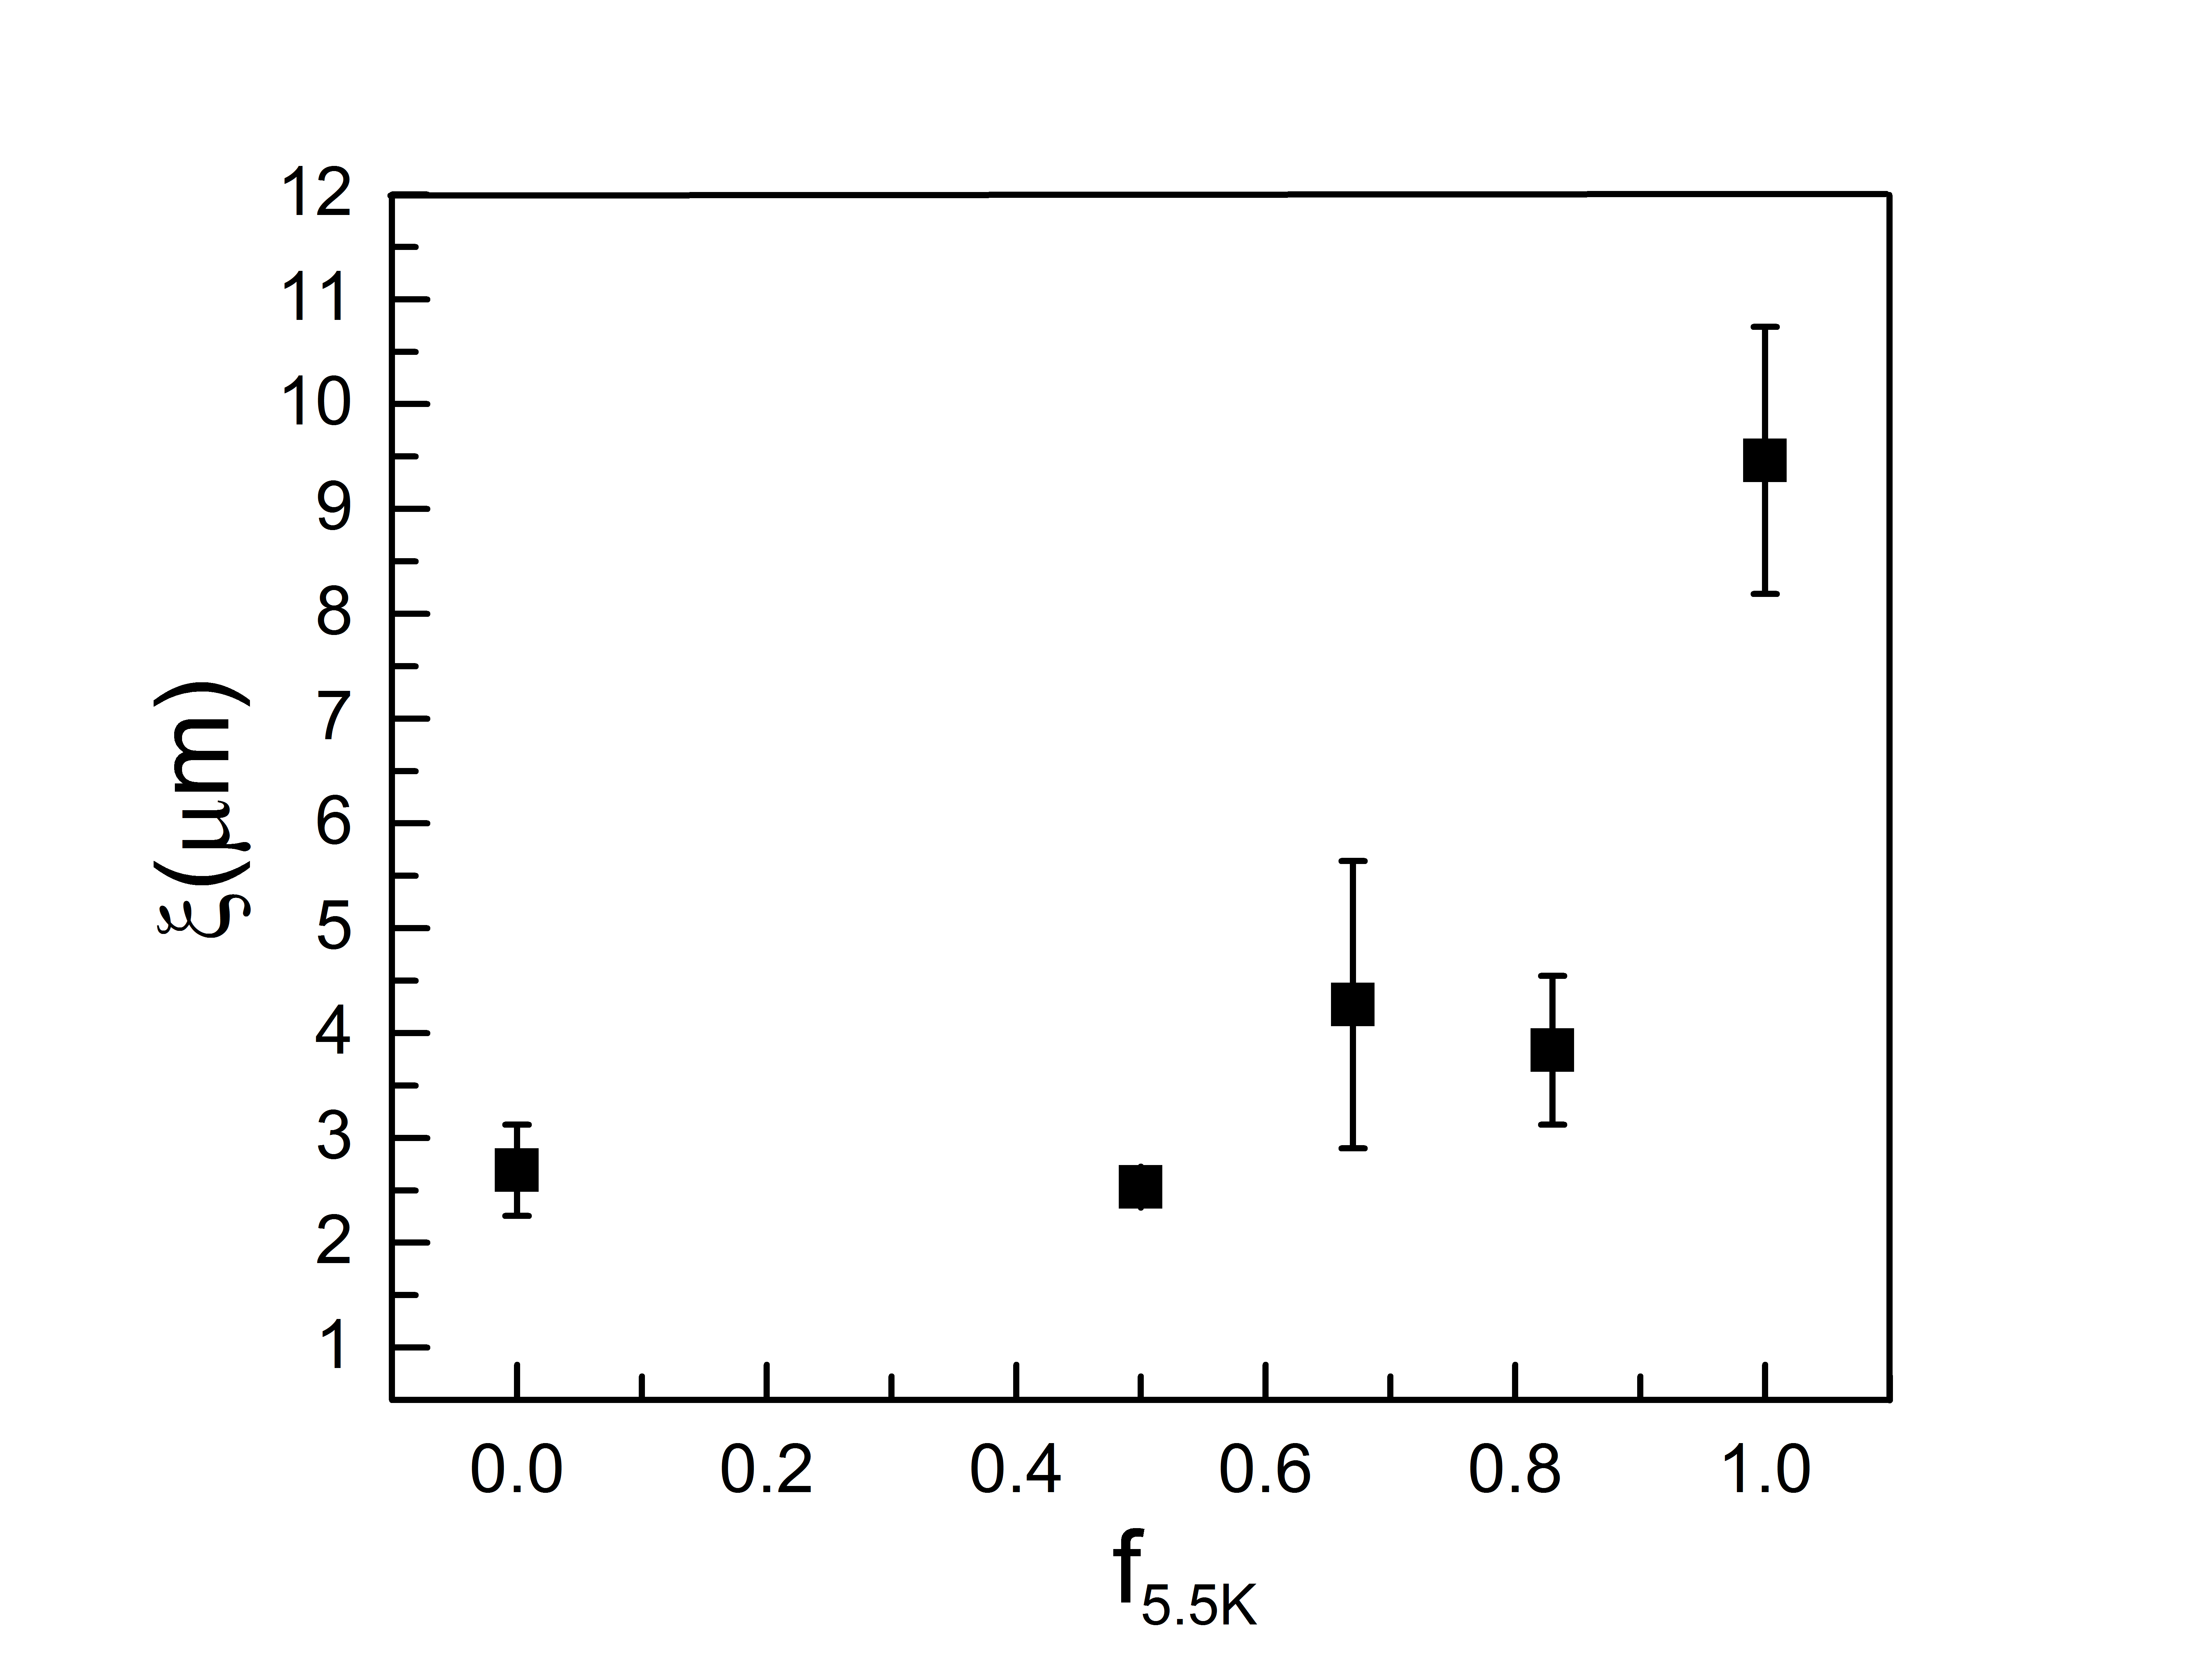
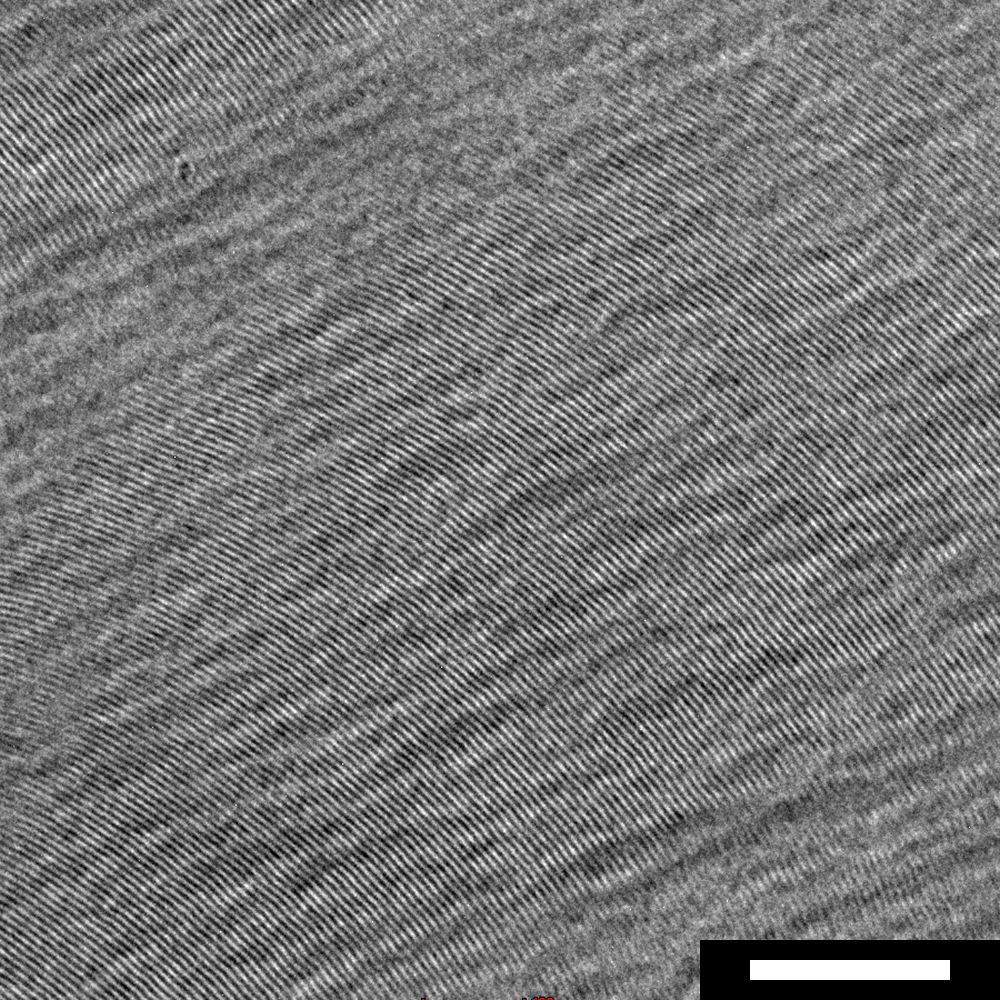
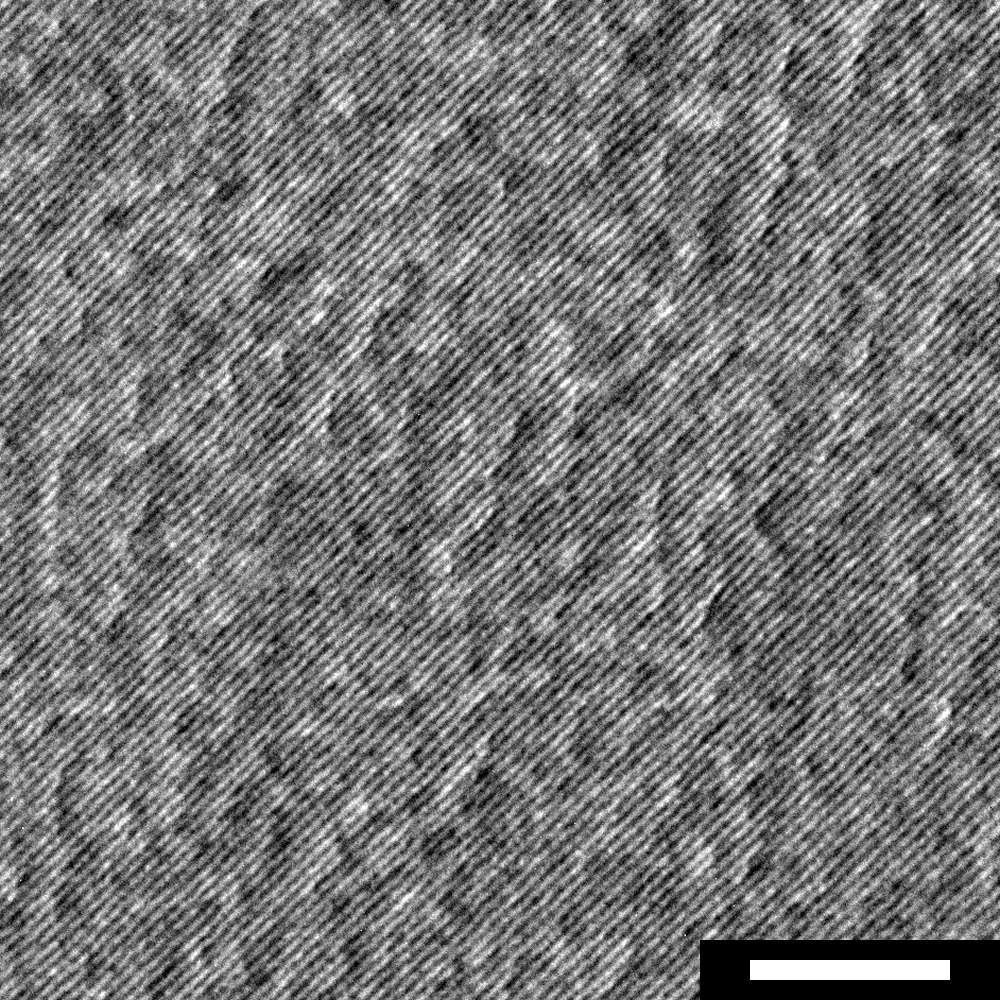
We investigated grain size differences across our samples using a recently developed ‘variance scattering’ technique Yager and Majewski (2014), which involves computing the standard deviation of of the primary scattering peak, from which the number of independent scatterers, and thus the characteristic grain dimension can be calculated (details in Supporting Information). For this grain-size estimate, non-aligned (i.e. isotropic) samples were prepared by cooling samples through ODT at 0.3 K/min. without any field applied. The results of our analysis (Figure 4) show that there is a three-fold difference between the grain sizes of the neat BCPs at room temperature. This difference is consistent with qualitative assessments of TEM images of bulk samples (Supporting Information).
During our experiment, grains of microphase separated lamellae begin to nucleate as the samples are cooled slowly through ODT. Past studies have highlighted the connections between the cooling rate and extent of undercooling, and the resulting grain sizes in BCPs. Yager et al. showed that there was a significant correlation between faster quenching and smaller grain size for a small molecule surfactant hexagonal mesophase Yager and Majewski (2014). In isothermal experiments at fixed undercoolings, Russell et al. observed that larger grains are produced by annealing films at smaller undercoolings, i.e. closer to , for thermally annealed cylindrical microdomains.Gu et al. (2016). Studies of grain growth kinetics have been conducted by Balsara et al.Dai et al. (1996); Balsara et al. (1998); Kim et al. (2001) and Lodge et al.Chastek and Lodge (2004, 2006). They observed growth velocities which scaled with the undercooling in good agreement with ordered front propagation velocities predicted by the theory of Goveas and Milner Goveas and Milner (1997).
Within classical nucleation theory, for homogeneous nucleation, the expected characteristic grain size is a simple function of grain growth velocity and nucleation rate , Avrami (1940); Axe and Yamada (1986). Analytical expressions for both the growth and nucleation rates following the treatment of Fredrickson and BinderFredrickson and Binder (1989) are shown in Eq. 6 and Eq. 7. Here, is the Flory interaction parameter at the coexistence between the lamellar and disordered phases, is the radius of gyration, is a dimensionless undercooling, is the inverse susceptibility of the disordered phase Fredrickson and Helfand (1987), is the terminal chain relaxation time, and is the nucleation barrier. For symmetric diblock copolymers subjected to shallow quenches, the nucleation barrier .
| (6) | |||||
| (7) | |||||
| (8) |
On the basis of this theoretical treatment, the average grain size is expected to scale as shown in Eq. 8. This treatment assumes perfectly monodisperse chains of a symmetric BCP in which nuclei are formed solely by homogeneous nucleation at a fixed temperature. In the present case, given the non-isothermal ordering, the finite polydispersity of the BCPs, and their proximity in molecular weight, we consider it unlikely that the observed differences can be rationalized by classic nucleation and growth theories interpreted in the context of molecular weight effects as captured in Eq. 8. We speculate, instead, that the differences in grain size may originate from a molecular weight dependence of the Flory interaction parameter , in addition to MW and dependence of the critical nucleation barrier, or as a result of heterogeneous nucleation.
Attempts were made to alter the grain size and alignment quality of the neat BCPs by controlling heterogeneous nucleation rates through deliberate seeding of samples with nanoparticles (expected to produce smaller grains in ) and filtration with a 0.2 m selective membrane to removal of any inadvertent particulate impurities (expected to produce larger grains in ). These attempts however were unsuccessful. It is possible that heterogeneous nucleation promoters present in the samples were too small to be removed by the filter, or too numerous to have their effects swamped by the added nanoparticles. The variance scattering technique gives = 3.5, and because , where is the number density of heterogeneous nucleation sites, this difference implies a 45X change in the density of heterogeneous nucleation sites between the two blend components. If we postulate that the =1 sample has very few heterogeneous nucleation sites while the =0 sample has 45X more, and that the blends contain interpolating quantities based on their compositions, we can estimate, for example, that and thus we would expect . From variance scattering we observe . The similarity between these two ratios (1.7 and 1.4) suggests that heterogeneous nucleation dominated by nucleation sites contributed by the low MW sample could be the reason for the observed differences in grain sizes in the blends.
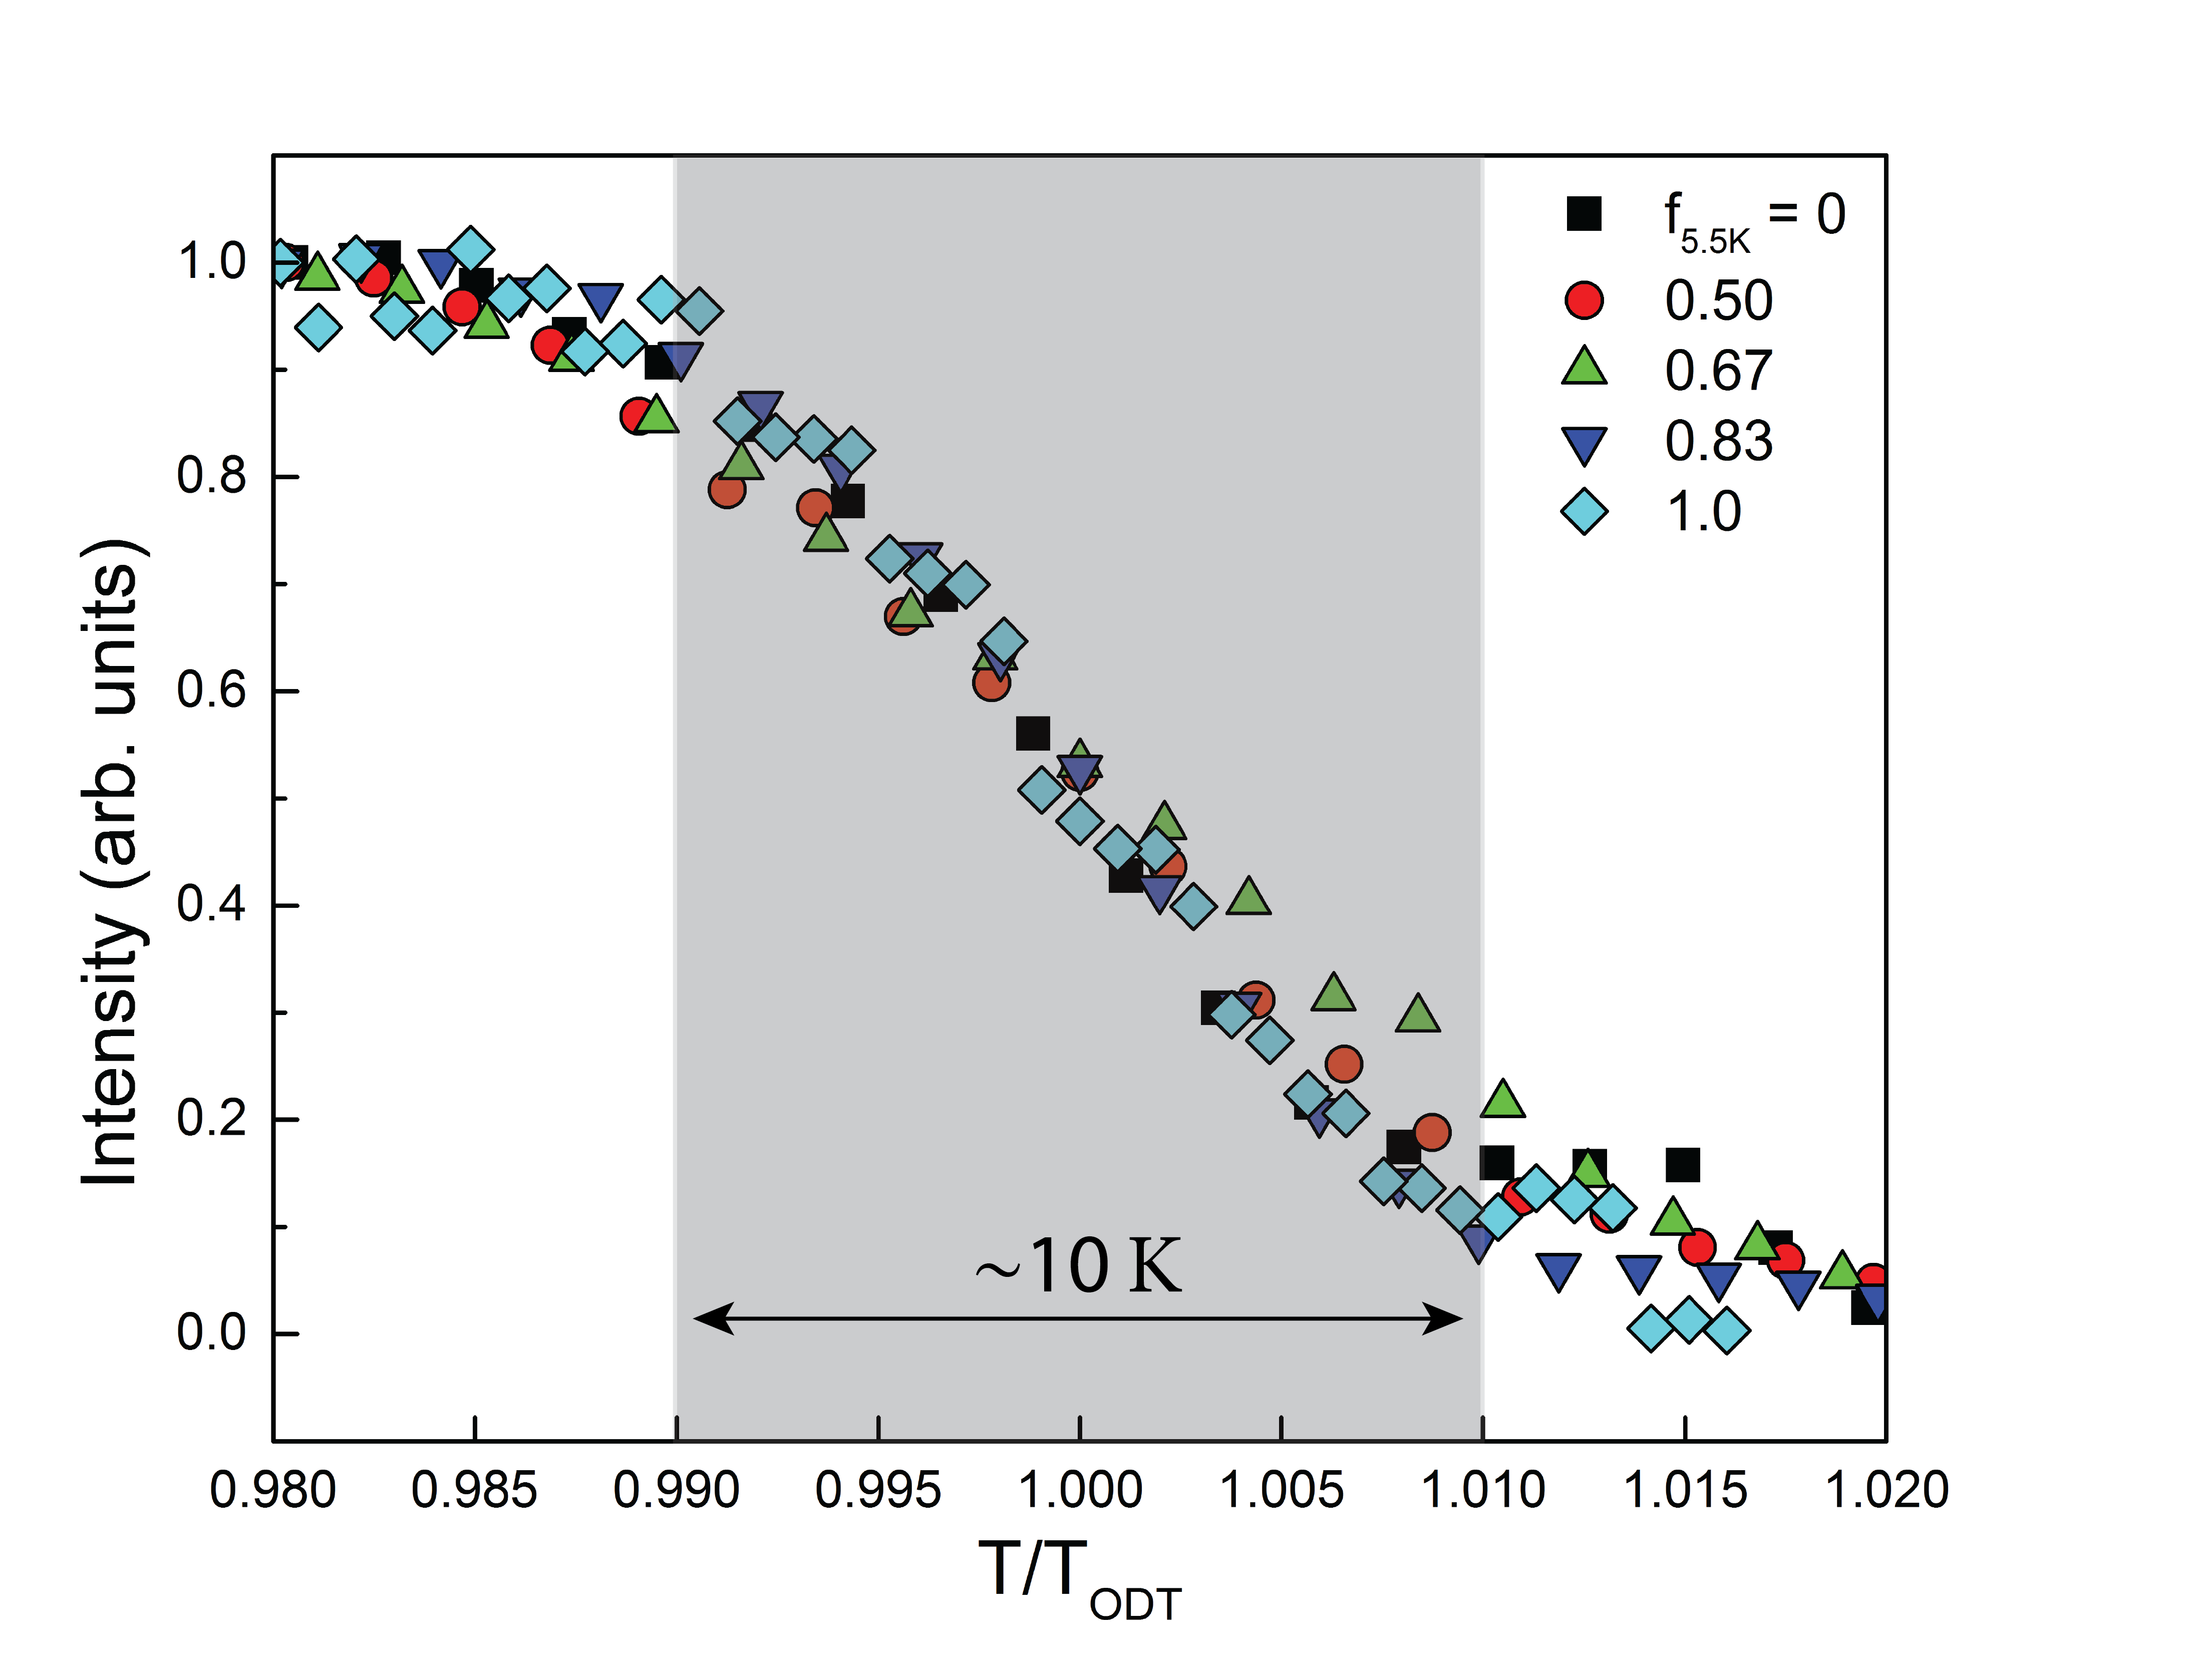
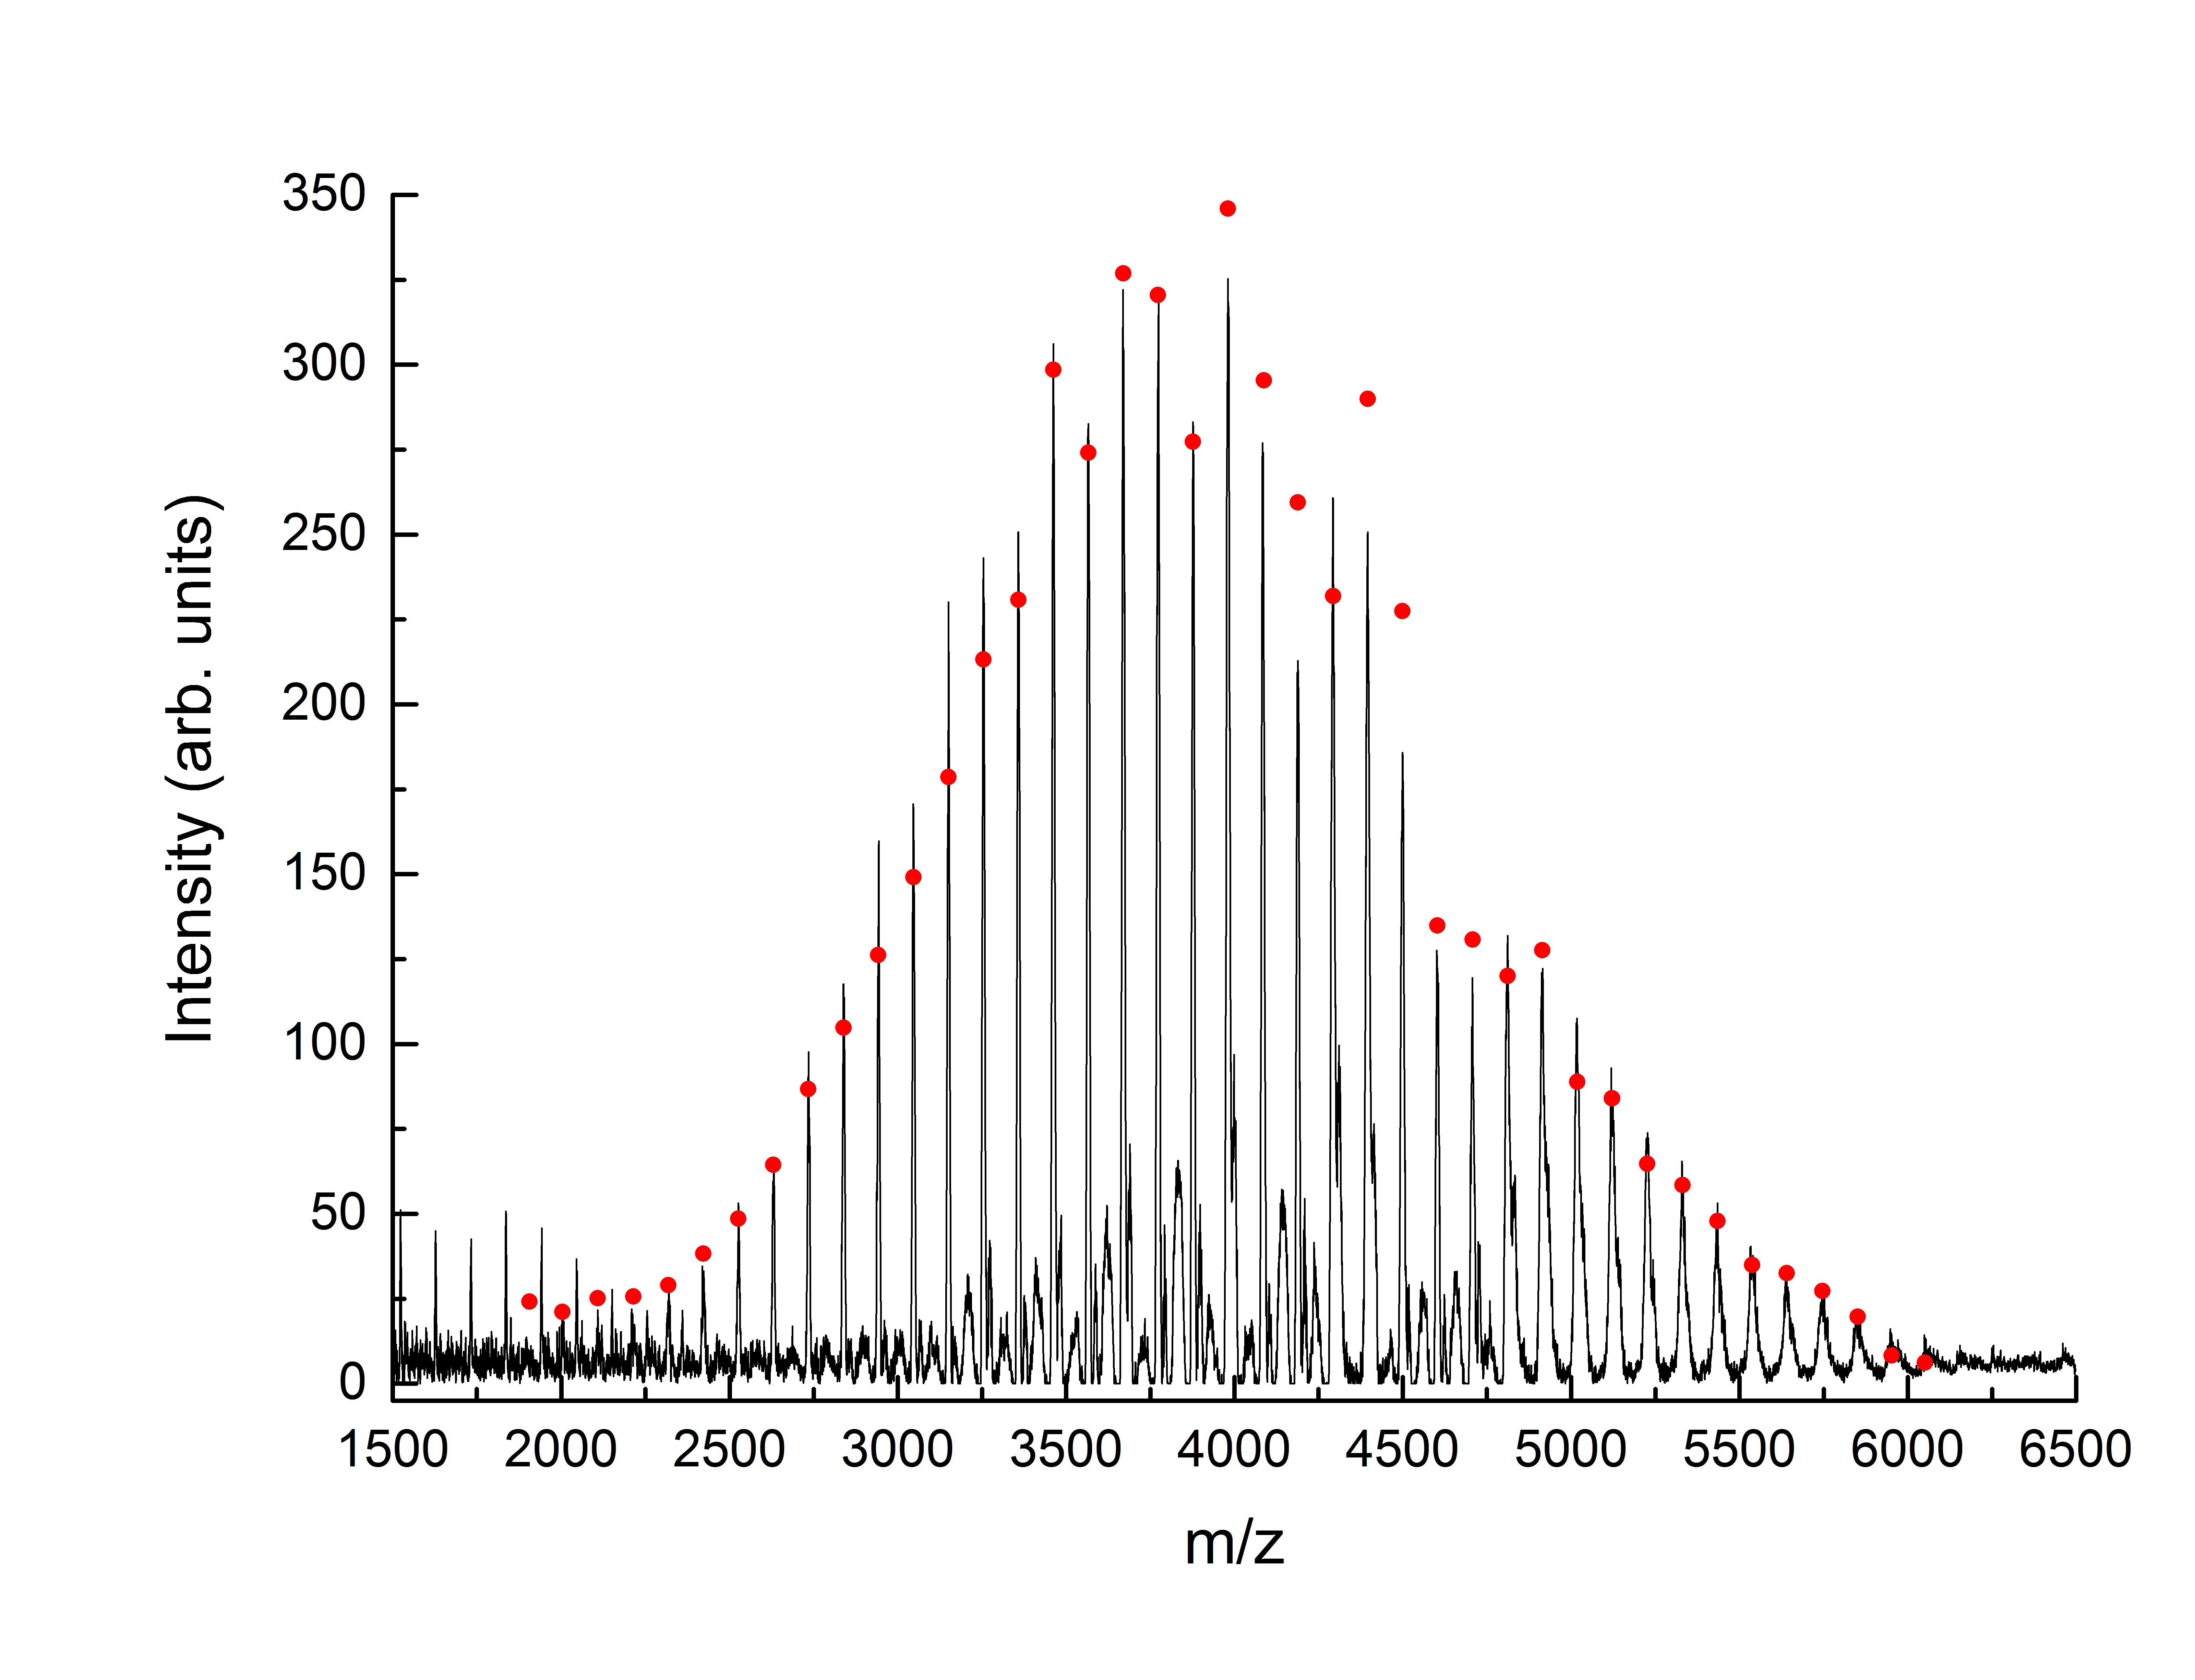
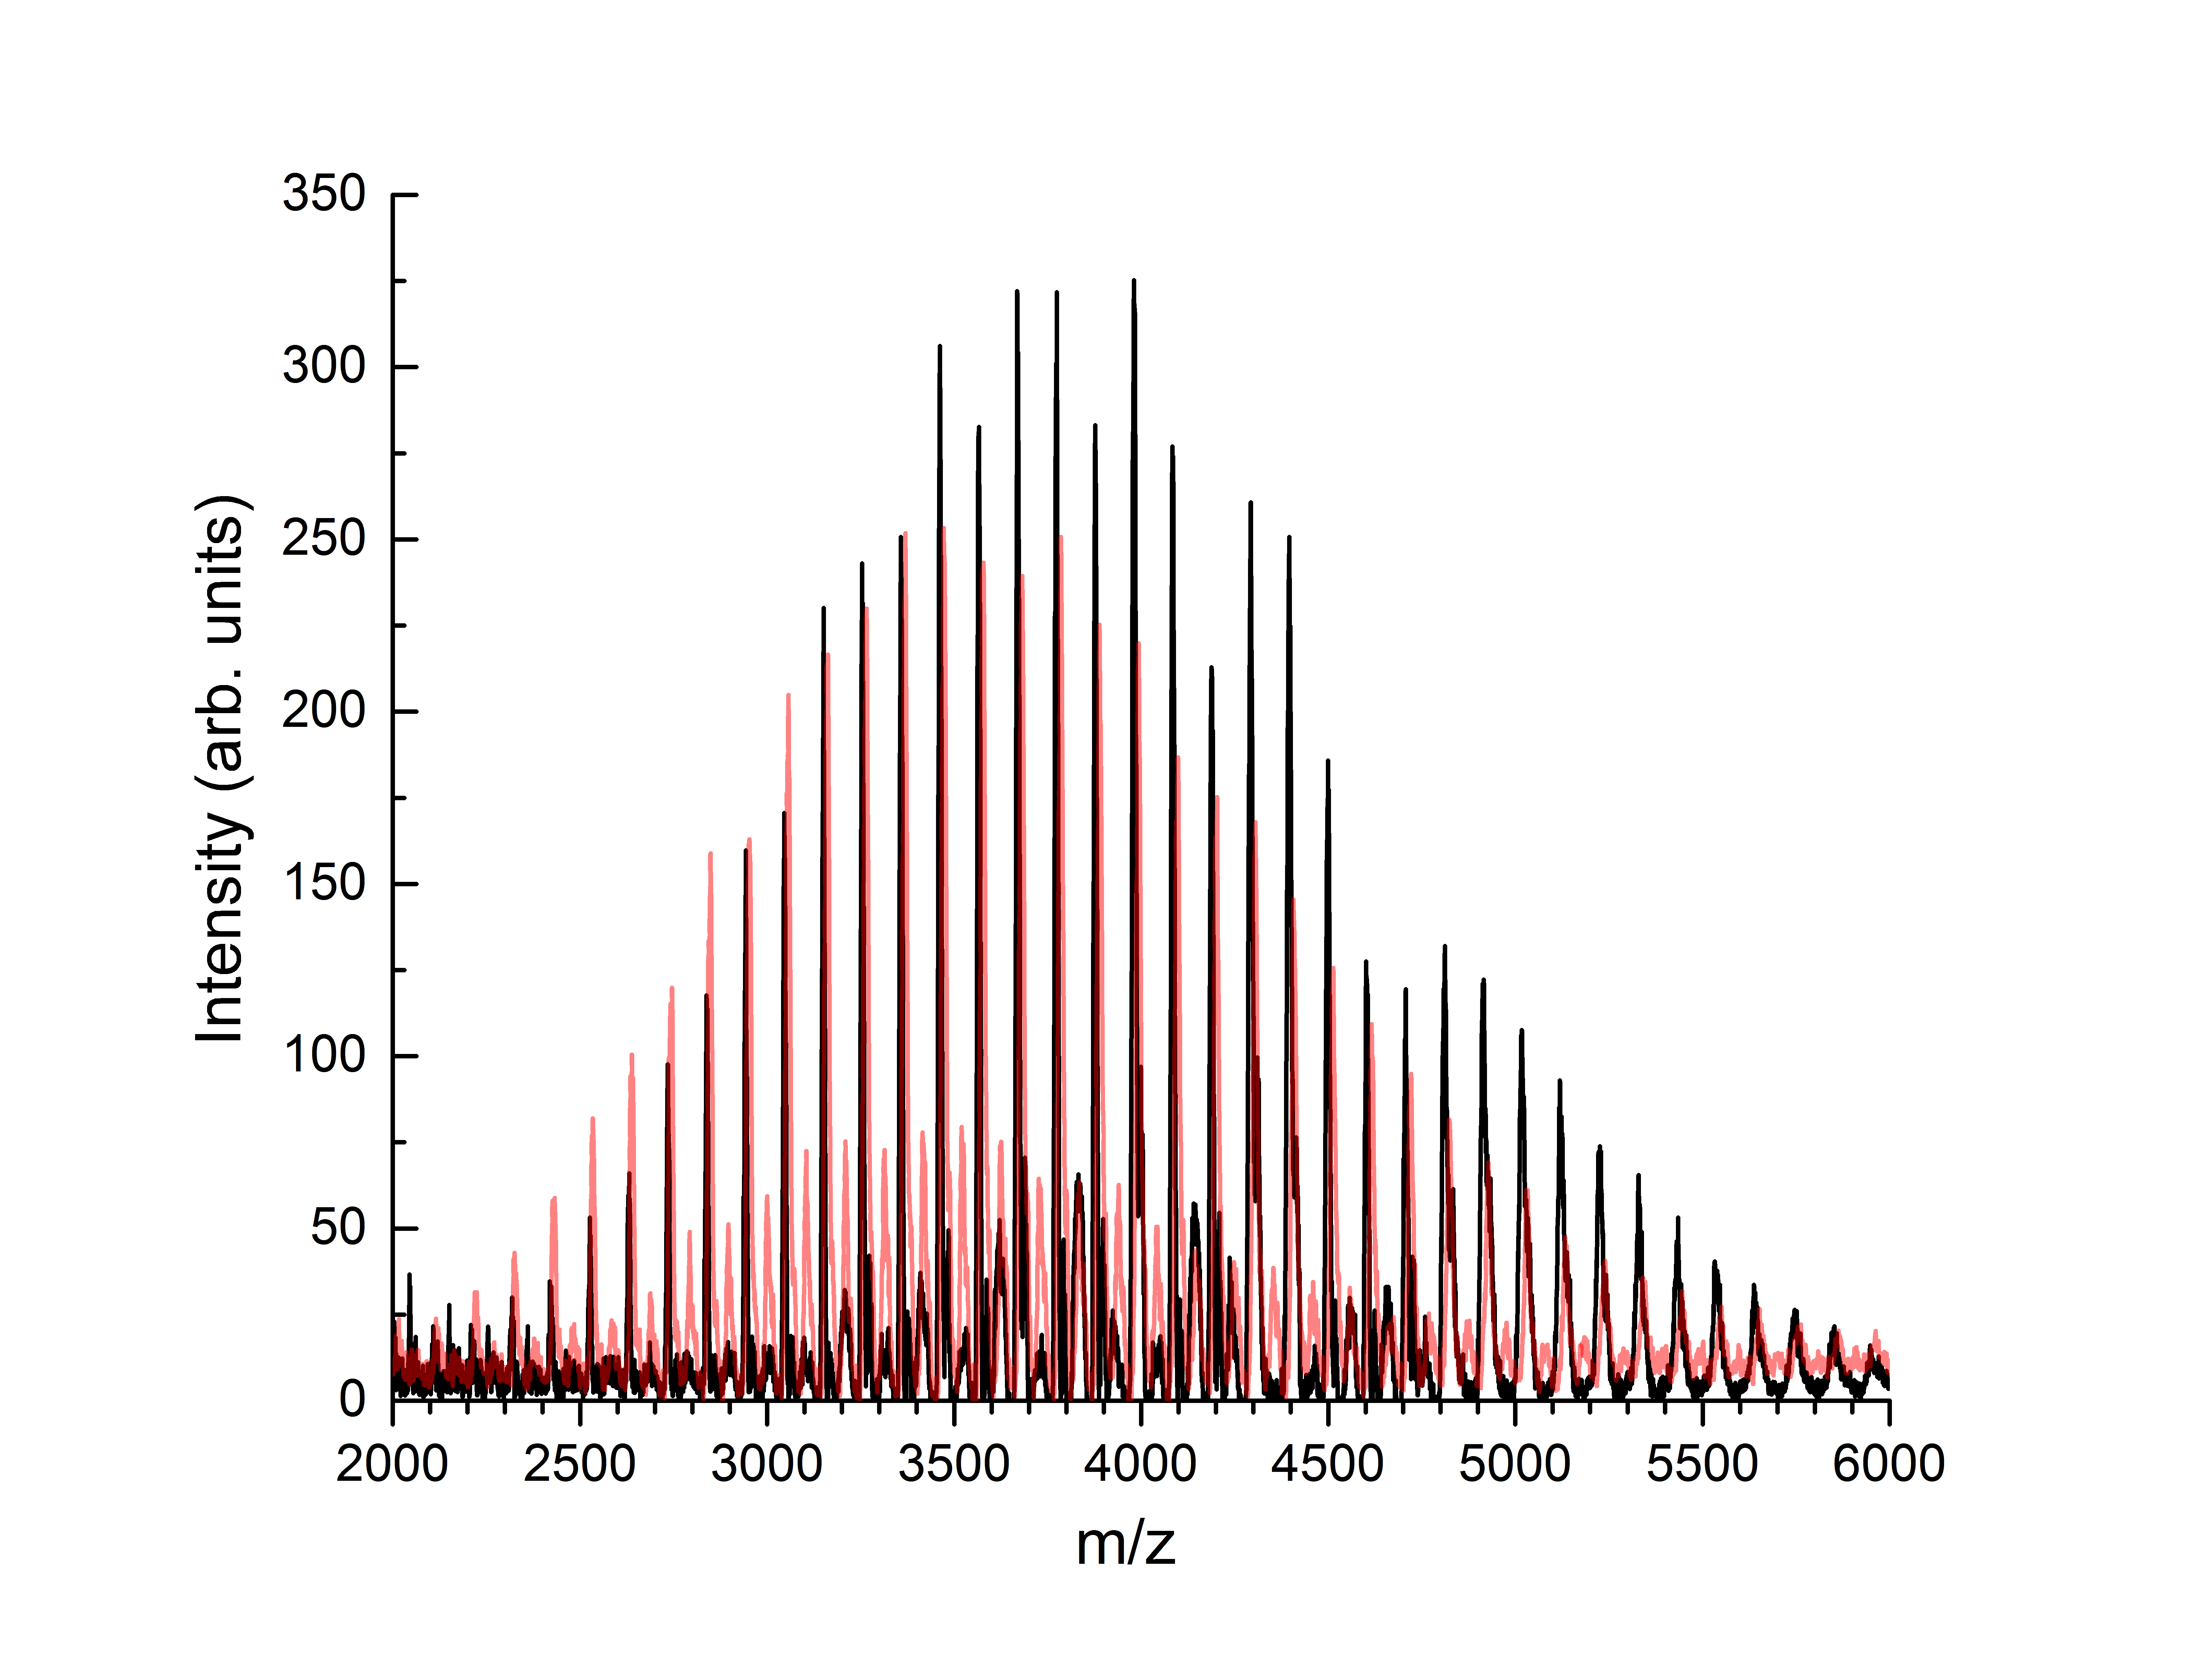
Finally, we investigated whether changes in grain size due to differing ordering kinetics could be induced by differences in the shape or width of the disorder-order transition (). Specifically, we hypothesized that subtle differences in the polydispersity of the two neat diblock samples may underpin the observed differences in the grain sizes produced during ordering. Analysis of matrix-assisted laser desorption/ionization (MALDI) spectra (Supporting Information) indicates that both neat diblocks have Đ1.04. Additionally, plots of primary scattering peak intensity as a function of reduced temperature () show no discernible differences in for all five samples (Figure 5), suggesting no significant differences in ordering kinetics, even for the blends which have increased polydispersity compared to the neat samples. A similar observation was reported for binary blends of PS-b-PI where increases in polydispersity due to blending resulted in negligible effects on the width of the ordering transition, Floudas et al. (1996). We therefore conclude that the observed differences in grain size are not due to polydispersity effects.
Though we can rationalize that heterogeneous nucleation may be responsible for the grain size differences in our five samples, it is important to note that in our comparison of the driving force for alignment for homogenous nucleation in the 3.6K and 5.5K samples, we assume that is the same in both systems, given negligible polydispersity differences and identical chemistry. Recent work, both theoretical and experimental, has shown that at low N, can be appreciably higher than for the case, possibly due to the significance of end group effectsGillard et al. (2015). Given the low molecular weight of both samples( 30-50 monomer units), it is likely that is a function of . We expect that the ramifications of a larger may be non-trivial and that the overall effect of a larger at smaller on grain growth kinetics may be convoluted and not readily anticipated by a straightforward application of existing theory.
The field-dependent orientation distribution coefficient for the 5.5K sample, 0.9 (red circle at =1 in Figure 3C), yields an estimate of 1.2 m for the characteristic grain size that would, at a steady state, reproduce the orientation distributions measured in aligned samples.Rokhlenko et al. (2015) Mirroring the 3.5-fold difference in grain size between the two neat diblocks calculated in this work by the variance scattering method, we can assume that the 3.6K sample has grains of 0.35 m at steady state, which, from previous work Rokhlenko et al. (2015), is predicted to give an orientational order parameter of 0.2 at 6 T. This is comparable to what is observed experimentally for the 3.6K sample (red circle at =0 in Figure 3C), which suggests that grain size differences alone can account for the discrepancy in alignment in these two neat diblock systems. While it may appear that there is little change in grain size between and in Figure 4, the grain size in fact changes by a factor of 1.5X. Although modest, this change is expected to manifest itself in the observed alignment quality due to the strong cubic dependence of magnetostatic energy density on (Eq.3).
In conclusion, this study relates an observed difference in alignment of two PS-b-P4VP BCPs with a three-fold difference in grain size. The disparity in grain size contributes to markedly different alignment behaviors. The orientational order parameters are 0.2 and 0.9 for the lower and higher MW materials, respectively. There are limited ways to systematically independently manipulate grain size in BCP systems. Controlled cooling through is one option, though variations of cooling rate become convoluted with alignment kinetics in field alignment studies. Adding a heterogeneous component to the system (i.e. doping with a nucleating agent to decrease average grain size) can also be effective, particularly if the added species is colloidal, rather than molecular, in nature and therefore not likely to affect the interaction parameter . The approach used here, blending, provides a third method, although we lack a clear interpretation of the reasons for its effectiveness. Blending produced samples with grain sizes that were intermediate between those of the neat BCPs without the addition of a chemically dissimilar component. The blended BCPs studied here display and d-spacings that interpolate between the neat blocks. The orientational order parameters vary concomitantly, suggesting that blending can be used as an effective strategy to modify grain growth kinetics in BCPs.
Acknowledgements.
The authors thank N. Balsara and Z-G. Wang for insightful discussions regarding grain growth in block copolymers, S. Sinha for assistance with MALDI-TOF measurements, and the reviewers for helpful feedback. This work was supported by NSF under DMR-1410568 and DMR-1119826. Facilities use was supported by YINQE. P.G. acknowledges support under DMR-1507409. Additionally, this research used resources of the Center for Functional Nanomaterials, which is a U.S. DOE Office of Science Facility, at Brookhaven National Laboratory under Contract No. DE-SC0012704.SUPPORTING INFORMATION
PS-b-P4VP Sample Information
PS-b-P4VP 3.6K and 5.5K samples were synthesized by living anionic polymerization. The 3.6K material was synthesized in-house, while the 5.5K material was purchased from Polymer Source. The three blends of the two polymers were prepared in different ratios by dissolution of both in THF, dropcasting onto a heated slide at 35∘C, and subsequent vacuum annealing above the glass transitions of both blocks at 200 ∘C for one hour to ensure complete solvent removal.
| Sample | Source | Mn(BCP) (kg/mol) | Mn(PS) (kg/mol) | Mn(P4VP) (kg/mol) | PDI |
|---|---|---|---|---|---|
| 3.6K | Gopalan Group | a3.6 | a1.9 | a1.7 | c1.04 |
| 5.5K | Polymer Source | a5.0 | a2.4 | a2.6 | c1.04 |
| b5.5 | b2.7 | b2.8 | b1.20 |
aMn determined via NMR by Gopalan Group at the University of Wisconsin-Madison
bMn and PDI information provided by Polymer Source
cPDI calculated from MALDI-TOF-MS spectra
Determination of
was determined from scattering data in the conventional manner as the temperature at which the system displayed a decrease in scattered intensity equivalent to 50% of the intensity change on transiting the ODT during cooling.
Analysis of polydispersity by MALDI-TOF-MS spectra
Gel permeation chromatography (GPC) could not be used effectively to compare the polydispersity indices (PDI) of the neat diblocks due to their small and similar values of their molecular weights. MALDI-TOF-MS was used instead. Samples for MALDI-TOF-MS analysis were prepared by mixing the polymer and matrix (2,5-dihydroxybenzoic acid) in THF at a 10:1 ratio with an overall concentration of 0.03 mg/ml. 0.5 ul solutions were pipetted onto a MALDI plate, and spectra were collected in linear positive mode at an accelerating voltage of 25,000 V. and were calculated according to Equations (9) and (10). For each peak , is the mass at the peak maximum and is the area for each mass.
| (9) | |||
| (10) |
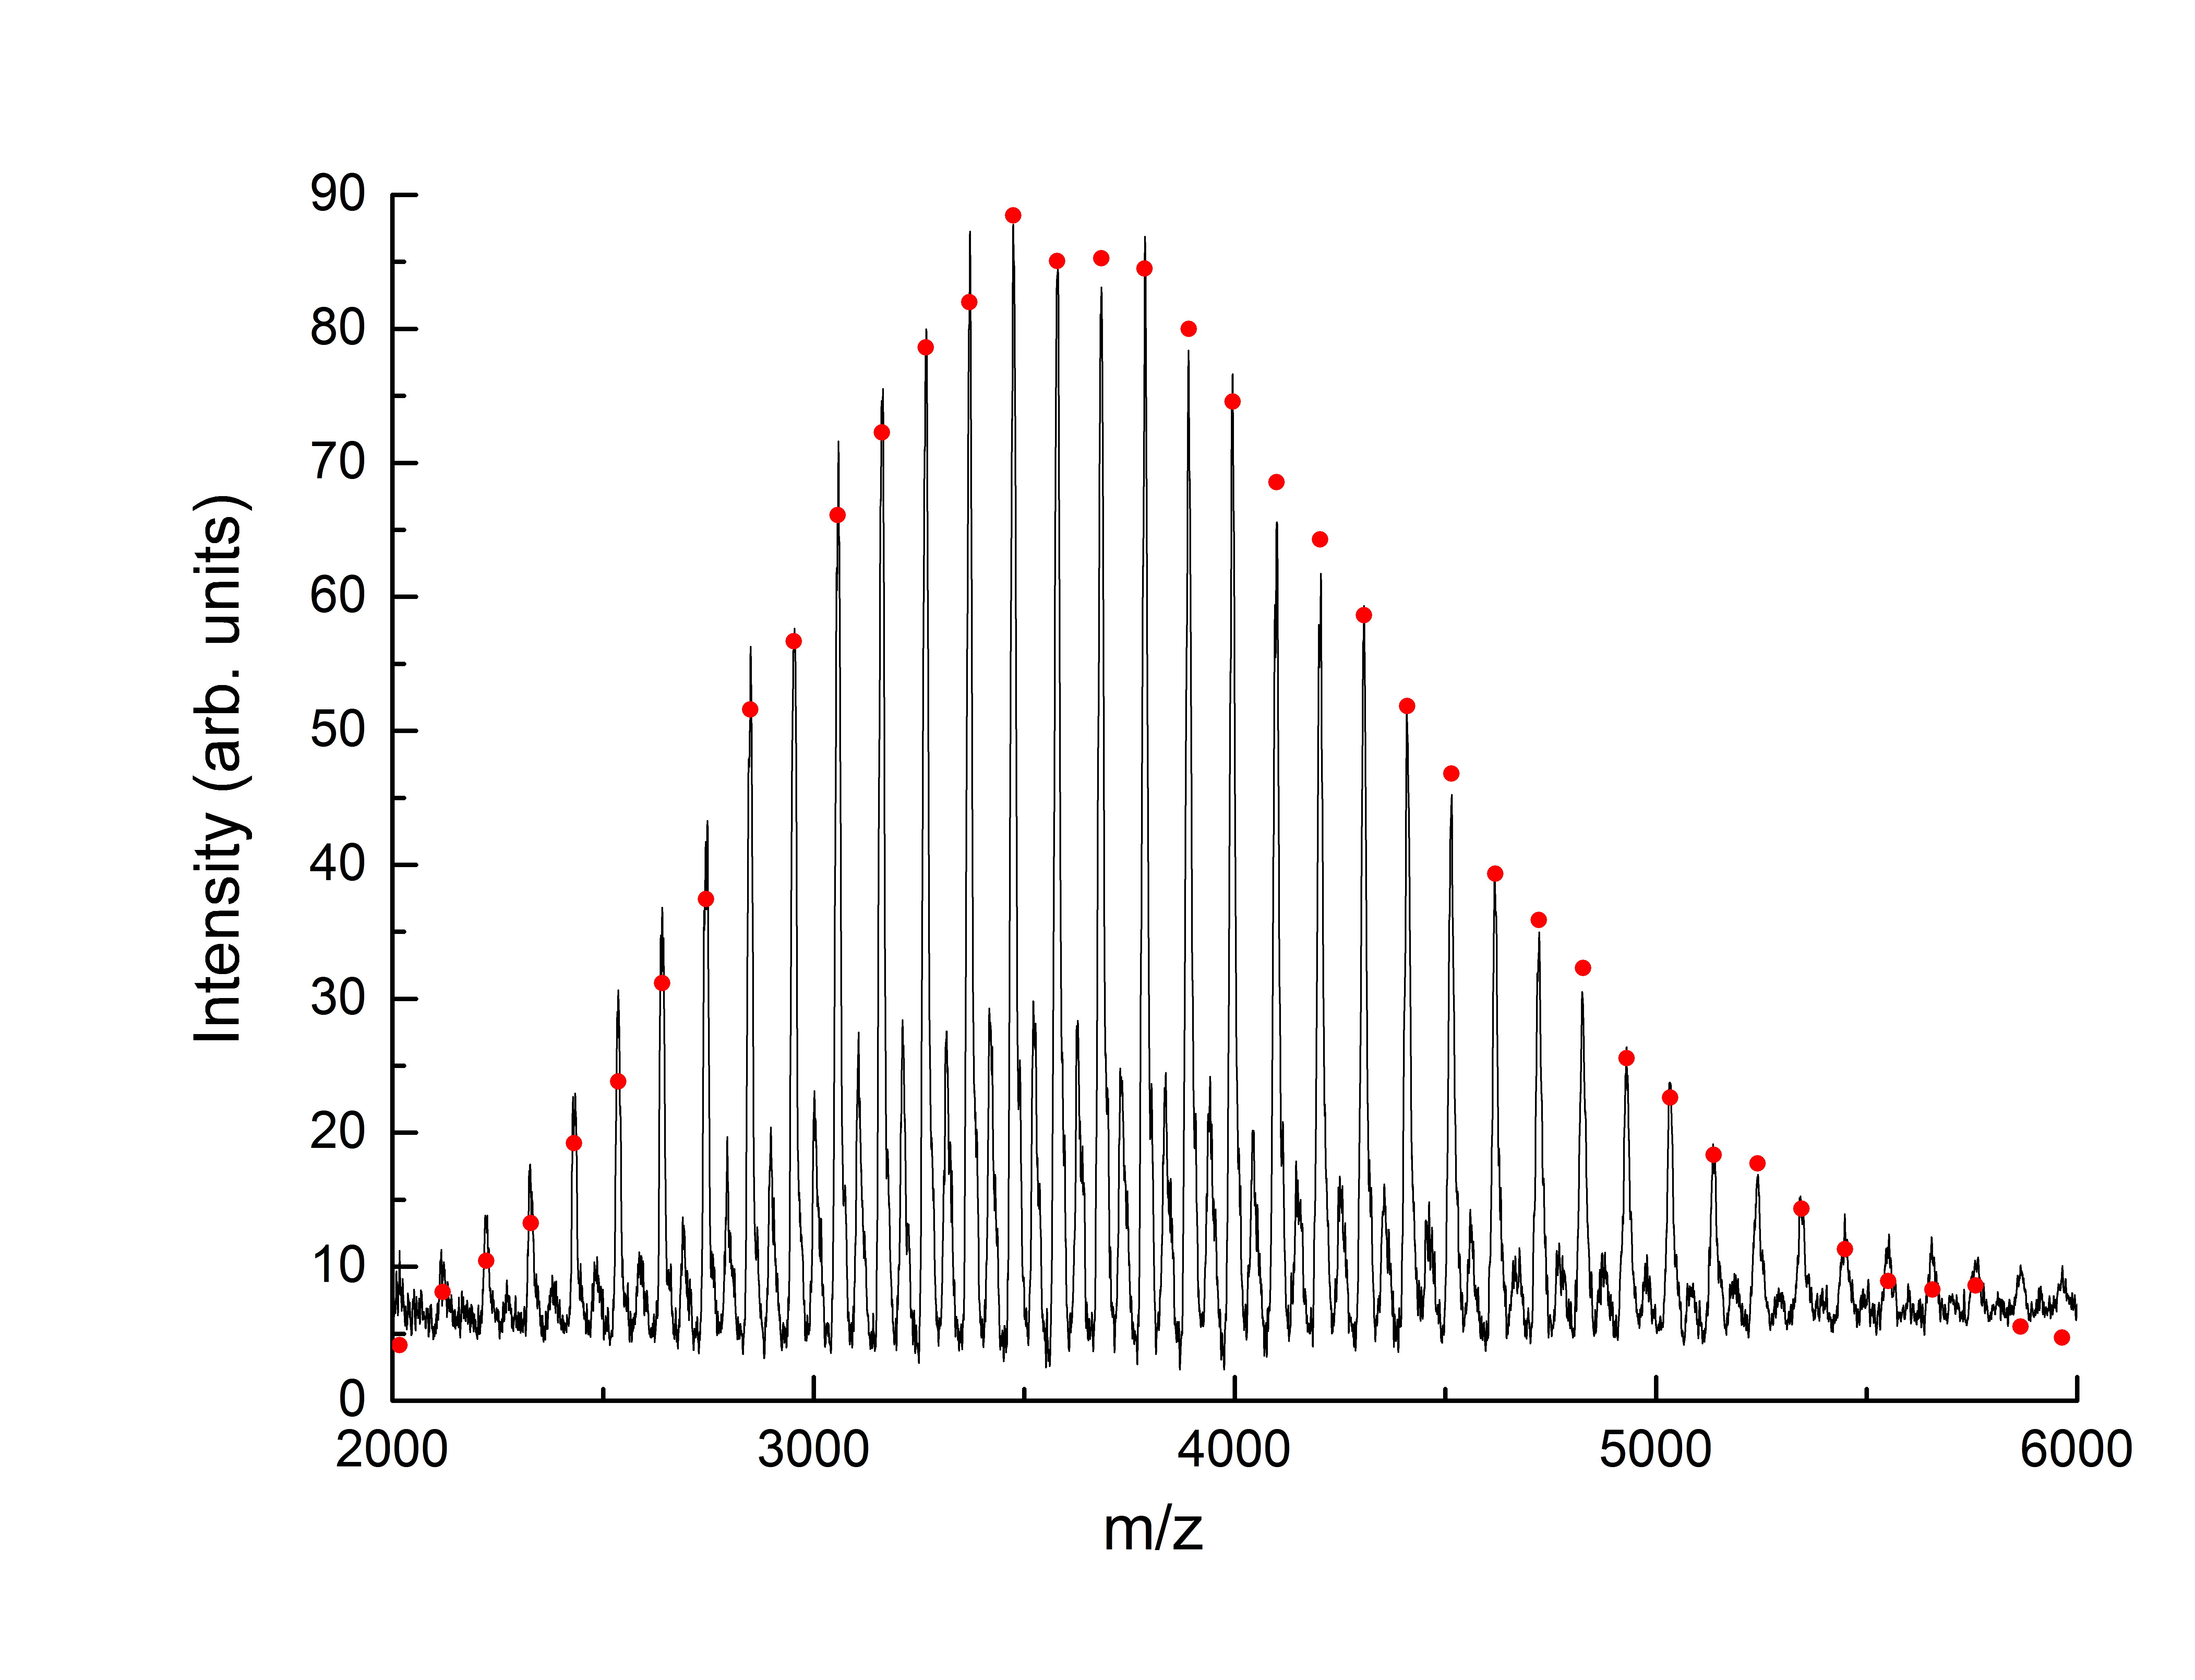
The resulting MALDI spectra for samples 3.6K and 5.5K are shown below:
Representative TEM Images
Grain Size Determination by Variance Analysis
The samples were prepared as described in Ref.Rokhlenko et al. (2015). Briefly, the samples used for this analysis were cooled 0.3 K/min. in the absence of the field and then mechanically polished to a thickness of 100-200 m. The thickness for each was recorded to 2 m accuracy. SAXS data was then collected in transmission mode for one hour from independent spots. A comprehensive description of the ‘variance scattering’ method for grain size determination can be found in Ref.Yager and Majewski (2014). Briefly, each 2D scattering pattern is integrated along the scattering ring to give as shown in the left of Figure 11. Here, as an example, we show for one measurement of the 3.6K sample. The right graph of Figure 11 shows a histogram of these intensity values.
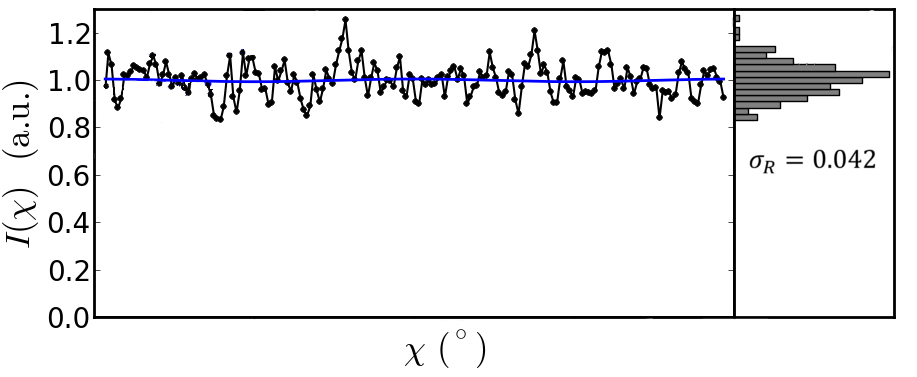
The standard deviation in these values is one of four metrics that can be extracted from the raw data which can be used to calculate the number of grains probed . The scaling of and the other three metrics with respect to the number of grains is shown in Figure 3 of Ref.Yager and Majewski (2014). All metrics gave consistent results, but for the results presented in the main text, we used the standard deviation metric . From Figure 3 of Ref.Yager and Majewski (2014), we can see that provides a clean power law scaling for over many orders of magnitude in the form :
| (11) |
With knowledge of the probed scattering volume (V) and extracted value , the average characteristic grain dimension can be calculated as . This analysis implicitly assumes an isotropic distribution of grain orientations, with relatively well-defined grain boundaries. Twelve independent measurements on each sample were conducted to improve statistics, and to estimate measurement error bars.
References
- Osuji et al. (2004) C. Osuji, P. J. Ferreira, G. Mao, C. K. Ober, J. B. Vander Sande, and E. L. Thomas, Macromolecules 37, 9903 (2004), ISSN 0024-9297, URL http://dx.doi.org/10.1021/ma0483064.
- Tao et al. (2007) Y. Tao, H. Zohar, B. D. Olsen, and R. A. Segalman, Nano Lett. 7, 2742 (2007), ISSN 1530-6984, URL http://dx.doi.org/10.1021/nl0712320.
- Gopinadhan et al. (2010) M. Gopinadhan, P. W. Majewski, and C. O. Osuji, Macromolecules 43, 3286 (2010), ISSN 0024-9297, URL http://dx.doi.org/10.1021/ma9026349.
- Gopinadhan et al. (2012) M. Gopinadhan, P. W. Majewski, E. S. Beach, and C. O. Osuji, ACS Macro Lett. 1, 184 (2012), URL http://dx.doi.org/10.1021/mz2001059.
- Ferri et al. (1998) D. Ferri, D. Wolff, J. Springer, O. Francescangeli, M. Laus, A. S. Angeloni, G. Galli, and E. Chiellini, J. Polym. Sci. B Polym. Phys. 36, 21 (1998), ISSN 1099-0488, URL http://dx.doi.org/10.1002/(SICI)1099-0488(19980115)36:1<21::AID-POLB3>3.0.CO;2-X.
- Hamley et al. (2004) I. W. Hamley, V. Castelletto, Z. B. Lu, C. T. Imrie, T. Itoh, and M. Al-Hussein, Macromolecules 37, 4798 (2004), ISSN 0024-9297, URL http://dx.doi.org/10.1021/ma0498619.
- Majewski et al. (2012) P. W. Majewski, M. Gopinadhan, and C. O. Osuji, J. Polym. Sci., Part B: Polym. Phys. 50, 2 (2012).
- Tran et al. (2013) H. Tran, M. Gopinadhan, P. W. Majewski, R. Shade, V. Steffes, C. O. Osuji, and L. M. Campos, ACS Nano 7, 5514 (2013), eprint http://dx.doi.org/10.1021/nn401725a, URL http://dx.doi.org/10.1021/nn401725a.
- Rokhlenko et al. (2015) Y. Rokhlenko, M. Gopinadhan, C. O. Osuji, K. Zhang, C. S. O’Hern, S. R. Larson, P. Gopalan, P. W. Majewski, and K. G. Yager, Phys. Rev. Lett. 115, 258302 (2015), URL http://link.aps.org/doi/10.1103/PhysRevLett.115.258302.
- Gopinadhan et al. (2013) M. Gopinadhan, P. W. Majewski, Y. Choo, and C. O. Osuji, Phys. Rev. Lett. 110, 078301 (2013), URL http://link.aps.org/doi/10.1103/PhysRevLett.110.078301.
- Matsen (1995) M. W. Matsen, Macromolecules 28, 5765 (1995), ISSN 0024-9297, URL http://dx.doi.org/10.1021/ma00121a011.
- Floudas et al. (1997) G. Floudas, N. Hadjichristidis, M. Stamm, A. E. Likhtman, and A. N. Semenov, J. Chem. Phys. 106, 3318 (1997), URL http://scitation.aip.org/content/aip/journal/jcp/106/8/10.1063/1.473080.
- Perlich et al. (2007) J. Perlich, L. Schulz, M. M. Abul Kashem, Y.-J. Cheng, M. Memesa, J. S. Gutmann, S. V. Roth, and P. Müller-Buschbaum, Langmuir 23, 10299 (2007), ISSN 0743-7463, URL http://dx.doi.org/10.1021/la701412q.
- Hashimoto et al. (1993) T. Hashimoto, K. Yamasaki, S. Koizumi, and H. Hasegawa, Macromolecules 26, 2895 (1993).
- Kane et al. (1996) L. Kane, M. M. Satkowski, S. D. Smith, and R. J. Spontak, Macromolecules 29, 8862 (1996), ISSN 0024-9297, URL http://dx.doi.org/10.1021/ma9613291.
- Zhang et al. (2011) X. Zhang, J. N. Murphy, N. L. Y. Wu, K. D. Harris, and J. M. Buriak, Macromolecules 44, 9752 (2011), ISSN 0024-9297, URL http://dx.doi.org/10.1021/ma202064t.
- Fredrickson and Helfand (1987) G. H. Fredrickson and E. Helfand, J. Chem. Phys. 87, 697 (1987).
- Leibler (1980) L. Leibler, Macromolecules 13, 1602 (1980), ISSN 0024-9297, URL http://dx.doi.org/10.1021/ma60078a047.
- Yager and Majewski (2014) K. G. Yager and P. W. Majewski, J. Appl. Crystallogr. 47, 1855 (2014), URL http://dx.doi.org/10.1107/S1600576714020822.
- Gu et al. (2016) X. Gu, I. Gunkel, A. Hexemer, and T. P. Russell, Macromolecules (2016).
- Dai et al. (1996) H. J. Dai, N. P. Balsara, B. A. Garetz, and M. C. Newstein, Phys. Rev. Lett. 77, 3677 (1996), URL http://link.aps.org/doi/10.1103/PhysRevLett.77.3677.
- Balsara et al. (1998) N. Balsara, B. Garetz, M. Chang, H. Dai, M. Newstein, J. Goveas, R. Krishnamoorti, and S. Rai, Macromolecules 31, 5309 (1998).
- Kim et al. (2001) W. G. Kim, B. A. Garetz, M. C. Newstein, and N. P. Balsara, J. Polym. Sci. B Polym. Phys. 39, 2231 (2001), ISSN 1099-0488, URL http://dx.doi.org/10.1002/polb.1197.
- Chastek and Lodge (2004) T. Q. Chastek and T. P. Lodge, Macromolecules 37, 4891 (2004).
- Chastek and Lodge (2006) T. Q. Chastek and T. P. Lodge, J. Polym. Sci., Part B: Polym. Phys. 44, 481 (2006).
- Goveas and Milner (1997) J. L. Goveas and S. T. Milner, Macromolecules 30, 2605 (1997), ISSN 0024-9297, URL http://dx.doi.org/10.1021/ma961181l.
- Avrami (1940) M. Avrami, J. Chem. Phys. 8, 212 (1940).
- Axe and Yamada (1986) J. Axe and Y. Yamada, Phys. Rev. B 34, 1599 (1986).
- Fredrickson and Binder (1989) G. H. Fredrickson and K. Binder, J. Chem. Phys. 91, 7265 (1989), URL http://scitation.aip.org/content/aip/journal/jcp/91/11/10.1063/1.457294.
- Floudas et al. (1996) G. Floudas, D. Vlassopoulos, M. Pitsikalis, N. Hadjichristidis, and M. Stamm, J. Chem. Phys. 104, 2083 (1996), URL http://scitation.aip.org/content/aip/journal/jcp/104/5/10.1063/1.470965.
- Gillard et al. (2015) T. M. Gillard, P. Medapuram, D. C. Morse, and F. S. Bates, Macromolecules 48, 2801 (2015), eprint http://dx.doi.org/10.1021/acs.macromol.5b00277, URL http://dx.doi.org/10.1021/acs.macromol.5b00277.