Structural properties of water confined by phospholipid membranes
Abstract
Biological membranes are essential for the cell life and hydration water provides the driving force for their assembly and stability. Here we study the structural properties of water in a phospholipid membrane. We characterize local structures inspecting the intermediate range order (IRO) adopting a sensitive local order metric, recently proposed by Martelli et al., which measures and grades the degree of overlap of local environments with structures of perfect ice. Close to the membrane, water acquires high IRO and changes its dynamical properties, e.g., slowing down its translational and rotational degrees of freedom in a region that extends over nm from the membrane interface. Surprisingly, we show that at a distance as far as nm from the interface, although the bulk-like dynamics is recovered, water’s IRO is still slightly higher than in bulk at the same thermodynamic conditions. Therefore, the water-membrane interface has a structural effect at ambient conditions that propagates further than the often-invoked nm-length scale, a results that should be taken carefully into account when analyzing experimental data of water confined by membranes and could help us understanding the role of water in biological systems.
I Introduction
Biological membranes provide a limiting structure which separates the interior and exterior of cells and organelles. Being selectively permeable, they control the flow of substances in and out of the cell, which permits to regulate the composition of the cell and the communication between cells through signalling. Membranes are also involved in the capture and release of energy.
Biological membranes are composed of a variety of biomolecules, including proteins, sugars, cholesterol, and phospholipids. Among those components, phospholipids provide the structure to biological membranes, since they can spontaneously self-assemble due to the hydrophobic effect into bilayers. For this reason, phospholipid membranes are used as a model to investigate basic properties of biological membranes both in experimental and theoretical studies. Among a wide variety of phospholipids, dimyristoylphosphatidylcholine (DMPC) are phospholipids with a choline as a headgroup and a tailgroup formed by two myristoyl chains. Choline based phospholipids are ubiquitous in cell membranes and used in drug targeting liposomes Hamley (2007).
Hydration water is fundamental for the proper functioning of biological membranes. Indeed, it is known that the presence of water strongly influences the stability, fluidity and phase behavior of phospholipid membranes, which determines their function. In addition, hydration water mediates the interaction of biological membranes with other biomolecules and with ions. Due to its importance, hydration water at phospholipid membranes has been extensively studied experimentally Fitter et al. (1999); Trapp et al. (2010); Wassall (1996); Volkov et al. (2007); Zhao et al. (2008); Tielrooij et al. (2009); Wei Hua (2015) and using computer simulations Róg et al. (2002); Bhide and Berkowitz (2005); Berkowitz et al. (2006); von Hansen et al. (2013); Zhang and Berkowitz (2009); Gruenbaum and Skinner (2011); Calero et al. (2016). The results show that water is abundant in the interfacial region of bilayers (lipid headgroups), and can even penetrate into deeper regions of the membrane Bhide and Berkowitz (2005); Calero et al. (2016). As a result, fully hydrated DMPC can take 30 hydration water molecules per lipid. Furthermore, computer simulations show that water molecules form strong hydrogen bonds with lipid phosphate groups, as well as with the carbonyl oxygens of phosphatidylcholine lipids Róg et al. (2002); Bhide and Berkowitz (2005), slowing down both water orientational Volkov et al. (2007); Zhao et al. (2008); Tielrooij et al. (2009); Zhang and Berkowitz (2009); Gruenbaum and Skinner (2011); Calero et al. (2016) and translational Wassall (1996); Calero et al. (2016) dynamics. At low hydration water is kept inside the membrane revealing its essential role to guarantee structural stability Calero et al. (2016). In highly hydrated systems, i.e., when lipid surfaces are in contact with many water molecules, dynamical properties of bulk water such as diffusivity and rotational dynamics, and density are recovered at relatively short distances from the lipid surface (see, e.g., Calero et al. Calero et al. (2016)). On the other hand, structural characterization of water in such systems are lacking, mostly because structural properties are counted for grant once the density is known.
In this article, we characterize the local structure
at the intermediate range order (IRO),
i.e. the second shell of neighbors,
of water molecules confined in between two membranes, each made of a lipid bilayer.
We employ a
sensitive local order metric (LOM) recently introduced by Martelli et al. Martelli et al. (2016). The LOM characterizes the molecular order in the neighborhood of a
site in a liquid, an amorphous or a crystal.
We compare the IRO of each water molecule with the IRO of perfect
cubic, I, ice and we grade the degree
of deviation from the perfect I structure 111Similar results hold when using the second shell of neighbors
on hexagonal ice as a reference structure.
We measure the extent to which the lipid surfaces affect the structure
of water at different distances from the surface, and we relate structural changes with dynamical changes.
We find that the membrane perturbs the IRO of water at a distance of at least nm, while bulk dynamical
properties are recovered closer to the membrane ( nm), a result that be should takene carefully into account
when analyzing experimental and/or theoretical results of confined water in general, and that could provide further insights
in understanding water properties under such conditions Marzio et al. (2017).
Water molecules acquire more and more
local order moving to the proximity of the fluctuating lipid surfaces.
This effect is small but
not negligible, and is accompanied by a slowing down in the translational and rotational degrees of freedom,
in agreement with previous experimental and numerical observations Volkov et al. (2007); Zhao et al. (2008); Tielrooij et al. (2009); Zhang and
Berkowitz (2009); Gruenbaum and
Skinner (2011); Calero et al. (2016); Wassall (1996).
Interestingly, approaching the interfaces water molecules show a sudden drop in the translational degrees
of freedom, to values comparable to water at deeply undercooled conditions.
We also observe that, approaching the lipid interfaces, the rotations around the water dipole are less affected
then the rotations round the vector, indicating that the interactions between P–groups and water hydrogens
are stronger–and more probable–than the interactions between N-heads and water oxygen.
The article is organized as follows. In Section II we present the details of the LOM and
the details of the numerical simulations. In Section III we show
our findings. Our conclusions and final remarks are presented in Section IV
II Methods
II.1 The local order metric
Recently Martelli et al. Martelli et al. (2016) introduced a LOM that measures the degree of order in the neighborhood of an atomic or molecular site in a condensed medium.
The local environment of a water molecule () in a configuration defines a local pattern formed by neighboring sites. Here we include only the oxygen atoms second neighbors of the oxygen site . Indicating by () the coordinates in the laboratory frame of the neighbors of pattern , we define the centroid as and the rescaled positions as .
To compare the local order of the pattern with a reference structure, we choose sites in a given lattice and set the lattice step equal to the th O–O bond unit (BU) , i.e. the average equilibrium - distance in the pattern. The pattern- centroid and the reference- centroid are set to coincide, while the reference orientation is arbitrary. The local order metric at site is the maximum of the overlap function when the reference orientation is varied and the pattern indices are permuted, i.e.
| (1) |
where are Euler angles for a given orientation of the reference, are the permuted indices of the pattern sites corresponding to a permutation , and is a parameter that controls the spread of the Gaussian functions. This value is chosen such that the tails of the Gaussians spread to half of the interatomic distance between oxygens in the second shell of neighbors in perfect cubic ice at ambient conditions. As a consequence of the point symmetry of the reference the overlap function defined in Eq. (1) has multiple equivalent maxima. To compute it is sufficient to locate only one of these maxima. The point symmetry of the reference allows us to explore only a fraction of the Euler angle domain , which we call , the irreducible domain of the Euler angles, being the number of proper point symmetry operations of the reference. Inside we pick at random with uniform probability orientations and we select permutations by assigning nearest pattern-reference pairs. With the best alignement out of the orientations, we fix the permutation and optimize the orientation via conjugate gradient.
The LOM is an intrinsic property of the local environment at variance with the straightforward overlap function that would depend on the orientation of the reference and on the ordering of the sites in the pattern. The LOM satisfies the inequalities . The two limits correspond, respectively, to a completely disordered local pattern () and to an ordered local pattern matching perfectly the reference (), therefore grading each local environment on an increasing scale of local order from zero to one.
We define an order parameters based on as the average score , or site averaged LOM,
| (2) |
and we refer to as score.
II.2 Simulations details
We perform molecular dynamics (MD) simulations of water molecules confined between two layers of DMPC lipids 222We use here a higher number of water molecules with respect to that considered in Ref. Calero et al. (2016) for a similar system. We use periodic boundary conditions in all directions in such a way that our systems corresponds to water confined between the two different sides of the same lipid bilayer. The bilayer has an average width of 3 nm and the extension of the entire system along the direction perpendicular to the bilayer is of 8.5 nm.
We use the simulation package NAMD 2.9 Phillips et al. (2005) at a temperature of 303 K and an average pressure of 1 atm. We set the simulation time step to 2 fs. We describe the structure of phospholipids and their mutual interactions by the recently parameterized force field CHARMM36 Klauda et al. (2010); Lim et al. (2012), which is able to reproduce the area per lipid in excellent agreement with experimental data. The water model employed in our simulations, consistent with the parametrization of CHARMM36, is the modified TIP3P Jorgensen et al. (1983); A. D. MacKerell et al. (1998). We cut off the Van der Waals interactions at 12 Å with a smooth switching function starting at 10Å. We compute the long ranged electrostatic forces with the help of the particle mesh Ewald method U.Essmann et al. (1995), with a grid space of about 1 Å. After energy minimization, we equilibrate the hydrated phospholipid bilayers for 10 ns followed by a production run of 2 ns in the ensemble at 1 atm. In the simulations, we control the temperature by a Langevin thermostat H.J.C.Berendsen et al. (1984) with a damping coefficient of 0.1 ps-1, and we control the pressure by a Nosé-Hoover Langevin barostat S.E.Feller et al. (1995) with a piston oscillation time of 200 fs and a damping time of 100 fs.
III Results
III.1 Structure
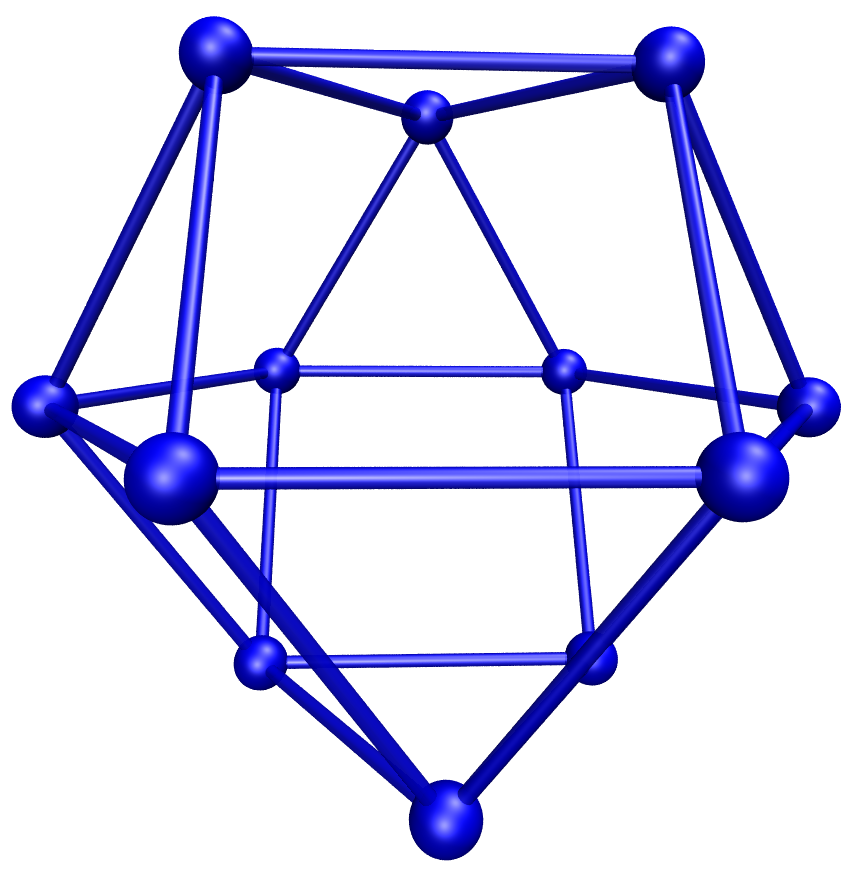
We characterize the local structures adopting as a reference a cuboctahedron (Fig. 1), belonging to the class of Archimedean solids enriched with edge-transitivity Read and Wilson (2016) and describing the oxygen lattice in the second shell of neighbors in a perfect cubic I ice. Analogous results can be drawn using the anticuboctahedron () which describes the oxygen lattice in the second shell of neighbors in perfect hexagonal I ice.
In Fig. 1 the six-folded ring on the -plane is a plane of inversion. In the case of hexagonal ice, one of the two three-folded rings above or below the -plane is rotated by .
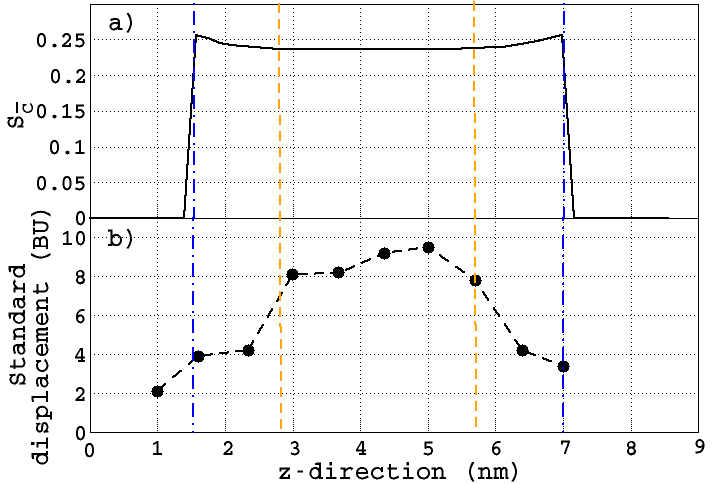
We divide the entire system along the direction perpendicular to the bilayer in 10 bins and calculate, for the water molecules within each bin centered at distance from the center of the bilayer, the average score (Fig. 2.a). We find that is approximately constant in a central region with 2.8 nm 5.8 nm (vertical dashed orange lines in Fig. 2.a) between the lipid layers. The score slightly increases moving from the center toward the lipid interfaces at nm and nm. The sudden drops in , at nm and nm, correspond to the average position of the fluctuating water-membrane interface (vertical dashed-dotted blue lines) The behavior of suggests that the interface has a significant effect on water structure over a distance nm from the interface, while at larger distance water might be bulk-like, at least for some properties.
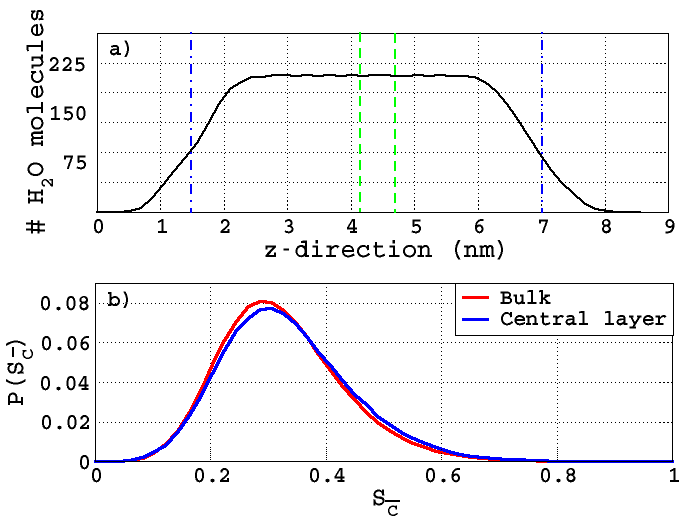
To better understand how, and to which extent, confined water becomes bulk-like, we calculate the number of water molecules as function of the distance (or ) from the center of the membrane (Fig. 3.a). We find that on average water penetrates within the membrane, that extends up to nm (or nm, i.e. nm) and populates the confined region between the membranes with a density profile that saturates at nm further distance from the membrane at nm (or nm, i.e. nm).
This results are consistent with the analysis of a previous studies Calero et al. (2016), where Calero et al. introduce the intrinsic distance () from the membrane by performing a two-dimensional Voronoi tessellation of the average plane of the membrane (the -plane) using the phosphorous and nitrogen atoms of the phospholipid heads as centers of the Voronoi cells. The introduction of where is the coordinate of the center of the Voronoi cell, allows one to characterize the water density profile filtering out the noise induced by the fluctuations of the water-membrane interface. In particular, the use of emphasizes the penetration of water within the membrane, the layering of water near the membrane and the existence of a central region with approximately constant density profile at nm away from the interface when the hydration level is comparable at that considered here Calero et al. (2016). Calero et al. show that the density of water is the same as bulk under the same thermodynamic conditions at distances nm apart from the membrane. This observation, therefore, suggests that water in the central region has almost bulk-like properties.
A further comparison with Calero et al. results Calero et al. (2016) shows that the increment of towards the lipid interface resembles the increase of water density along the same directions. This concomitant increment of and might seem counterintuitive, however we rationalize it as a consequence of the isotropic reduction of the distances between all second shell molecules (not shown). Furthermore, the increasing of , i.e. of IRO, is also related to the strengthening of the interactions of water with the lipid membrane, as our analysis of the hydration water dynamics shows in the following subsection.
Strong of the knowledge from the previous work Calero et al. (2016) and from the present analysis (Fig. 3.a), we focus our structural analysis in a central region at a distance of 2.5 nm from the membrane, i.e., with nm nm. We compare the IRO in this region with the IRO of bulk water as obtained from simulations of water molecules at the same thermodynamic conditions and with the same interaction potential. In particular, we compute only for those water molecules with all their second neighbors within the region with constant density profile ( nm nm). We find that the for the central region follows a distribution that differs slightly, but neatly, from the bulk case (Fig. 3.b). In particular, bulk water is slightly less ordered than confined water. This result suggests that the lipid membrane affects the IRO of water at distances as far as nm from the interface, corresponding to approximately seven water diameters. We infer that a possible source of such long range effect are the fluctuations of the membrane, which create dynamical density heterogeneities.
III.2 Dynamics
The effect of the interface on density and structure is accompanied by changes in the dynamical behavior of confined water. For example, Calero et al. Calero et al. (2016) find that the coefficient of diffusion parallel to the membrane and the rotational relaxation time of water confined between lipid membranes approach the bulk values within 25% when water moves further than 0.5 nm from the interface.
Here, to study the dynamics of the membrane-confined water we collect data over ns trajectories and calculate the standard displacement, defined as the distance traveled by a water molecule normalized to the th O–O BU , averaged over all the molecules . We perform the calculation bin by bin (Fig. 2.b).
Our data show that water molecules in the central region between the lipid layers travel up to 10 BU, while they significantly slow down approaching the interface where increases (Fig. 2.b). For the water within 1 nm from the interface, i.e. at nm and nm, the displacement drops by 60% to BU. For water penetrating the membrane, e.g. nm, the translational motion reduces by a further 50% to BU. A standard displacement BU would correspond to water molecules rattling in the cage formed by their nearest neighbors. This case would represent a liquid in which the translational degrees of freedom are frozen. Therefore, our data show a drastic effect of the interface on the water dynamics at least within a distance of 1 nm from the membrane.
To better understand how strong this effect, we compare with the bulk case. The definition of standard displacement depends on the total time of the simulation, therefore we compare with benchmark cases with the same simulation time. As a reference case we use ns trajectories for bulk TIP4P/2005-water. Although we simulate here TIP3P-water and although its properties are fairly different from than of TIP4P/2005-water, a qualitative comparison of results with the two models is still possible. In particular, we observe that close to the lipid interfaces water reaches values similar to those found for supercooled TIP4P/2005-water after ns simulation time Martelli et al. (2016).
This suggests that the increment in the IRO discussed in the previous subsection can be ascribed to the significant slowing down in the translational degrees of freedom. Indeed, a decrease in the translational diffusion can be interpreted as a reduction in the magnitude of the thermal noise. Hence, the configurational entropy contribution to the free energy minimization reduces its relevance while the potential energy term, due to the electrostatic interactions, acquires more weight leading to a more structured configuration.
Further insights on the effects that dynamical properties have on structural properties can be achieved by calculating the correlation functions
| (3) |
being either (i) the dipole vector or (ii) the vector. In particular, Calero et al. show Calero et al. (2016) that encompasses very insightful information about dynamical processes involving molecular rotations.
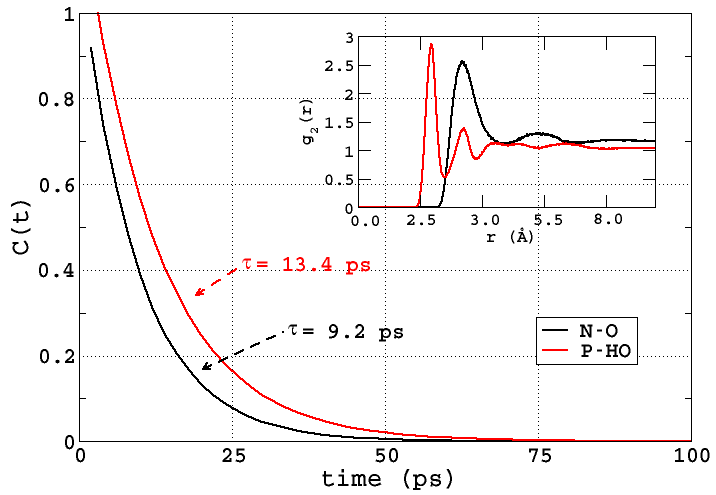
On the other hand, DMPC lipids contain N- and P- heads, with N interacting mostly with water oxygens and P interacting mostly with water hydrogens, indicated as HO. It is reasonable to guess that the N–O and the P–HO interactions have different strengths. This assumption can be directly tested by calculating the time correlation function , where is the N–O vector, or the P–HO vector (Fig. 4). We find that the P–HO vector has a longer lifetime compared to that of the N–O vector, indicating that the interactions between P and water H’s are stronger than the interactions between N and O. This conclusion is also consistent with the observation that the P–HO radial distribution functions (r.d.f.) has the first peak at shorter distance than the r.d.f. for N–O (inset in Fig. 4).
Based upon the observation that the N–O and the P–HO interactions have different strengths, we guess that rotations around are different from those around . In bulk water at these thermodynamic conditions the two rotations are, instead, indistinguishable. Here, we expect them to play a different role in the structure of water at the interface.
We, therefore, calculate and for water molecules belonging to bins centered at different (not shown) and fit them with a double exponential function 333Calero et al. Calero et al. (2016) correctly observe that it is formally more correct to integrate the correlation function to get the rotational time . Although the analysis of gives qualitatively similar conclusions of the one present here, we adopt the common biexponential fitting because it makes more intuitive to reveal the effect of electrostatic interactions on the slow relaxation, which play an important role in our analysis.. From the fits we extract two characteristic times for each , one for each exponential function: , associated to fast relaxation modes, and , associated to the slow relaxation modes (Fig. 5). We interpret the two families of relaxation processes as a consequence of the dynamical heterogeneities induced by the interaction of water with the lipid layers.
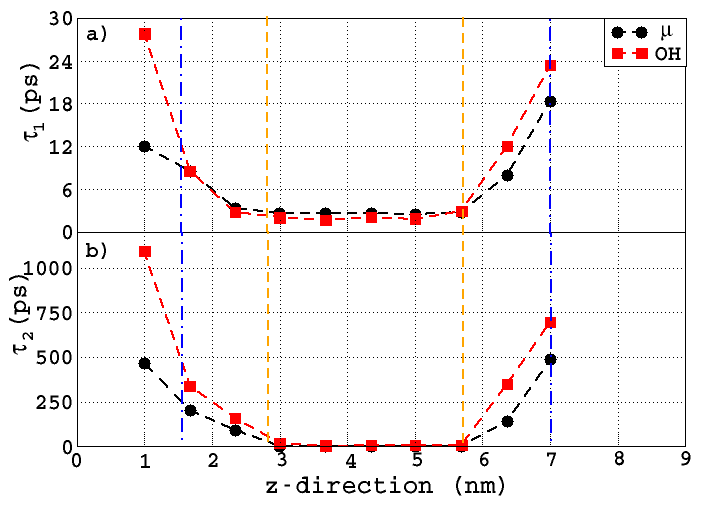
We find that water rotations slow down approaching the membrane. In particular, the distances at which the change is appreciable are the same as for the translations, at nm and nm.
We observe that approaching the lipid membrane both and increase. Interestingly, the relaxation times for increase at a pace higher than the relaxation times for . This observation is consistent with our finding that the P–HO interaction is stronger than the N–O interaction and can be rationalized observing that the lipids carry different (delocalized) charges on the N-heads and on the P-functional groups and that these charges can affect in different way the rotations around the two vectors.
We find that the rotational relaxation times of water penetrating the membrane, at nm, largely increase, as it would be expected for degrees of freedom near to their freezing point. Also in this case the slowing down is stronger near the P-groups than near the N-heads.
The slowing down of the rotational dynamics decreases as water moves from the interface toward the central region, with 2.8 nm 5.8 nm. At these distances we find that all the relaxation times are almost indistinguishable, with , as one would expect in bulk water.
Therefore, the water recovers the bulk dynamic behavior at nm away from the membrane interface, corresponding approximately to four water diameters. However, this result seems to be at variance with our structural analysis, in the previous section, showing that the IRO structure is affected as far as nm away from the interface. We understand this difference as a consequence of the fact that the structural parameter has a higher sensitivity, with respect to the correlation functions, to small effects due to the interface. In particular, since we adopt a definition on the second water hydration shell, the effect is observed on up to three water diameters further than on the correlation times, reaching a total of seven water diameters, consistent with our conclusion of the previous subsection.
IV Conclusions
We employ the sensitive order metric to characterize the structural properties of water confined between phospholipid membranes. Commonly inspected quantities such as, e.g., O-O radial distribution function, molecular displacement and rotational correlation functions, do not capture differences between bulk water and the farthest water layer from the lipid surfaces. Instead, we show that the high sensitivity of is able to detect small, but not negligible, structural differences at the IRO. The lipid membrane, therefore, perturb the structure at the IRO of water as far as nm from the lipid surfaces. It is worthy to note that this value is limited to the finite size of our sample. Therefore, larger simulations could better estimate the extent of such long-range effect.
We find that the IRO of water increases approaching the membrane surfaces and is concurrent with the slow down of the translational and rotational water dynamics. Our observations indicate that water translational and rotational correlation times show a remarkable increase approaching the membrane. The translational times reach values comparable to that of water at supercooled conditions. On the other hand, we show that the membrane acts unevenly on the rotational degrees of freedom, slowing down the rotations related to the vectors more than the rotations related to the water dipole vector. Our calculations reveal that this is due to the stronger interaction between P- groups and water’s hydrogen with respect to the interactions between N- heads and oxygens.
Such effect has physical implications on the structure and local density of water: molecules interacting with P- groups belong to environments slightly more ordered than molecules interacting with N- heads. Moreover, water molecules interacting with P- groups have closer second neighbor than those interacting with N- heads. Although only qualitative, these observations are in agreement with our considerations linking the slowing down of the translational degrees of freedom with the increment of . Further analysis adopting the intrinsic distance from the membrane Calero et al. (2016) and higher statistic will be necessary to make these observations quantitative.
In conclusions, our results suggest that the effect of the phospholipid membrane on the structural properties of water extend as far as nm from the membrane, a larger distance than previously calculated with less sensitive observables. Bulk density and dynamical properties are recovered at a much shorter distance from the membrane, i.e., at nm, showing that the definition of a bulk-like region depends intrinsically on the property we use to compare with bulk. This effect should, therefore, be taken into account when studying properties of water at interfaces. Accordingly to our findings, the order metric is an ideal tool to inspect such structural changes.
Acknowledgements.
C.C.B. and G.F. thank for financial support the Spanish Ministry of Economy and Knowledge (MINECO) and the European Fund for Regional Development (FEDER) with grant FIS2015-66879-C2-2-P and the Barcelona Supercomputing Centre (projects QCM-2014-3-0029 and QCM-2015-3-0023).References
- Hamley (2007) I. W. Hamley, Introduction to Soft Matter (John Wiley and sons, West Sussex, England, 2007).
- Fitter et al. (1999) J. Fitter, R. E. Lechner, and N. A. Dencher, The Journal of Physical Chemistry B 103, 8036 (1999).
- Trapp et al. (2010) M. Trapp, T. Gutberlet, F. Juranyi, T. Unruh, B. Demé, M. Tehei, and J. Peters, The Journal of chemical physics 133, 164505 (2010).
- Wassall (1996) S. R. Wassall, Biophysical Journal 71, 2724 (1996).
- Volkov et al. (2007) V. V. Volkov, D. J. Palmer, and R. Righini, Phys. Rev. Lett. 99, 078302 (2007), URL http://link.aps.org/doi/10.1103/PhysRevLett.99.078302.
- Zhao et al. (2008) W. Zhao, D. E. Moilanen, E. E. Fenn, and M. D. Fayer, Journal of the American Chemical Society 130, 13927 (2008), pMID: 18823116, eprint http://dx.doi.org/10.1021/ja803252y, URL http://dx.doi.org/10.1021/ja803252y.
- Tielrooij et al. (2009) K. J. Tielrooij, D. Paparo, L. Piatkowski, H. J. Bakker, and M. Bonn, Biophysical Journal 97, 2848 (2009).
- Wei Hua (2015) H. C. A. Wei Hua, Dominique Verreault, ChemPhysChem 16, 3910 (2015).
- Róg et al. (2002) T. Róg, K. Murzyn, and M. Pasenkiewicz-Gierula, Chemical physics letters 352, 323 (2002).
- Bhide and Berkowitz (2005) S. Y. Bhide and M. L. Berkowitz, The Journal of chemical physics 123, 224702 (2005).
- Berkowitz et al. (2006) M. L. Berkowitz, D. L. Bostick, and S. Pandit, Chemical reviews 106, 1527 (2006).
- von Hansen et al. (2013) Y. von Hansen, S. Gekle, and R. R. Netz, Physical review letters 111, 118103 (2013).
- Zhang and Berkowitz (2009) Z. Zhang and M. L. Berkowitz, The Journal of Physical Chemistry B 113, 7676 (2009).
- Gruenbaum and Skinner (2011) S. Gruenbaum and J. Skinner, The Journal of chemical physics 135, 075101 (2011).
- Calero et al. (2016) C. Calero, H. E. Stanley, and G. Franzese, Materials 9, 319 (2016).
- Martelli et al. (2016) F. Martelli, H.-Y. Ko, E. C. Oğuz, and R. Car, arXiv:1609.03123 [physics.comp-ph] (2016).
- Marzio et al. (2017) M. D. Marzio, G. Camisasca, M. M. Conde, M. Rovere, and P. Gallo, J. Chem. Phys. 146, 084505 (2017).
- Phillips et al. (2005) J. C. Phillips, R. Braun, W. Wang, J. Gumbart, E. Tajkhorshid, E. Villa, C. Chipot, R. D. Skeel, L. Kalé, and K. Schulten, J. Comput. Chem. 26, 1781 (2005), ISSN 01928651.
- Klauda et al. (2010) J. B. Klauda, R. M. Venable, J. A. Freites, J. W. O’Connor, D. J. Tobias, C. Mondragon-Ramirez, I. Vorobyov, A. D. MacKerell, and R. W. Pastor, J. Phys. Chem. B 114, 7830 (2010), ISSN 15206106.
- Lim et al. (2012) J. B. Lim, B. Rogaski, and J. B. Klauda, J. Phys. Chem. B 116, 203 (2012), ISSN 15206106.
- Jorgensen et al. (1983) W. L. Jorgensen, J. Chandrasekhar, J. D. Madura, R. W. Impey, and M. L. Klein, J. Chem. Phys. 79, 926 (1983), ISSN 00219606, URL http://scitation.aip.org/content/aip/journal/jcp/79/2/10.1063/1.445869.
- A. D. MacKerell et al. (1998) J. A. D. MacKerell, D. Bashford, M. Bellott, J. R. L. Dunbrack, J. D. Evanseck, M. J. Field, S. Fischer, J. Gao, H. Guo, S. Ha, et al., The Journal of Physical Chemistry B 102, 3586 (1998).
- U.Essmann et al. (1995) U.Essmann, L.Perera, M.L.Berkowitz, T.Darden, H.Lee, and L.G.Pedersen, J. Chem. Phys. 103, 8577 (1995).
- H.J.C.Berendsen et al. (1984) H.J.C.Berendsen, J.P.M.Postma, W. Gunsteren, A.DiNola, and J.R.Haak, J.Phys.Chem. 81, 3684 (1984).
- S.E.Feller et al. (1995) S.E.Feller, Y.Zhang, R.W.Pastor, and B.R.Brooks, J.Phys.Chem. 103, 4613 (1995).
- Read and Wilson (2016) R. C. Read and J. R. Wilson, An Atlas of Graphs (Oxford University Press., 2016).