Star Formation Under the Outflow: The Discovery of a Non-Thermal Jet from OMC-2 FIR 3 and its Relationship to the Deeply Embedded FIR 4 Protostar
Abstract
We carried out multiwavelength (0.7-5 cm), multiepoch (1994-2015) Very Large Array (VLA) observations toward the region enclosing the bright far-IR sources FIR 3 (HOPS 370) and FIR 4 (HOPS 108) in OMC-2. We report the detection of 10 radio sources, seven of them identified as young stellar objects. We image a well-collimated radio jet with a thermal free-free core (VLA 11) associated with the Class I intermediate-mass protostar HOPS 370. The jet presents several knots (VLA 12N, 12C, 12S) of non-thermal radio emission (likely synchrotron from shock-accelerated relativistic electrons) at distances of 7,500-12,500 au from the protostar, in a region where other shock tracers have been previously identified. These knots are moving away from the HOPS 370 protostar at 100 km s-1. The Class 0 protostar HOPS 108, which itself is detected as an independent, kinematically decoupled radio source, falls in the path of these non-thermal radio knots. These results favor the previously proposed scenario where the formation of HOPS 108 has been triggered by the impact of the HOPS 370 outflow with a dense clump. However, HOPS 108 presents a large proper motion velocity of 30 km s-1, similar to that of other runaway stars in Orion, whose origin would be puzzling within this scenario. Alternatively, an apparent proper motion could result because of changes in the position of the centroid of the source due to blending with nearby extended emission, variations in the source shape, and/or opacity effects.
1 Introduction
OMC-2 is an active star-forming region (e.g., Peterson & Megeath 2008) in the Orion A molecular cloud, located at a distance of 414 7 pc (Menten et al., 2007; Kim et al., 2008; Kounkel et al., 2017). Mezger et al. (1990) identified six bright mm/IR sources (FIR 1-6) within a region of about in size that have been associated with young stellar objects (YSOs) through subsequent studies (Adams et al. 2012, Furlan et al. 2014, 2016 and references therein). The region has been imaged at mm and submm wavelengths by Chini et al. (1997) and Lis et al. (1998), and in the near- and mid-IR by Tsujimoto et al. (2003), Nielbock et al. (2003), and Megeath et al. (2012). At mm and submm wavelengths the brightest source is FIR 4, which has been associated with the HOPS 108 Class 0 protostar (Adams et al. 2012, Furlan et al. 2016)111In low resolution observations FIR 4 probably includes emission from other nearby objects.. This source is connected through a filamentary cloud structure to the bright source FIR 3, also known as HOPS 370, an intermediate-mass Class I YSO with an (Adams et al. 2012, Furlan et al. 2016) located about to the NE (see Fig. 1 for the positions and nomenclature of the sources). The region was observed with the Very Large Array (VLA) at 3.6 cm in the D configuration (angular resolution ) by Reipurth et al. (1999). These authors found a weak elongated source (VLA 12) toward FIR 4 (HOPS 108) that was interpreted as a radio jet originating from this protostar. A stronger, but unresolved source (VLA 11), was detected toward FIR 3 (HOPS 370).
The nature of the source FIR 4 is still uncertain. Shimajiri et al. (2008) through mm and submm observations proposed that FIR 4 was composed of 11 dusty cores. These authors detected molecular line emission from shock tracers (SiO and CH3OH) in the proximity of FIR 4 and proposed that the interaction of a powerful molecular outflow driven by FIR 3 (e.g., Williams et al. 2003, Takahashi et al. 2008) with a dense clump could be triggering the formation of a next generation of stars at the position of FIR 4. On the other hand, López-Sepulcre et al. (2013) based on 2 mm observations proposed that FIR 4 was composed of at least three cores, and suggested that its associated 3.6 cm source VLA 12 traces an HII region photoionized by an early-type (B3-B4) star with a luminosity of 700-1000 embedded within one of these cores. A bolometric luminosity for FIR 4 was obtained by Crimier et al. (2009) but this estimate, based on low angular resolution IRAS data, is very uncertain because of the difficulties in separating the emission of the protostar from that of the surrounding molecular cloud and other neighboring objects.
In a rigorous analysis of the available photometry of HOPS 108, including Herschel measurements that constrain better the peak of the Spectral Energy Distribution (SED) than the IRAS fluxes, Furlan et al. (2014) give . This is much lower than the earlier estimate by Crimier et al. (2009) or the value adopted by López-Sepulcre et al. (2013). Due to uncertainties in the amount of external heating and the inclination of the protostar, Furlan et al. (2014) find that they can fit the SED with models having values for the intrinsic total luminosity222The intrinsic total luminosity of a source and its bolometric luminosity derived from the observed flux densities can differ in case of an inhomogeneous surrounding medium (e.g., if outflow cavities are present) resulting in an anisotropic radiation field where the observed flux density depends on inclination angle (see Furlan et al. 2016). ranging from 15 to 540 , although models with luminosities are favored.
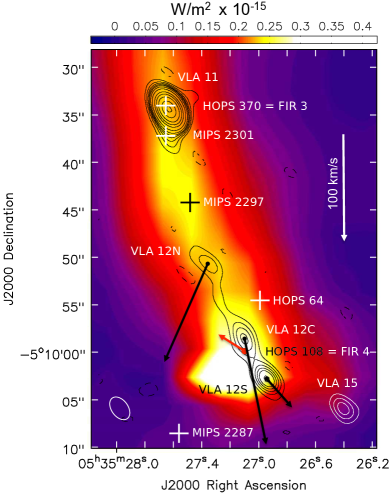
Manoj et al. (2013) detected far-IR CO lines indicative of shock-heated gas at high temperatures ( K) toward both HOPS 108 and HOPS 370. Recently, González-García et al. (2016) imaged in far-IR [OI] lines and in the submm CO(6-5) line, a powerful ( yr-1, as estimated by these authors) bipolar jet/outflow originating from HOPS 370. The outflow extends to the NE of HOPS 370 (FIR 3) in the direction where a 4.5 m Spitzer/IRAC image (which traces shock-excited H2 emission) shows an extended jet that terminates in a bow shock (Megeath et al., 2012). To the SW, the outflow terminates near the location of HOPS 108, with a bright [OI] emission peak that González-García et al. (2016) argue originates in the terminal shock produced by the jet.
In summary, Shimajiri et al. (2008), López-Sepulcre et al. (2013), and González-García et al. (2016) suggest that the protostar HOPS 108 results from the interaction of an outflow driven by HOPS 370 with a dense clump. Within this scenario, López-Sepulcre et al. (2013) assume that a star cluster is being formed, with the radio source VLA 12 tracing an HII region associated with the most massive star; for this star they adopt a luminosity of 1000 , similar to earlier estimates of Crimier et al. (2009). On the other hand, Furlan et al. (2014), Reipurth et al. (1999), and Adams et al. (2012) interpret VLA 12 as a radio jet driven by a modest luminosity protostar associated with HOPS 108.
In this paper we analyze new and archive VLA observations that shed new light on the origin of the HOPS 108 protostar, the nature of its radio emission, and its relationship with other nearby sources.
2 Observations
The observations were carried out with the Karl G. Jansky VLA of the National Radio Astronomy Observatory (NRAO)333NRAO is a facility of the National Science Foundation operated under cooperative agreement by Associated Universities, Inc. in the C configuration in 2014 (Project 14B-296) at C (5 cm), X (3 cm), K (1.3 cm) and Q (0.7 cm) bands, and in the A configuration in 2015 (Project 15A-369) at C-band (5 cm). In both cases, the phase center was close to the position of HOPS 108. Further details of the observational setup are given in Table 1. The data were edited and calibrated using the Common Astronomy Software Applications (CASA; version 4.2.2) package.
We also analyzed several epochs of VLA archive data at X-band (3.6 cm) obtained with different configurations between 1994 and 2000 (see Table 1 for details). These data were edited and calibrated using the Astronomical Image Processing System (AIPS), and then were concatenated using the CASA package.
All the images were made with the CASA task CLEAN using multi-frequency synthesis (Conway et al., 1990) and fitting the frequency dependence of the emission with a Taylor series expansion with nterms = 2 during the deconvolution. There is extended emission of the bright HII region M43 (NGC 1982) to the south of HOPS 108 that makes it difficult the imaging of the archive (X-band) data and the new data at C-band. In order to do a proper cleaning of our target sources we downweighted the extended emission by removing the shortest baselines. For the archive and the 2014 C-band data we used only baselines 5 k and the multiscale deconvolution algorithm to make the images. For the 2015 A-configuration data, which are more sensitive, we used only baselines 25 k.
3 Results and Discussion
In our new data of epochs 2014 and 2015 we detect the radio sources VLA 11, VLA 12, and VLA 13 previously reported at 3.6 cm by Reipurth et al. (1999), but our observations cover additional bands and are more sensitive, revealing further details. The FWHM of our primary beam, centered near VLA 12, ranges from at Q-band to at C-band. Therefore, we detected additional sources, including several of the IR sources in the field. In this paper we will discuss only the sources detected in the proximity (within ) of HOPS 108. Positions of these sources are given in Table Star Formation Under the Outflow: The Discovery of a Non-Thermal Jet from OMC-2 FIR 3 and its Relationship to the Deeply Embedded FIR 4 Protostar. The remaining detected sources will be discussed in a forthcoming paper (A. K. Díaz-Rodríguez et al. 2017, in preparation).
3.1 Identification of the Detected Sources
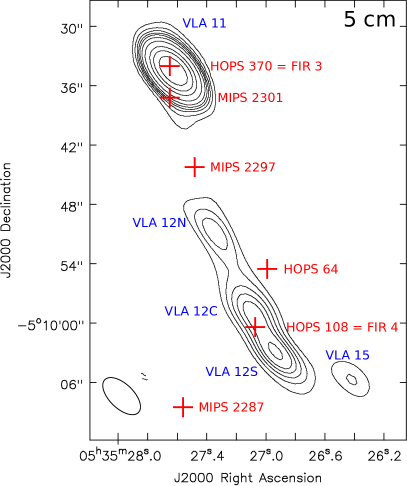
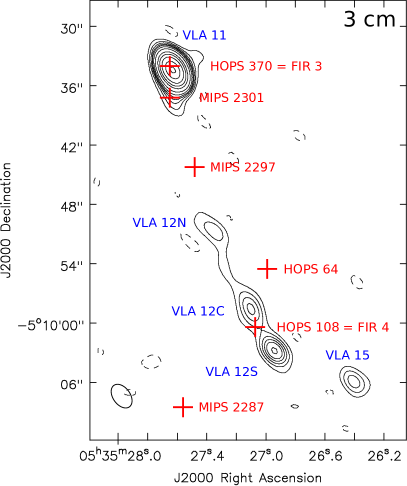
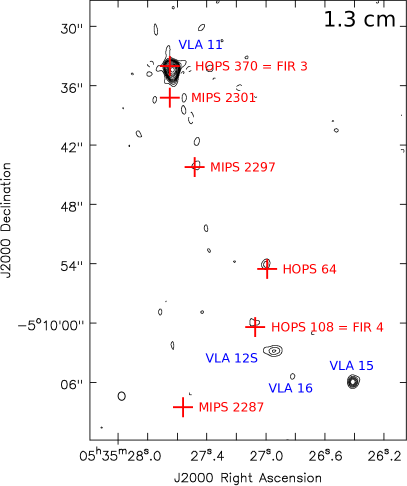
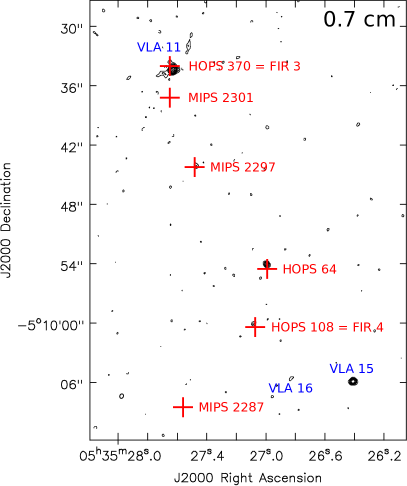
In Figure 1 we show the maps of VLA 11 and VLA 12 at different wavelengths obtained in our 2014 VLA C-configuration observations. VLA 12 (in the proximity of FIR 4/HOPS 108) is clearly detected as a very elongated source at 5 and 3 cm, showing three knots that we call VLA 12N, VLA 12C, and VLA 12S, for the northern, central and southern observed emission peaks, respectively. At first glance, these results appear to confirm VLA 12 as a radio jet, as was first suggested by Reipurth et al. (1999). These knots coincide with the southern, brightest part of the jet/outflow traced by the far-IR [OI] and submm CO(6-5) lines, which is assumed to originate in HOPS 370 (González-García et al. 2016; see Fig. 2, left). The IR position of the HOPS 108 protostar (Megeath et al. 2012) falls close to (within ) the position of knot VLA 12C, apparently favoring HOPS 108 as the driving source of the proposed VLA 12 radio jet.
At shorter wavelengths (1.3 and 0.7 cm; bottom panels in Fig. 1) the emission of the VLA 12 knots decreases making them undetectable, indicating that they have a negative spectral index (where ), characteristic of non-thermal emission. This is confirmed by the analysis of the spectra obtained from our full dataset (Table 3, Fig. 3). Despite the possible time variability both in flux density (that can be more prominent in non-thermal emission) and morphology, as well as the difficulties inherent in the measure of extended emission from data taken with different angular resolutions, the obtained spectral indices in the centimeter range are negative for the three knots of VLA 12, with values of 1.1, 1.3, and 0.6. The behavior is clear even if only the C-configuration data from October 2014, which were taken almost simultaneously, are considered. Also, we have checked in these data that the negative spectral indices obtained are not spurious results of differences in the uv coverage and/or angular resolution, that could make data at shorter wavelengths less sensitive to extended emission. To do that, we obtained pairs of images of contiguous bands using only baselines in the same uvrange. Using these pairs of maps we confirmed that the flux density truly decreases at shorter wavelengths, resulting in negative spectral indices for the VLA 12 knots. These negative spectral indices cannot be explained by thermal emission (see Rodríguez et al. 1993) and should be attributed to non-thermal emission, probably arising from relativistic electrons accelerated in strong shocks (Carrasco-González et al. 2010; see below). This rules out the HII region scenario proposed by López-Sepulcre et al. (2013) for VLA 12.
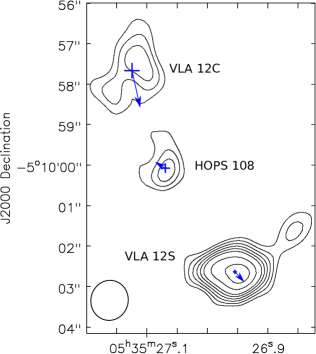
Although the position of the knot VLA 12C at 6 and 3 cm appears somewhat () displaced to the NE of the position of HOPS 108 (as obtained from 24 and 8 µm data; Megeath et al. 2012), at 1.3 and 0.7 cm the radio emission appears to be closer to the HOPS 108 IR position (see Fig. 1). This shift in the position could indicate either an opacity gradient or that the radio emission observed at shorter wavelengths originates in a different object than the emission observed at longer wavelengths. This last suggestion is confirmed by our data of subarcsecond angular resolution at long wavelengths (Fig. 4) that reveal two radio sources spatially separated by . We identify the northeasternmost of these two radio sources with the VLA 12C knot and the other source, whose position coincides with the IR source, with the radio counterpart of the HOPS 108 protostar. Recent ALMA observations with an angular resolution of 012 (J. Tobin et al. 2017b, in preparation) reveal a compact source at 870 m whose position coincides within 01 with the cm position (Table 3) confirming the nature of HOPS 108 as a protostar and its association with the cm radio source. Furthermore, the spectral index of HOPS 108 obtained from the cm data that separate its emission from that of VLA 12C shows that HOPS 108 has a positive spectral index (; Table 3 and Fig. 3) and, thus it is associated with thermal (free-free) emission, in contrast to the knots of VLA 12, whose emission is non-thermal. From the empirical correlation between cm flux density and bolometric luminosity for protostellar objects, (Anglada et al., 2015), and using our measured flux density at 3 cm (Table 3), we estimate a bolometric luminosity for HOPS 108. This value of the bolometric luminosity is close to the lowest end of the range considered by Furlan et al. (2016) in the modeling of this object, being much smaller than early estimates (; Crimier et al. 2009; López-Sepulcre et al. 2013) that were based on very low angular resolution data, and significantly smaller than the value obtained if the contribution of the VLA 12 knots is not removed (; Furlan et al. 2014). Thus, separating the emission of HOPS 108 from that of the VLA 12 knots confirms HOPS 108 as a low-luminosity object.
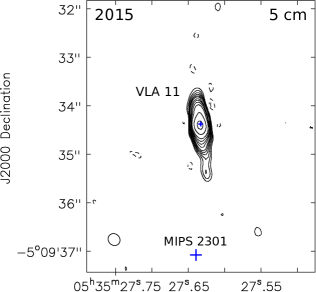
The radio source VLA 11, that was associated with FIR 3 (HOPS 370) and reported as unresolved by Reipurth et al. (1999), is clearly resolved as a very elongated bipolar radio jet along a PA in our A-configuration data at 5 cm (Fig. 4). The radio source is also resolved in the 3.6 cm image obtained by combining archive data from 1994-2000. The spectral index is (Table 3, Fig. 3), which is a reasonable value for a thermal free-free radio jet (Anglada, 1996). HOPS 370 is known to be associated with an outflow extending along a PA similar to that of the radio jet (González-García et al. 2016; see Fig. 2, left). The morphology of VLA 11 appears to change in the 0.7 cm image (Fig. 1), that shows weak extended emission in a direction perpendicular to the jet, suggesting a noticeable dust contribution at this wavelength. To prevent dust contamination, the 0.7 cm datapoint has been excluded in the fits to determine the spectral index of this and the remaining thermal sources.
In the lower resolution images at 6 and 3 cm (Fig. 1), VLA 11 appears blended with the radio emission of MIPS 2301 (Megeath et al. 2012, an IR source also known as MIR 22, Nielbock et al. 2003) located south of VLA 11. MIPS 2301 is well separated, but only marginally detected, in the higher resolution 3.6 cm image shown in Figure 4 and in the A-configuration images at 5 cm obtained with the robust weighting parameter set to values 1 (not shown in Fig. 4)444Note that MIPS 2301 is not aligned along the VLA 11 jet axis (PA = ). Thus, its radio emission can be distinguished from the knots of the radio jet in the high angular resolution images.. With the data currently available we obtain a positive spectral index, (Table 3, Fig. 3), consistent with thermal free-free emission from a YSO. More sensitive observations are required for a better characterization of the nature of the radio emission of this object.
The source MIPS 2297 (Megeath et al. 2012, also known as MIR 23, Nielbock et al. 2003) is marginally detected at 1.3 cm and 0.7 cm (Fig. 1), but clearly detected in the 0.9 cm observations of J. Tobin et al. (2017a, in preparation). It shows a positive spectral index () in the cm regime (Table 3 and Fig. 3), confirming its nature as a YSO. So far, MIPS 2297 has not been studied in great detail, but it is classified as a young star with disk (Class II) by Megeath et al. (2012).
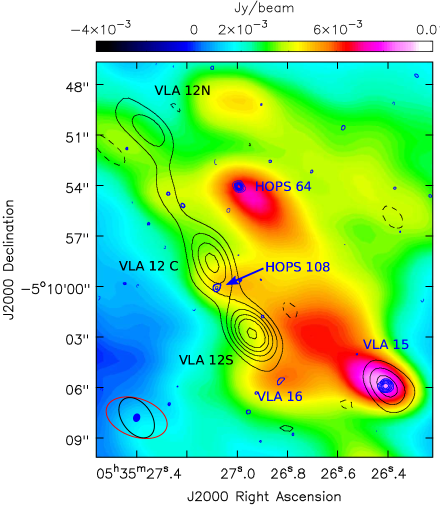
We also detect HOPS 64 (Fig. 1), a Class I object (Furlan et al., 2016) that in the cm range presents a positive spectral index of (Table 3, Fig. 3), suggesting optically-thick free-free emission from a YSO. The position of the radio source falls in between the FIR 4d and FIR 4e cores imaged by Shimajiri et al. (2008), and is close to, but slightly displaced from, one of the main emission peaks of the dust cloud imaged by ALMA at 3 mm (Kainulainen et al. 2017; see Fig. 2, right). Nevertheless, the position of the radio source coincides accurately (within 01) with that of a compact 870 m source recently detected with ALMA (J. Tobin et al. 2017b, in preparation).
A few arcsec to the SW of the knot VLA 12S we detect a weak source. The source has not been reported previously at other wavelengths and we call it VLA 16. The detection is marginal in the individual bands ( 5 at most) but we consider that the source is real because it appears in four of the five observed bands (see Table 3). The spectral index is 0.7 (Fig. 3), consistent with that of a YSO/jet. The position of the radio source falls near a secondary emission peak in the 3 mm ALMA image (Kainulainen et al., 2017) shown in Figure 2 and coincides very well (within 01) with the position of a weak 870 m source recently detected with ALMA observations of higher angular resolution (J. Tobin et al. 2017b, in preparation). From the empirical correlation between cm emission and bolometric luminosity (Anglada et al., 2015) we infer . All these results confirm the reality of the source VLA 16 and its nature as an embedded low-luminosity YSO.
Finally, we report the detection in all the observed bands of a compact source, located SW of VLA 12S, and that we call VLA 15 (Tables Star Formation Under the Outflow: The Discovery of a Non-Thermal Jet from OMC-2 FIR 3 and its Relationship to the Deeply Embedded FIR 4 Protostar, 3, Figs. 1, 3, 4). The position of the source coincides with the FIR 4j core imaged by Shimajiri et al. (2008) and falls close to (but slightly offset from) one of the main emission peaks of the dust cloud imaged at 3 mm by ALMA (Kainulainen et al. 2017; see Fig. 2, right). No counterparts at other wavelengths had been reported so far, but the source has been recently imaged at 870 m with ALMA (J. Tobin et al. 2017b, in preparation). The radio source has a positive spectral index () and we suggest that it traces a very young embedded stellar object associated with the OMC-2 star-forming region that deserves further study at other wavelengths.
3.2 Proper Motions of the Detected Sources
We searched for proper motions by comparing the positions of the radio sources detected in the high-angular resolution maps obtained from archive data (epochs 1994-2000) and from our last observations (epoch 2015). Unfortunately, the sensitivity of the archive data in a single epoch was insufficient, and we combined in the same map data taken over 6 years, which is not optimal to measure accurate proper motions, because of motions and changes in morphology of the sources over this period. Also, the archive data were observed in X-band (8.4-8.5 GHz) while the new data have been obtained in C-band (4-8 GHz) (Table 1). Although the frequency ranges of the two bands are almost contiguous, the differences in frequency could result in apparent motions due to variations of opacity with frequency, particularly in extended sources. Despite all these factors that contribute to the uncertainty in our measurements, the relatively high velocity of the jet and long time ( yr) elapsed between the two maps, make the proper motions clearly detectable. Our results show that, while VLA 11, and VLA 15 remain static within the uncertainties, the VLA 12N, VLA 12C and VLA 12S knots present measurable proper motions of 40-100 km s-1 roughly in the S-SW direction (Table 3 and Fig. 4; see also left panel in Fig. 2). HOPS 108 shows a measurable proper motion ( km s-1), but in the NE direction, whose nature is uncertain (see below). The proper motion velocity of VLA 11, the source with the best signal-to-noise ratio, is km s-1 (Table 3). Since this velocity is obtained from the absolute positions of the source, its small value indicates that systematic errors are effectively very small and that their possible residual effects on the proper motions determination are at a level of 2 km s-1 or smaller.
3.2.1 The HOPS 370 Radio Jet
As discussed above, the knots of VLA 12 are characterized by negative spectral indices, indicating non-thermal emission (see Fig. 3), but their overall morphology with three aligned knots, suggests that they pertain to a radio jet. Radio jets associated with YSOs are characterized by thermal (free-free) emission (e.g., Anglada 1996), but in a few cases, non-thermal emission has been found in the jet lobes, at relatively large distances from the jet core that shows a positive spectral index and thermal emission (Carrasco-González et al. 2013, Anglada et al. 2015, Rodríguez-Kamenetzky et al. 2016 and references therein). The most spectacular case of this selected sample of non-thermal radio jets is the HH 80 radio jet, where linearly polarized emission, indicative of synchrotron radiation, was imaged in the jet lobes (Carrasco-González et al., 2010), while the central core of the jet, with a positive (thermal) spectral index, remains unpolarized. As the velocities of protostellar jets are not relativistic ( km s-1), it is assumed that the synchrotron emitting electrons are accelerated up to relativistic velocities via the diffusive shock acceleration (DSA) mechanism (Drury, 1991) working in the strong shocks present in the interaction of the jet with the surrounding medium. Thus, it is expected that the VLA 12 knots are associated with strong shocks, as indeed is suggested by the detection of several shock tracers in the proximity of this source (Shimajiri et al. 2008, Manoj et al. 2013, González-García et al. 2016; see Fig. 2, left panel). Actually, the region near HOPS 108 shows the brightest far-IR [OI], CO, H2O and OH line emission among the HOPS spectroscopic sample of sources (P. Manoj et al. 2017, in preparation), indicating the presence of strong shocks.
These results are consistent with the VLA 12 knots being part of a non-thermal radio jet either originating from the Class 0 protostar HOPS 108 (FIR 4), which falls in between the VLA 12C and the VLA 12S knots, or from the intermediate-mass Class I YSO HOPS 370 (FIR 3), as the VLA 12 knots are roughly aligned in the direction of the VLA 11 radio jet associated with HOPS 370 (Fig. 1) and fall on the SW lobe of the submm and far-IR outflow (Manoj et al. 2013, González-García et al. 2016) driven by this object.
If HOPS 108 was the driving source of the VLA 12 knots, one would expect proper motions of these knots away from HOPS 108. In particular, the VLA 12N and 12C knots would show proper motions with a component pointing to the north. However, as Figure 4 shows, the proper motions of the VLA 12 knots point to the south, consistent with an origin from HOPS 370 (VLA 11), and excluding HOPS 108 as the driving source. Thus, we conclude that the VLA 12 non-thermal radio knots belong to a radio jet, driven by the intermediate-mass Class I object HOPS 370, whose central thermal region is traced by the collimated radio source VLA 11. VLA 11 is bipolar, extending both to the NE and to the SW of the position of the protostar (see top-right panel in Fig. 4). However, only the SW side of the radio jet shows a distant () non-thermal lobe (VLA 12), without a NE counterpart. The absence of a NE non-thermal radio lobe is probably due the lack of a dense clump along the NE jet path where a strong shock interaction, similar to that observed in the SW lobe, could take place. The jet is also bipolar in the far-IR [OI] lines (González-García et al., 2016), but its SW lobe is more extended, with the brightest part associated with the non-thermal VLA 12 radio lobe.
Adopting 1997.65 as an average epoch for the archive data map, the resulting plane-of-the-sky velocities of the VLA 12N, 12C, and 12S knots are 100, 101, and 37 km s-1, respectively. The velocities of knots 12N and 12C fall in the range of values measured for other protostellar radio jets (Anglada et al. 2015 and references therein); the velocity of VLA 12S is smaller, suggesting that this distant knot could have suffered a significant deceleration, particularly if the jet has interacted strongly with the ambient medium, as indicated by other observations (Manoj et al. 2013, González-García et al. 2016). In this respect, recent proper motion measurements of the radio knots associated with the Herbig-Haro objects HH 80, HH 81, and HH 80N, far away from the central source, have shown that these knots have significantly slower motions than the radio knots located a few arcsec from the central source (Masqué et al., 2015). This result has been interpreted as indicating strong jet interactions with the ambient cloud that significantly slow down the jet material.
3.2.2 The Origin of HOPS 108
Since the position of the HOPS 108 protostar falls in the path of the VLA 11-VLA 12 radio jet, but it can be ruled out as its driving source, an appealing alternative possibility is that the jet is related to the origin of HOPS 108. It has been proposed that shocks associated with the interaction of jets with the surrounding medium could compress the gas and induce local instabilities that may trigger star-formation (e.g., Yokogawa et al., 2003; Graves et al., 2010; Duarte-Cabral et al., 2011). In particular, this scenario has been proposed for HOPS 108, as it is associated with strong shocks (Manoj et al. 2013, González-García et al. 2016) and probably interacting with a nearby dense core (Shimajiri et al., 2008). Interestingly, the shape of the jet in the region of the VLA 12 knots appears to follow the eastern edge of a clump of enhanced dust emission, as imaged by ALMA at 3 mm (Kainulainen et al. 2017; see Fig. 2, right panel). Thus, it seems plausible that the formation of the HOPS 108 protostar was triggered by the compression of the material in this clump after a strong shock interaction with the VLA 11-VLA 12 jet, driven by HOPS 370.
The evolutionary status of HOPS 370 and HOPS 108 are also fully consistent with the suggestion of the latter being triggered by the former. HOPS 370, with a bolometric temperature K, has been classified as an intermediate-mass young Class I object (Adams et al. 2012, Furlan et al. 2016) and we would expect an age (time elapsed since the onset of collapse) of a few times years for this object. HOPS 108, with a lower bolometric temperature K, is supposed to be younger, and it has been classified as a Class 0 protostar (Adams et al., 2012; Furlan et al., 2016). We can then hypothesize that some years ago the jet of HOPS 370 started to impact the molecular clump (see Fig. 2, right panel) from which HOPS 108 later formed. After an interaction of a few times years, enough time had passed to allow the collapse of the clump and the start of the protostellar stage of HOPS 108. The travel time of the gas from HOPS 370 to HOPS 108 is only 500 years (as derived from our measured proper motions) and the delay in the influence of the first object on the second can be taken to be much shorter than the other timescales. We then have a scenario in which the evolutionary status of the sources is consistent with one of them triggering the formation of the other.
It should be noted that the MIPS 2297 source also falls on the path of the HOPS 370 jet, but closer to the origin. Since MIPS 2297 seems to be older than HOPS 108 one could think that it is the result of an earlier episode of triggered star-formation. If MIPS 2297 is really a Class II object, as proposed by Megeath et al. (2012), it would be even older than HOPS 370, making the possibility of triggered formation inviable. However, MIPS 2297 is not well studied yet, and if it happens to be younger this possibility cannot be fully discarded. On the other hand, Shimajiri et al. (2008) proposed that the formation of HOPS 64 ( NW from HOPS 108) could have also been triggered by the outflow from HOPS 370. However, in the recent study by Furlan et al. (2016), both HOPS 370 and HOPS 64 are classified as Class I sources, suggesting a similar evolutionary stage, which would be in conflict with a triggered star-formation scenario for HOPS 64. It is also possible that MIPS 2297 and/or HOPS 64, which are both visible at shorter wavelengths, lie in front of the plane where HOPS 370 and HOPS 108 are located; so, they could be close to HOPS 370 and its jet just in projection, but in reality be farther away and have formed in OMC-2 independently of this source. The new source VLA 16 also falls in the path of the jet, very close to the southernmost detected knot, VLA 12S. We can also not exclude the possibility that star-formation has been triggered, or will eventually be triggered, in other dust cores reported by Shimajiri et al. (2008) which currently do not show evidence of embedded YSOs. Thus, there are at least four young stars which could be the result of triggering or affected by the HOPS 370 jet, but only for HOPS 108 there is further evidence of ongoing shock-interaction.
A puzzling issue in the triggered-formation scenario for HOPS 108 is its large proper motion velocity ( 32 km s-1; Table 3). Such a large velocity implies that it should have been acquired very recently ( 200 yr) in order the star to be formed in the proximity (within a few arcsec) of its current position, in the region where the shock emission has been identified (Manoj et al., 2013; González-García et al., 2016). Otherwise, if this velocity was maintained during a longer time interval, it would imply that the HOPS 108 protostar originated at a distant position from its current location, making inviable the triggering hypothesis. Relatively low velocities are expected if the protostars are mechanically linked to the molecular gas reservoir and thus obtain their velocities directly from the gas they are forming in, as proposed by Stutz & Gould (2016), who found typical radial velocities with respect to the ambient cloud of 0.6 km s-1 for protostars and 1.8 km s-1 for pre-main-sequence stars in the integral-shaped filament (ISF) region in Orion. These authors propose a slingshot-like ejection mechanism to account for the increase in velocity of pre-main-sequence stars relative to protostars. However, this mechanism cannot explain velocities above a few km s-1.
In contrast, HOPS 108 presents a much larger proper motion velocity, similar to the 27 km s-1 of the BN object in the nearby Orion BN/KL stellar system (Goddi et al., 2011; Rodríguez et al., 2017). Another runaway star, V 1326 Ori, with a peculiar large proper motion velocity of about 28 km s-1 has been recently identified in a radio survey of proper motions in the core of the Orion Nebula Cluster (Dzib et al. 2017). For the BN/KL system, in order to explain both the uncollimated explosive molecular outflow (Zapata et al. 2009) and the stellar velocities, violent (proto-)stellar interactions and the subsequent dynamical ejection of said (proto-)stars have been invoked (Bally & Zinnecker, 2005; Gómez et al., 2008; Bally et al., 2017). This acceleration mechanism would require the presence of a binary or multiple stellar system near FIR 4/HOPS 108 to make it compatible with the triggering scenario. Shimajiri et al. (2008) imaged 11 potential cores within a region of in the proximity of FIR 4 and interpreted them as tracing a young stellar cluster whose formation was triggered by the impact of the jet with the ambient cloud. If this was the case, interactions within this multiple system could have resulted in the recent ejection of HOPS 108. We identify the region imaged by Shimajiri et al. (2008) with the clump of dust imaged by ALMA at 3 mm (Kainulainen et al. 2017; Fig. 2, right panel), where the sources HOPS 108, HOPS 64, VLA 15 and VLA 16 appear to be embedded. Since HOPS 108 moves toward the NE, we do not find a suitable candidate that might be receding from a close enough common position and that could be responsible for a past interaction with HOPS 108, casting doubt on this possibility.
There are other detected radio sources in the region whose proper motions are compatible with being receding from a common location with HOPS 108 (e.g., VLA 13, located to the SW; A. K. Díaz-Rodríguez et al. 2017, in preparation), and that could have dynamically interacted with it in the past. However, the location of a potential encounter would fall at a large distance from the current position of HOPS 108 and, as noted above, would make the origin of this object incompatible with a scenario of (local) triggered star-formation. On the other hand, if HOPS 108 was accelerated in a distant encounter it seems unlikely that our observation occurs just at the moment when it crosses the VLA 12 knots of the HOPS 370 jet, at the point of its maximum interaction with the ambient cloud.
Another possibility to explain the observed large proper motion of HOPS 108 is to assume that it is due to a change in the shape of its radio emission because of blending with the emission of the nearby VLA 12 knots. Since these knots move toward the SW, with VLA 12C approaching HOPS 108 and VLA 12S going away, a partial blending with these knots can result in an apparent motion of HOPS 108 toward the NE. Also, a one-sided ejecta of a high velocity cloud of ionized plasma by the protostar could produce a change in the shape of its radio emission and an apparent proper motion. One-sided high velocity ejecta from young stars have been observed in several other sources (e.g., Rodríguez et al. 2017 and references therein). Such an ejecta with a velocity of the order of hundreds of km s-1 in a poorly resolved source would result in a one-sided distortion in the source shape and thus a change in the centroid position that could mimic a motion of several tens of km s-1. Wavelength-dependent opacity effects in an extended source could emphasize these changes in the position of the centroid of the emission. Indeed, we found that the precise position of the HOPS 108 radio source changes with wavelength. Additional, sensitive high angular resolution observations could provide a more precise measure of the HOPS 108 proper motions and reveal the possible presence of either a high velocity ejecta from this source or a nearby binary/multiple system whose past interaction with HOPS 108 had been responsible for its current high proper motions.
4 Conclusions
We analyzed new (2014-2015) multiwavelength (0.7-5 cm), multiconfiguration VLA observations together with archive (1994-2000) data at 3.6 cm that allowed us to obtain spectral indices and proper motions of radio sources in the region enclosing FIR 3 (HOPS 370) and FIR 4 (HOPS 108) in OMC-2. Our main conclusions can be summarized as follows:
-
1.
We detect radio emission from the far-IR sources HOPS 370, HOPS 108, and HOPS 64, as well as from the mid-IR sources MIPS 2297 and MIPS 2301. We also detect two new sources, both associated with dust cores, that we call VLA 15 and VLA 16. For all these sources we obtain positive spectral indices in the centimeter wavelength range, consistent with thermal free-free emission from young stellar objects.
-
2.
The radio source VLA 11, associated with HOPS 370, presents a clearly elongated bipolar morphology in the NE-SW direction. Because of this morphology and positive spectral index ( 0.3) we interpret VLA 11 as the thermal region closest to the origin of a well collimated bipolar radio jet driven by the HOPS 370 intermediate-mass protostar. We detect several knots of emission (VLA 12N, 12C, and 12S) at 7,500-12,500 au to the SW of HOPS 370 with negative spectral indices and showing proper motions of 40-100 km s-1 away from the HOPS 370 protostar. We interpret these knots as a non-thermal lobe of the HOPS 370 jet. The VLA 12 knots are found in a region where previous observations have detected several tracers of strong shocks, suggesting that their non-thermal emission is likely synchrotron emission from relativistic electrons accelerated in shocks, as has been proposed for other non-thermal jet lobes. Although VLA 11 is bipolar, a similar non-thermal radio lobe is not found to the NE of HOPS 370, probably because there is not a dense clump where the jet interaction could take place.
-
3.
HOPS 108 is identified as a compact radio source independent and kinematically separated from the radio emission of VLA 12 knots of the HOPS 370 jet. Its position along the path of the VLA 12 knots, and coincidence with different shock tracers, suggest a scenario where the formation of HOPS 108 has been triggered by the interaction of the HOPS 370 jet with the surrounding medium, as was already proposed by Shimajiri et al. (2008). The more advanced evolutionary stage of HOPS 370 relative to HOPS 108 and the short dynamical timescale of the jet, are consistent with this scenario. However, HOPS 108 presents a large proper motion velocity of about 30 km s-1 toward the NE whose nature is uncertain. This velocity is similar to the proper motion velocities found in runaway stellar sources in Orion (Rodríguez et al., 2017; Dzib et al., 2017). Such a large velocity in HOPS 108 would be inconsistent with the triggered scenario, unless the source had been accelerated to this high velocity very recently. Alternatively, an apparent proper motion could result because of a change in the position of the centroid of the source due to a partial blending with the emission of the nearby VLA 12 knots or to a one-sided ejecta of ionized plasma, rather than by the actual motion of the protostar itself. Deep high angular resolution observations at several epochs are required to clarify this issue.
-
4.
HOPS 370 and VLA 15 do not show detectable proper motions ( 2-4 km s-1), as expected for embedded protostars.
References
- Adams et al. (2012) Adams, J. D., Herter, T. L., Osorio, M., et al. 2012, ApJ, 749, L24
- Anglada (1996) Anglada, G. 1996, Radio Emission from the Stars and the Sun, 93, 3
- Anglada et al. (2015) Anglada, G., Rodríguez, L. F., & Carrasco-Gonzalez, C. 2015, Advancing Astrophysics with the Square Kilometre Array (AASKA14), 121
- Bally et al. (2017) Bally, J., Ginsburg, A., Arce, H., et al. 2017, ApJ, 837, 60
- Bally & Zinnecker (2005) Bally, J., & Zinnecker, H. 2005, AJ, 129, 2281
- Briggs (1995) Briggs, D. S. 1995, Bulletin of the American Astronomical Society, 27, 112.02
- Carrasco-González et al. (2010) Carrasco-González, C., Rodríguez, L. F., Anglada, G., et al. 2010, Science, 330, 1209
- Carrasco-González et al. (2013) Carrasco-González, C., Rodríguez, L. F., Anglada, G., et al. 2013, European Physical Journal Web of Conferences, 61, 03003
- Conway et al. (1990) Conway, J. E., Cornwell, T. J., & Wilkinson, P. N. 1990, MNRAS, 246, 490
- Crimier et al. (2009) Crimier, N., Ceccarelli, C., Lefloch, B., & Faure, A. 2009, A&A, 506, 1229
- Dzib et al. (2017) Dzib, S. A., Loinard, L., Rodríguez, L. F., et al. 2017, ApJ, 834, 139
- Drury (1991) Drury, L. O. 1991, MNRAS, 251, 340
- Duarte-Cabral et al. (2011) Duarte-Cabral, A., Dobbs, C. L., Peretto, N., & Fuller, G. A. 2011, A&A, 528, A50
- Furlan et al. (2014) Furlan, E., Megeath, S. T., Osorio, M., et al. 2014, ApJ, 786, 26
- Furlan et al. (2016) Furlan, E., Fischer, W. J., Ali, B., et al. 2016, ApJS, 224, 5
- Goddi et al. (2011) Goddi, C., Humphreys, E. M. L., Greenhill, L. J., Chandler, C. J., & Matthews, L. D. 2011, ApJ, 728, 15
- Gómez et al. (2008) Gómez, L., Rodríguez, L. F., Loinard, L., et al. 2008, ApJ, 685, 333-343
- González-García et al. (2016) González-García, B., Manoj, P., Watson, D. M., et al. 2016, A&A, 596, A26
- Graves et al. (2010) Graves, S. F., Richer, J. S., Buckle, J. V., et al. 2010, MNRAS, 409, 1412
- Chini et al. (1997) Chini, R., Reipurth, B., Ward-Thompson, D., et al. 1997, ApJ, 474, L135
- Kainulainen et al. (2017) Kainulainen, J., Stutz, A. M., Stanke, T., et al. 2017, A&A, in press, arXiv:1603.05688
- Kim et al. (2008) Kim, M. K., Hirota, T., Honma, M., et al. 2008, PASJ, 60, 991
- Kounkel et al. (2017) Kounkel, M., Hartmann, L., Loinard, L., et al. 2017, ApJ, 834, 142
- Lis et al. (1998) Lis, D. C., Serabyn, E., Keene, J., et al. 1998, ApJ, 509, 299
- López-Sepulcre et al. (2013) López-Sepulcre, A., Taquet, V., Sánchez-Monge, Á., et al. 2013, A&A, 556, A62
- Manoj et al. (2013) Manoj, P., Watson, D. M., Neufeld, D. A., et al. 2013, ApJ, 763, 83
- Masqué et al. (2015) Masqué, J. M., Rodríguez, L. F., Araudo, A., et al. 2015, ApJ, 814, 44
- Megeath et al. (2012) Megeath, S. T., Gutermuth, R., Muzerolle, J., et al. 2012, AJ, 144, 192
- Menten et al. (2007) Menten, K. M., Reid, M. J., Forbrich, J., & Brunthaler, A. 2007, A&A, 474, 515
- Mezger et al. (1990) Mezger, P. G., Wink, J. E., & Zylka, R. 1990, A&A, 228, 95
- Nielbock et al. (2003) Nielbock, M., Chini, R., Müller, S. A. H. 2003, A&A, 408, 245
- Peterson & Megeath (2008) Peterson, D. E., & Megeath, S. T. 2008, Handbook of Star Forming Regions, Volume I, 4, 590
- Shimajiri et al. (2008) Shimajiri, Y., Takahashi, S., Takakuwa, S., Saito, M., & Kawabe, R. 2008, ApJ, 683, 255-266
- Reid et al. (1988) Reid, M. J., Schneps, M. H., Moran, J. M., et al. 1988, ApJ, 330, 809
- Reipurth et al. (1999) Reipurth, B., Rodríguez, L. F., & Chini, R. 1999, AJ, 118, 983
- Rodríguez et al. (1993) Rodríguez, L. F., Marti, J., Canto, J., Moran, J. M., & Curiel, S. 1993, Rev. Mexicana Astron. Astrofis., 25, 23
- Rodríguez-Kamenetzky et al. (2016) Rodríguez-Kamenetzky, A., Carrasco-González, C., Araudo, A., et al. 2016, ApJ, 818, 27
- Rodríguez et al. (2017) Rodríguez, L. F., Dzib, S. A., Loinard, L., et al. 2017, ApJ, 834, 140
- Stutz & Gould (2016) Stutz, A. M., & Gould, A. 2016, A&A, 590, A2
- Takahashi et al. (2008) Takahashi, S., Saito, M., Ohashi, N., et al. 2008, ApJ, 688, 344-361
- Tsujimoto et al. (2003) Tsujimoto, M., Koyama, K., Kobayashi, N., et al. 2003, AJ, 125, 1537
- Williams et al. (2003) Williams, J. P., Plambeck, R. L., & Heyer, M. H. 2003, ApJ, 591, 1025
- Yokogawa et al. (2003) Yokogawa, S., Kitamura, Y., Momose, M., & Kawabe, R. 2003, ApJ, 595, 266
- Zapata et al. (2009) Zapata, L. A., Schmid-Burgk, J., Ho, P. T. P., Rodríguez, L. F., & Menten, K. M. 2009, ApJ, 704, L45
| Central | Adopted | Boostrapped | On-Source | |||||||||
|---|---|---|---|---|---|---|---|---|---|---|---|---|
| VLA | Frequency | Bandwidth | Phase Center | Flux | Flux Density | Phase | Flux Density | Time | ||||
| Date | Conf. | Band | (GHz) | (GHz) | Project | (J2000) | (J2000) | Calibrator | (Jy) | Calibrator | (Jy) | (hours) |
| 1994 Nov 17 | C | X | 8.4649 | 0.100 | AR0323S | 05 35 25.825 | 05 09 51.38 | 3C286 | 5.06 | J0541-0541 | 1.2400.010 | 0.5 |
| 1998 Jan 13 | D | X | 8.4851 | 0.100 | AR0387 | 05 35 24.220 | 05 10 07.27 | 3C48 | 3.15 | J0541-0541 | 0.74200.0010 | 1.0 |
| 2000 Jan 14 | B | X | 8.4851 | 0.100 | AR0411 | 05 35 26.970 | 05 10 01.20 | 3C48 | 3.28 | J0541-0541 | 1.2990.003 | 3.2 |
| 2014 Oct 16 | C | K | 22.000 | 8.048 | AM1313 | 05 35 27.070 | 05 10 00.60 | 3C147 | 2.78 | J0541-0541 | 0.71880.0010 | 1.4 |
| 2014 Oct 16 | C | Q | 44.063 | 8.048 | AM1313 | 05 35 27.070 | 05 10 00.60 | 3C147 | 0.91 | J0541-0541 | 0.52340.0006 | 0.6 |
| 2014 Oct 18 | C | C | 6.000 | 4.048 | AM1313 | 05 35 27.070 | 05 10 00.60 | 3C147 | 7.94 | J0541-0541 | 0.92600.0013 | 0.5 |
| 2014 Oct 18 | C | X | 10.000 | 4.048 | AM1313 | 05 35 27.070 | 05 10 00.60 | 3C147 | 4.84 | J0541-0541 | 0.90500.0006 | 0.5 |
| 2015 Aug 06 | A | C | 6.224 | 3.998 | AO0316 | 05 35 27.080 | 05 10 00.30 | 3C147 | 7.94 | J0541-0541 | 1.1610.004 | 0.5 |
| 2015 Sep 11 | A | C | 6.224 | 3.998 | AO0316 | 05 35 27.080 | 05 10 00.30 | 3C147 | 7.94 | J0541-0541 | 1.0660.004 | 0.5 |
| Alternative | PositionaaPositions derived from elliptical Gaussian fits in the A-configuration C-band map of epoch 2015, except for MIPS 2301 and MIPS 2297 that are not detected in this map, and whose positions were derived from the 1994-2000 X-band and the 2014 Q-band maps, respectively. Uncertainties correspond to those of absolute positions, and are calculated adding in quadrature a systematic error of 001 (Dzib et al., 2017) to the formal error of the fit, (Reid et al., 1988). The systematic error accounts for uncertainties introduced by the phase calibration process and the error of the fit for those due to the source size and signal-to-noise ratio. | ||||
|---|---|---|---|---|---|
| Source | Names | Nature | Ref. | (J2000) | (J2000) |
| VLA 11 | FIR 3, HOPS 370, MIPS 2302, MIR 21 | Class I YSO | 1 | 05 35 27.63370.0007 | 05 09 34.3680.011 |
| MIPS 2301 | MIR 22 | YSO | 2 | 05 35 27.6390.008 | 05 09 37.090.12 |
| MIPS 2297 | MIR 23 | Class II YSO | 2 | 05 35 27.47110.0020 | 05 09 44.060.03 |
| VLA 12N | Jet knot | 3 | 05 35 27.3850.011 | 05 09 50.680.16 | |
| HOPS 64 | MIPS 2293, MIR 24, FIR 4d/e | Class I YSO | 1 | 05 35 26.99600.0023 | 05 09 54.060.03 |
| VLA 12C | Jet knot | 3 | 05 35 27.1110.012 | 05 09 58.570.18 | |
| HOPS 108 | FIR 4, MIPS 2289 | Class 0 YSO | 1 | 05 35 27.0860.004 | 05 09 59.950.06 |
| VLA 12S | Jet knot | 3 | 05 35 26.93890.0017 | 05 10 02.8760.025 | |
| VLA 16 | YSO | 3 | 05 35 26.8240.003 | 05 10 05.640.04 | |
| VLA 15 | FIR 4j | YSO | 3 | 05 35 26.40910.0011 | 05 10 05.9510.016 |
| Flux DensityaaMeasured in the 2014 C-configuration maps, except when noted. Primary beam correction has been applied. Upper limits are 3 . | Proper MotionsddMeasured from the X-band map made from 1994-2000 data and the C-band map at epoch 2015. Positions were obtained from elliptical Gaussian fits. Positional uncertainties were calculated as explained in the footnote of Table Star Formation Under the Outflow: The Discovery of a Non-Thermal Jet from OMC-2 FIR 3 and its Relationship to the Deeply Embedded FIR 4 Protostar. Errors in the proper motions were estimated from the uncertainties in the absolute positions using standard propagation error theory. For resolved sources, opacity effects can produce small differences in the positions if obtained from maps at different wavelengths and/or angular resolutions, resulting in an additional uncertainty in the proper motion measurements. | |||||||||
|---|---|---|---|---|---|---|---|---|---|---|
| 5 cm | 3 cm | 1.3 cm | 0.9 cmbbFrom C-configuration observations made on 27 March 2016 (J. Tobin et al. 2017a, in preparation). | 0.7 cm | Spectral | P.A. | ||||
| Source | (mJy) | (mJy) | (mJy) | (mJy) | (mJy) | IndexccThe datapoint at 0.7 cm has been excluded from the fit in the sources with positive spectral index to avoid possible contamination from dust emission. | (mas yr-1) | (mas yr-1) | (km s-1) | (deg) |
| VLA 11 | 1.760.18 | 2.160.22 | 2.60.3 | 2.60.3 | 4.00.4 | 0.270.10 | 0.70.8 | 0.70.8 | 22 | 5050 |
| MIPS 2301 | 0.0160.004eeObtained from the C-band 2015 A-configuration map because the source is not detected or appears blended with nearby sources in the C-band 2014 C-configuration map. | 0.0320.010ffObtained from the 1994-2000 multiconfiguration map at 3.6 cm because the source appears blended with nearby sources in the X-band 2014 C-configuration map. | 0.03 | 0.03 | 0.07 | 0.300.23 | ggNot detected in the first epoch map (1994-2000 data) or too weak for a reliable positional fit. | ggNot detected in the first epoch map (1994-2000 data) or too weak for a reliable positional fit. | ggNot detected in the first epoch map (1994-2000 data) or too weak for a reliable positional fit. | ggNot detected in the first epoch map (1994-2000 data) or too weak for a reliable positional fit. |
| MIPS 2297 | 0.03 | 0.03 | 0.0490.012 | 0.0920.013 | 0.1160.022 | 1.40.5 | ggNot detected in the first epoch map (1994-2000 data) or too weak for a reliable positional fit. | ggNot detected in the first epoch map (1994-2000 data) or too weak for a reliable positional fit. | ggNot detected in the first epoch map (1994-2000 data) or too weak for a reliable positional fit. | ggNot detected in the first epoch map (1994-2000 data) or too weak for a reliable positional fit. |
| VLA 12N | 0.1340.020 | 0.0730.014 | 0.03 | 0.025 | 0.05 | 1.070.07 | 2211 | 4611 | 10021 | 15512 |
| HOPS 64 | 0.0110.003eeObtained from the C-band 2015 A-configuration map because the source is not detected or appears blended with nearby sources in the C-band 2014 C-configuration map. | 0.03 | 0.0690.012 | 0.1400.016 | 0.300.03 | 1.510.06 | ggNot detected in the first epoch map (1994-2000 data) or too weak for a reliable positional fit. | ggNot detected in the first epoch map (1994-2000 data) or too weak for a reliable positional fit. | ggNot detected in the first epoch map (1994-2000 data) or too weak for a reliable positional fit. | ggNot detected in the first epoch map (1994-2000 data) or too weak for a reliable positional fit. |
| VLA 12C | 0.240.03hhThe expected contribution of HOPS 108, estimated from higher resolution data, has been subtracted. | 0.090.03hhThe expected contribution of HOPS 108, estimated from higher resolution data, has been subtracted. | 0.03 | 0.024 | 0.04 | 1.30.4 | 1114 | 5015 | 10030 | 19216 |
| HOPS 108 | 0.0180.003eeObtained from the C-band 2015 A-configuration map because the source is not detected or appears blended with nearby sources in the C-band 2014 C-configuration map. | 0.0600.014ffObtained from the 1994-2000 multiconfiguration map at 3.6 cm because the source appears blended with nearby sources in the X-band 2014 C-configuration map. | 0.0470.011 | 0.1150.014 | 0.0840.017 | 0.70.3 | 147 | 97 | 3214 | 5725 |
| VLA 12S | 0.250.03 | 0.1920.024 | 0.160.03 | 0.1370.020 | 0.04 | 0.590.20 | 133 | 143 | 376 | 22310 |
| VLA 16 | 0.0170.003eeObtained from the C-band 2015 A-configuration map because the source is not detected or appears blended with nearby sources in the C-band 2014 C-configuration map. | 0.03 | 0.0400.010 | 0.0590.012 | 0.0690.014 | 0.730.06 | ggNot detected in the first epoch map (1994-2000 data) or too weak for a reliable positional fit. | ggNot detected in the first epoch map (1994-2000 data) or too weak for a reliable positional fit. | ggNot detected in the first epoch map (1994-2000 data) or too weak for a reliable positional fit. | ggNot detected in the first epoch map (1994-2000 data) or too weak for a reliable positional fit. |
| VLA 15 | 0.0710.014 | 0.1000.013 | 0.2000.022 | 0.320.04 | 0.600.07 | 1.020.15 | 13 | 23 | 46 | 34090 |