ALMA observations of cold molecular gas in AGN hosts at 1.5 - Evidence of AGN feedback?
Abstract
Similarly to the cosmic star formation history, the black hole accretion rate density of the Universe peaked at 13. This cosmic epoch is hence best suited for investigating the effects of radiative feedback from AGN. Observational efforts are underway to quantify the impact of AGN feedback, if any, on their host galaxies. Here we present a study of the molecular gas content of AGN hosts at z1.5 using CO[2-1] line emission observed with ALMA for a sample of 10 AGNs. We compare this with a sample of galaxies without an AGN matched in redshift, stellar mass, and star formation rate. We detect CO in 3 AGNs with which translates to a molecular hydrogen gas mass of assuming conventional conversion factor of . Our results indicate a >99% probability of lower depletion time scales and lower molecular gas fractions in AGN hosts with respect to the non-AGN comparison sample. We discuss the implications of these observations on the impact that AGN feedback may have on star formation efficiency of z>1 galaxies.
keywords:
quasars - emission lines - galaxies - evolution - star formation1 Introduction
In the past decade, using mm and sub-mm telescopes there has been a remarkable progress in the study of cold molecular gas content in galaxies. (e.g. Greve et al., 2005; Daddi et al., 2010; Engel et al., 2010; Tacconi et al., 2010; Davis et al., 2011; Geach et al., 2011; Bauermeister et al., 2013; Bothwell et al., 2013; Saintonge et al., 2013; Tacconi et al., 2013; Sargent et al., 2014; Genzel et al., 2015). This information provides a key ingredient to galaxy evolutionary studies as it is out of this gas that the galaxy may form stars.
Most of the molecular gas in the interstellar medium (ISM) exists in the form of molecular hydrogen (). However, in the commonly used optical or radio portions of the electromagnetic spectrum, does not have any emission or absorption lines at the typical cool temperatures of the ISM, which makes it necessary to use other molecules as its tracers in most instances. The high abundance of Carbon Monoxide (CO) makes it one of the most popular tracer, although other molecules have also often been used in the literature (e.g. Gao & Solomon, 2004; Greve et al., 2005; Alaghband-Zadeh et al., 2013; Gullberg et al., 2015; Heyer & Dame, 2015). The collisions of the tracer molecules with results in emission of photons due to excitation or de-excitation. The emission from these tracer molecules fall in wavelength regions which are more easily observed than those of . The conversion between CO luminosity and gas mass is usually parametrized through a factor, , which typically ranges between 0.8 and 4 (in units of ) for galaxies with an ISM enriched to more or less the Solar abundance (e.g. Arimoto et al., 1996).
Star forming galaxies form a tight correlation between their star formation rate (SFR) and stellar mass () in the range of 9.5<log M∗/<11.5, the so-called “main-sequence” (MS) of star forming galaxies (e.g. Daddi et al., 2007; Elbaz et al., 2007; Noeske et al., 2007; Pannella et al., 2009; Whitaker et al., 2012; Kashino et al., 2013; Rodighiero et al., 2014; Speagle et al., 2014). The Main Sequence relation is known to exist in a range of redshifts with an evolution in its normalization (e.g Whitaker et al., 2012; Bonzini et al., 2015) as well as its slope (e.g. Speagle et al., 2014; Schreiber et al., 2015). The molecular gas properties of normal galaxies on the MS and starburst (SB) galaxies lying above the MS correlation have been the subject of several studies aiming at quantifying the relation between the molecular gas content or gas fractions of these galaxies with other galaxy properties such as the SFR. Most of these studies are based on molecular gas measurements as traced by CO. Results from previous work suggest that there are in fact two modes of star formation in high redshift galaxies: a starburst one with the molecular gas usually distributed in a compact configuration and short consumption times ( years), typical of submillimetre galaxies (and local ultra-luminous infrared galaxies [ULIRGs]); and a quiescent one, with gas reservoirs distributed in extended disks and longer consumption times ( years), which is observed on the MS at (and in local spiral galaxies) (Daddi et al., 2010; Genzel et al., 2010; Sargent et al., 2014; Silverman et al., 2015).
AGNs could play an important role in regulating the ISM content of their host galaxies through radiative winds and mechanical energy, which, if powerful enough, could have the capability to sweep the entire galaxy clean of gas, a process generically named radiative mode of “AGN feedback” (see review by Fabian, 2012). AGN feedback has also been invoked to reduce the number of massive galaxies, which otherwise is over-predicted by simulations assuming CDM cosmology (Silk & Mamon, 2012). The redshift range 13 presents an interesting laboratory to test radiative feedback from AGNs as this epoch witnessed the peak accretion activity of black holes and high star formation rate in the universe (e.g. Lilly et al., 1996; Shankar et al., 2009; Madau & Dickinson, 2014). There has been growing evidence of powerful and extended kiloparsec scale outflows from these high redshift quasars (Harrison et al., 2012; Brusa et al., 2015a; Perna et al., 2015; Kakkad et al., 2016; Wylezalek & Zakamska, 2016; Zakamska et al., 2016) which may be affecting their host galaxies by suppressing star formation in regions dominated by the outflows (Cano-Díaz et al., 2012; Cresci et al., 2015b; Carniani et al., 2016).
A promising way to quantify the impact that these AGN driven outflows may have on their host galaxies is by studying their cold molecular gas properties. Nowadays, a systematic study of the molecular gas properties of AGN host galaxies is still missing. Most of the molecular gas studies in AGNs have been restricted to high luminosity AGNs which usually lie above the main-sequence, in the so called starburst regime whose molecular gas properties mimic those of the non-AGN starburst population and local ULIRGs (e.g Aravena et al., 2008; Polletta et al., 2011; Riechers, 2011; Villar-Martín et al., 2013; Feruglio et al., 2014; Stefan et al., 2015; Leung & Riechers, 2016). Some other studies have focused on unobscured AGNs for which measurements of gas fractions are highly uncertain owing to the inaccurate stellar mass determinations.
Also, there is very little knowledge about the molecular gas content of obscured AGNs as we move to lower bolometric luminosities at , which coincides with the peak of the star formation and black hole accretion activity in the universe. Mullaney et al. (2015) showed that most of these low-to-moderate luminosity AGNs lie on the MS of the star forming galaxies which make them an ideal choice for comparative study between AGNs and normal star forming galaxies without an AGN. Throughout the paper, we define “non-AGN” galaxies as those which lie on the MS of star forming galaxies and have an X-ray luminosity (2-10 keV) less than erg/s, while any object above this X ray luminosity is regarded as an AGN.
In this paper we present an investigation of the molecular gas properties of 10 obscured AGNs at z1.5 with the Atacama Large Millimeter/sub-mm Array (ALMA) selected based on their position on the MS of star forming galaxies. Our ultimate aim is to compare the gas properties of the AGN sample with those of the non-AGN star forming population to infer if there is a difference in the gas content and consequently the star formation process between the two groups.
This paper is arranged as follows: Section 2 mentions our strategy for selecting the AGN sample. Observation parameters and details about the data reduction are summarized in Sect. 3. Sect. 4 describes the results obtained and their implications for the big picture. Sect. 5 discusses our results, while in Sect. 6 we present our conclusions. Throughout this paper, we use the following cosmology: = 70 km/s, = 0.7, = 0.3, = 0.0.
2 Target selection
We focus our study on a sample of AGNs at 1.5, close to the epoch of peak accretion activity of black holes, ideal for testing radiative AGN feedback. We chose AGNs with host galaxies on the MS where most of the moderate luminosity AGN and non-AGN host galaxies are located (Mullaney et al., 2015). The non-AGN galaxy sample matched in M∗, SFR and forms a key component of this study since it is with respect to this population that the molecular gas properties of our AGN sample will be compared to. We restrict our AGN sample to moderate luminosity () obscured AGNs which sets this study apart from previous work, which has focused on high luminosity AGNs () which usually lie above the MS. Our selection criteria aim at probing the molecular gas properties of the general moderate luminosity AGN population.
Numerous parametrizations have been used for the MS of star forming galaxies in the literature (e.g. Pannella et al., 2009; Whitaker et al., 2012; Schreiber et al., 2015). Each MS locus has been derived from a different sample and they suffer from many selection effects (Renzini & Peng, 2015). For the purpose of this work, we adopt one of the most recent parametrization from Schreiber et al. (2015) which uses a large sample of galaxies to investigate the redshift evolution of the MS in the CANDELS field. Their sample is mass complete above and is able to trace the higher end of the MS slope more accurately compared to previous works.
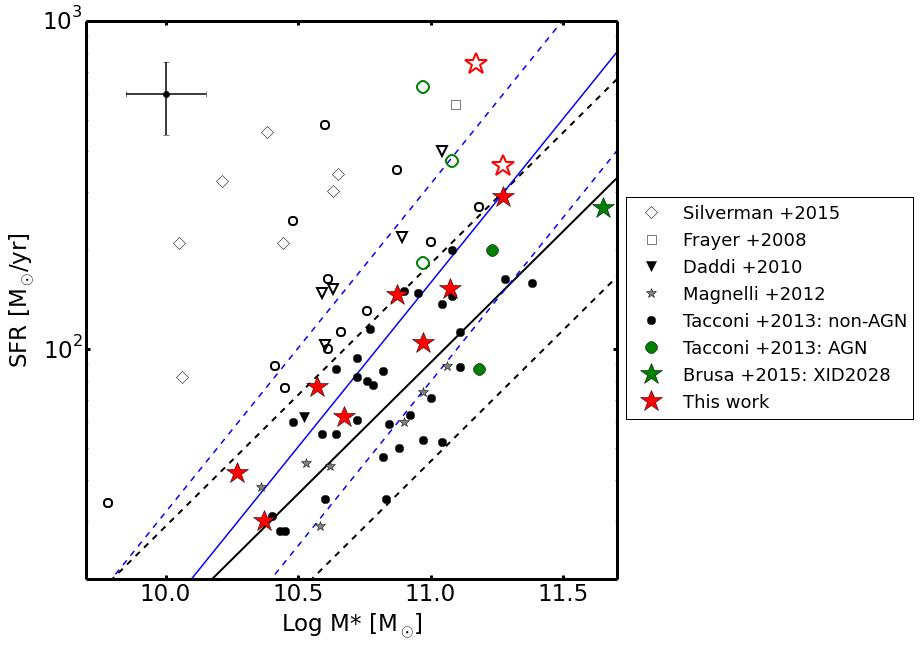
We selected our AGN sample in the X-ray band which is almost free from contamination by other sources such as normal star forming regions. We started with 4500 AGNs merging the Chandra and XMM-Newton surveys of the COSMOS field (Brusa et al., 2010; Civano et al., 2012), the Chandra survey of the Extended Chandra Deep Field South (E-CDFS: Lehmer et al., 2005), and the 4Ms Chandra observations of the Chandra Deep field South (CDFS: Xue et al., 2011). All these survey areas have extensive multi-wavelength coverage from the radio to the UV band, which allow a proper physical characterization of the galaxy properties (e.g. stellar mass, star formation rate, morphology), (Tozzi & Norman, 2001; Szokoly et al., 2004; Mainieri et al., 2005; Brusa et al., 2010; Salvato et al., 2011; Civano et al., 2012; Bongiorno et al., 2012; Rosario et al., 2012). Out of this large X-ray sample, we considered only those targets which have high quality flag for secure spectroscopic redshift determination (Class 3 and 4 according to convention by Lilly et al. (2007)) and accurate SFR and estimates. The SFR were estimated from Herschel Photoconductor Array Camera and Spectrometer (PACS) photometry using the relation assuming a Chabrier initial mass function (IMF). With the Herschel PACS detection, one can effectively impose a lower limit on the SFR and consequently M∗. Based on the SFR and the AGN bolometric luminosity, , we do not expect any significant contamination from the AGN to the Far-Infrared (FIR) end of the spectrum (Mullaney et al., 2012; Rosario et al., 2012). The stellar masses of the host galaxies were computed using a two component (galaxy+AGN) SED fitting technique (Bongiorno et al., 2012; Bonzini et al., 2013), assuming a Chabrier IMF. Typical errors associated with the parameters such as SFR, and due to the choice of SED templates used are about a factor of 2. We refer the reader to Bonzini et al. (2015) for details about the SED fitting. Our original selection based on the MS line derived by Pannella et al. (2009) returned a sample of 10 objects, of which C92 was an outlier in the strong starburst regime (more in Sect. 4). However, with the new parametrization of the MS from Schreiber et al. (2015), we arrive at a final sample of 8 objects on the MS and 2 starburst galaxies, shown by the red stars in Fig. 1. The basic properties of all the ALMA targets are listed in Table 1.
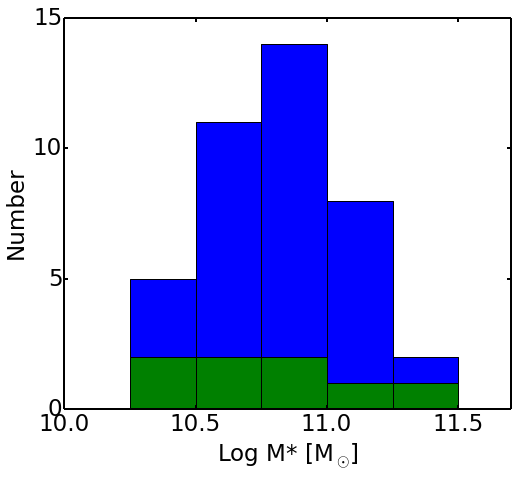
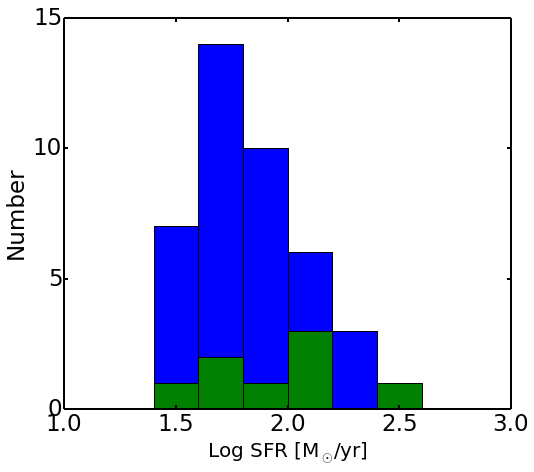
As already mentioned, a key element to this study is to have a comparison sample of non-AGN galaxies on the MS. Since there is an evolution in the properties of the galaxies and black holes with redshift (e.g. Walter et al., 2016), it is important to select our sample matched in redshift. We constructed the comparison non-AGN sample from the work of Daddi et al. (2010); Tacconi et al. (2013) and Magnelli et al. (2013) for which the molecular gas measurements are available from CO observations using IRAM-PdBI. We refer the reader to the corresponding papers for further details about the observations and parent sample. We selected only those objects falling in the redshift range and on the MS at 1.5. We also matched the sample from these works in SFR and M∗ to that of the AGN sample to make sure we are comparing similar galaxies. This is apparent from the histograms in Fig. 2, which show the comparison between the and SFR coverage of the AGN and non-AGN sample. All the SFR have been computed assuming a Chabrier IMF. Our final AGN sample and all the other comparison samples in the SFR-M∗ plane are shown in Fig. 1. The red stars correspond to the ALMA sample presented in this paper while the black and grey filled symbols are the non-AGN galaxies. The open symbols are the starburst galaxies, matched in M∗ and , to be used for analysis later to check if the properties of the AGN sample are closer to those of the non-AGN star forming galaxies or starburst galaxies. The MS line used for reference in this paper is adapted from Schreiber et al. (2015) with a dispersion of 0.3 dex, details of which were mentioned earlier in this section. The blue line corresponds to the Pannella et al. (2009) MS parametrization, based on which the sample was initially selected. All targets but C92 fall under this parametrization (within 0.3 dex). It is apparent from the figure that the AGN and the non-AGN galaxy samples cover the same range in the SFR-M∗ plane. The same coverage in is highly desirable given that observations at both low and high redshift galaxies point to an increasing gas fraction with decreasing stellar mass (e.g. Magdis et al., 2012; Saintonge et al., 2012; Tacconi et al., 2013).
We have complemented our ALMA main sequence AGN sample with literature AGN data (green filled symbols in Fig. 1). Five galaxies from the Tacconi et al. (2013) sample have been classified as AGN by matching them with the Nandra et al. (2015) AEGIS-X catalog with X ray luminosity, . Two of them are MS galaxies. XID2028 from Brusa et al. (2015b) is also a main sequence AGN. This source has been extensively studied in ionized (Perna et al., 2015; Cresci et al., 2015b) as well as molecular (Brusa et al., 2015a) gas phases and has been shown to be in an active outflowing phase.
| ID | RA | DEC | Log | Log M | Log | SFRe | FIELD | |
|---|---|---|---|---|---|---|---|---|
| (h:m:s) | () | (erg/s) | () | (L⊙) | (M⊙/yr) | |||
| DETECTIONS | ||||||||
| C1591* | 10 01 43 | +02 33 31 | 1.238 | 45.7 | 11.3 | 12.6 | 362 | COSMOS |
| C92* | 10 01 09 | +02 22 55 | 1.581 | 45.4 | 11.2 | 12.8 | 740 | COSMOS |
| #226 | 03 32 16 | 27 49 00 | 1.413 | 42.8 | 10.9 | 12.2 | 146 | CDFS |
| NON-DETECTIONS | ||||||||
| X5308 | 09 59 22 | +01 36 18 | 1.285 | 45.5 | 11.0 | 12.0 | 104 | COSMOS |
| X2522 | 09 57 28 | +02 25 42 | 1.532 | 46.3 | 11.3 | 12.5 | 290 | COSMOS |
| C1148 | 10 00 04 | +02 13 07 | 1.563 | 46.8 | 11.1 | 12.2 | 153 | COSMOS |
| C488 | 10 01 47 | +02 02 37 | 1.171 | 45.4 | 10.3 | 11.6 | 42 | COSMOS |
| C152 | 10 00 39 | +02 37 19 | 1.188 | 45.5 | 10.4 | 11.5 | 30 | COSMOS |
| C103 | 10 01 10 | +02 27 17 | 1.433 | 45.1 | 10.7 | 11.8 | 62 | COSMOS |
| #682 | 03 32 59 | 27 45 22 | 1.155 | 43.4 | 10.6 | 11.9 | 77 | CDFS |
aSecure spectroscopic redshifts obtained from optical spectra,
bAGN bolometric luminosities obtained as presented in Lusso et al. (2011),
cHost galaxy stellar mass obtained with a two component (AGN+galaxy) SED fit assuming a Chabrier IMF (Bongiorno et al., 2012; Bonzini et al., 2013),
dTotal infra-red luminosity (8-1000m) derived using Herschel PACS+SPIRE photometry,
eHost galaxy star formation rate computed fitting the UV-to-FIR (Herschel) photometry with the Berta et al. (2013) template library and converting the best fit 8-1000m luminosity to a SFR using the Kennicutt (1998) prescription assuming a Chabrier IMF.
NOTE: Typical uncertainty in quantities such as and SFR, taking into account different SED templates used, is about 0.3 dex.
*These galaxies fall under the SB regime in SFR-M∗ plane according to the Schreiber et al. (2015) MS parametrization.
3 Observations and Data analysis
The ALMA observations of the 10 AGN host galaxies were carried out in cycle 2 (Project code: 2013.1.00171.S, PI: V. Mainieri) using 35-38 12m antennas. The velocity/spectral resolution for all observations was 24 km/s. The observations were carried out in Band 3, with the receiver tuned to the frequency of emission (from now simply CO(2-1) unless otherwise specified, rest frame frequency = 230.5 GHz). The CO(2-1) transition was targeted in order to sample the extended, cool gas reservoir of our galaxies which is assumed to contain the bulk of the gas mass, thereby avoiding the uncertain excitation corrections affecting higher-J transitions. The observations were executed in three “scheduling blocks” to optimize the use of ALMA time by simultaneously detecting CO(2-1) for different objects with the same correlator configuration. The on-source exposure time was kept between 2.5-8 minutes depending on the sensitivity requirements. The root-mean-square (rms) noise requirements were calculated in order to obtain a 3 detection of the CO line assuming the correlation as measured for MS galaxies in Daddi et al. (2010). We reached baselines up to 800 m resulting in beam sizes of and . All the observed properties of each target are reported in Table 2. Summarizing, we have 3 CO detections and 7 non-detections.
We used the calibrated data products as delivered to us, while imaging for all the targets was done using CASA (version 4.2.2). The images were cleaned using the CASA task “CLEAN” with “natural” WEIGHTING. The spectral binning was kept below 100 km/s in order to get at least 4 channels for CO detection, assuming an average width of the CO(2-1) line of 400 km/s (Daddi et al., 2010). The exact choice of the width depended on where we get the maximum S/N ratio. Following this approach, imaging was done with velocity bins of 50 km/s for C92 and for the remaining targets we used 80 km/s. The imaging results are described in Sect. 4. The angular scale of the final image is 160′′ and the analysis was restricted within 25′′ of the field center.
To determine the rms values, we used the CASA task "immoments" to construct moment 0 maps by collapsing along the channels with CO detection (for C92, C1591 & #226) or along the channels with expected CO detection and computed rms on these maps. We did not compute rms directly from the spectrum since the noise is a function of frequency and this introduces systematic uncertainties in our measurements (Maiolino et al., 2015). For galaxies not detected in CO, the CO flux in Table 2 represents a 3- upper limit calculated from sensitivity reached over a channel width of 320 km/s around the expected position of CO(2-1) line. The choice of 320 km/s velocity bin corresponds to the mean of the FWHM of CO(2-1) line from the CO detections (see also Table 3). Most of the undetected galaxies lie on the lower mass end of the AGN host mass distribution. Consequently, dynamical arguments suggests that we would expect a lower line width compared to the detected ones which are on the massive end of this distribution. This would lead to an expectation of lower CO luminosity than calculated using a width of 320 km/s based on previous reports on CO luminosity and linewidth relation in literature (e.g. Bothwell et al., 2013; Carilli & Walter, 2013; Sharon et al., 2016). For C1591, C92 and #226, we reached a sensitivity of 0.21, 0.13 and 0.11 Jy/beam in 880 km/s, 320 km/s and 320 km/s wide spectral channels (these bins span the entire CO(2-1) line).
In case of a detection, the spectra were extracted from the ALMA cube using a circular aperture with a radius of 1.5" in case of C1591 and C92 and 1" in case of #226. We fit the CO(2-1) line using the IDL routine MPFIT (Markwardt, 2012) using a single Gaussian component, through which the flux of the CO line and the errors on the fits were estimated. The continuum remained undetected for all targets. The CO flux was also measured by fitting the data in UV space with the CASA task “uvmodelfit” using a point source or an elliptical Gaussian model which gives the centroid of the line emission and the integrated flux. The line flux obtained with the fitting routine and the UV model fit were compared with each other and they agree well at one-sigma error levels.
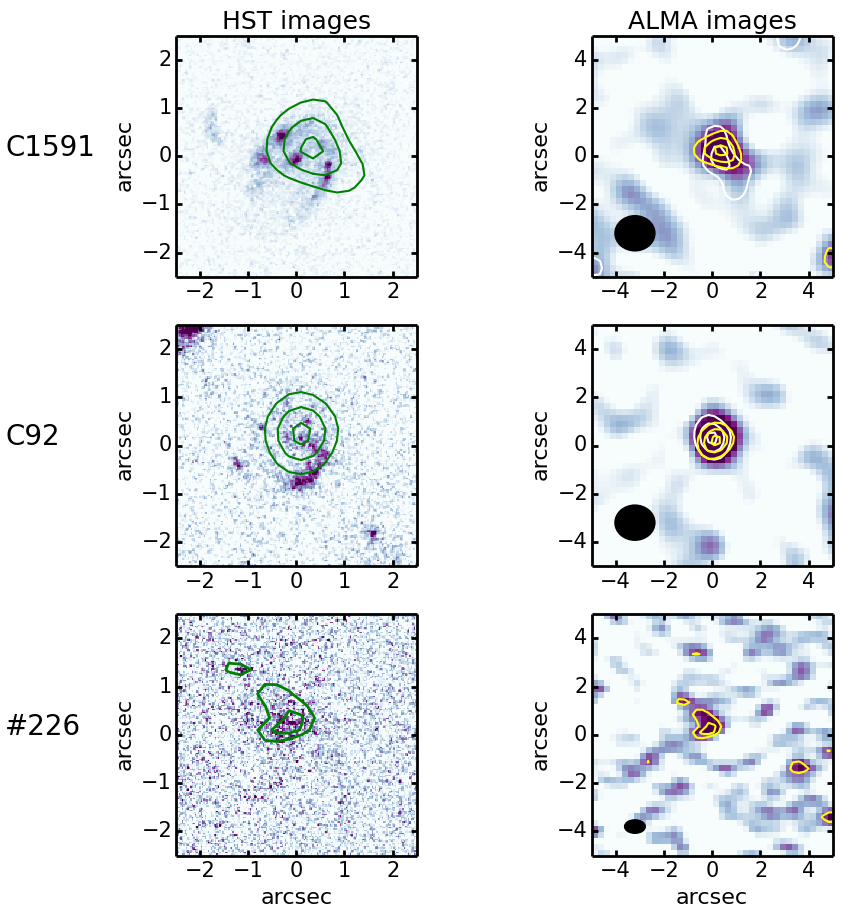
Note the different scales of the two panels, for visualization purposes. North is up and East is towards left in all the maps.
4 Results and Analysis
We detect CO(2-1) emission in 3 out of the 10 targets observed with ALMA. C92 and C1591, both MS outliers, are detected with a >5 and 4 significance respectively, while #226, in the CDFS field and a MS candidate, is detected with 3 significance. The reported significances are observed both in the spectra and the moment (flux) maps. The statistics were obtained around a region with respect to the field center. The results from our analysis are reported in Table 2.
| ID | Beam sizec | Log | |||||
|---|---|---|---|---|---|---|---|
| (s) | (Jy km/s) | (K km/s pc2) | (M⊙) | ||||
| DETECTIONS | |||||||
| C1591* | 1.237 | 151.2 | 1.6x1.4 | 0.860.21 | 10.22.4 | 10.72.6 | 0.20.1 |
| C92* | 1.581 | 151.2 | 1.6x1.4 | 1.010.13 | 10.41.2 | 11.01.3 | 0.40.1 |
| #226 | 1.389 | 151.2 | 0.8x0.5 | 0.290.11 | 9.83.7 | 10.43.9 | 0.20.2 |
| NON-DETECTIONS | |||||||
| X5308 | - | 151.2 | 1.6x1.4 | <0.60 | <10.0 | <10.6 | <0.3 |
| X2522 | - | 151.2 | 1.6x1.4 | <0.65 | <10.2 | <10.8 | <0.2 |
| C1148 | - | 151.2 | 1.6x1.4 | <0.65 | <10.2 | <10.8 | <0.3 |
| C488 | - | 483.84 | 1.5x1.4 | <0.30 | <9.6 | <10.2 | <0.5 |
| C152 | - | 483.84 | 1.5x1.4 | <0.35 | <9.7 | <10.3 | <0.4 |
| C103 | - | 483.84 | 1.5x1.4 | <0.30 | <9.8 | <10.4 | <0.3 |
| #682 | - | 151.2 | 0.8x0.5 | <0.60 | <9.9 | <10.5 | <0.5 |
aRedshift calculated from the observed CO(2-1) peak,
bOn source exposure time in seconds,
cBeam size achieved during observations,
dThe CO flux in Jy km/s. In case of non-detection this represents a 3 upper limit on the flux obtained from sensitivity reached over 240 km/s channel width around the expected position of CO line (see text for further details).
eThe CO(1-0) luminosity calculated following Solomon & Vanden Bout (2005). We employ a conversion factor of 0.8 to convert from . The values of for non-detection represent the 3 upper limit.
fMolecular mass calculated from CO luminosity following the canonical relation, with , commonly used in literature for MS galaxies,
gGas fraction .
*All these galaxies are classified as starbursts according to the MS line from Schreiber et al. (2015) as mentioned in Table 1.
During the design of our ALMA program we used the parametrization of the MS line for star forming galaxies presented in Pannella et al. (2009) which is shown by the blue line in Fig. 1. All targets but C92 fell uniformly along this line. For C92 we have in the meantime revised the estimate of the SFR which moved it outside the MS region. As mentioned in Sect. 2, we adopt here the latest parametrization of the MS from Schreiber et al. (2015) as it traces the higher mass end of the slope more accurately. Consequently, the slope of the entire MS line is flatter than the one quoted by Pannella et al. (2009)111Due to low number statistics at the high mass end, it is debated if the slope is constant throughout this range of mass.. This resulted in C92 and C1591 being classified as starburst galaxies.
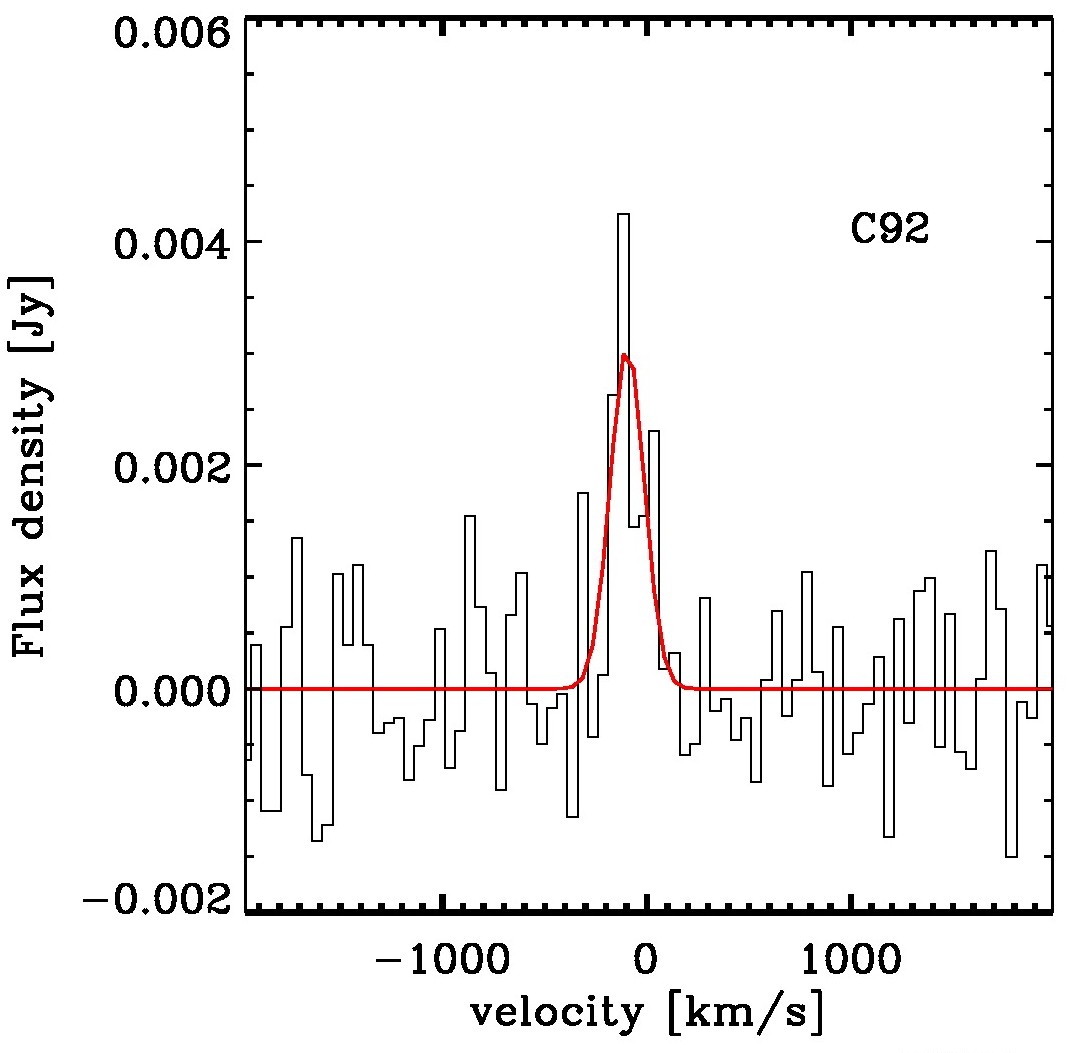
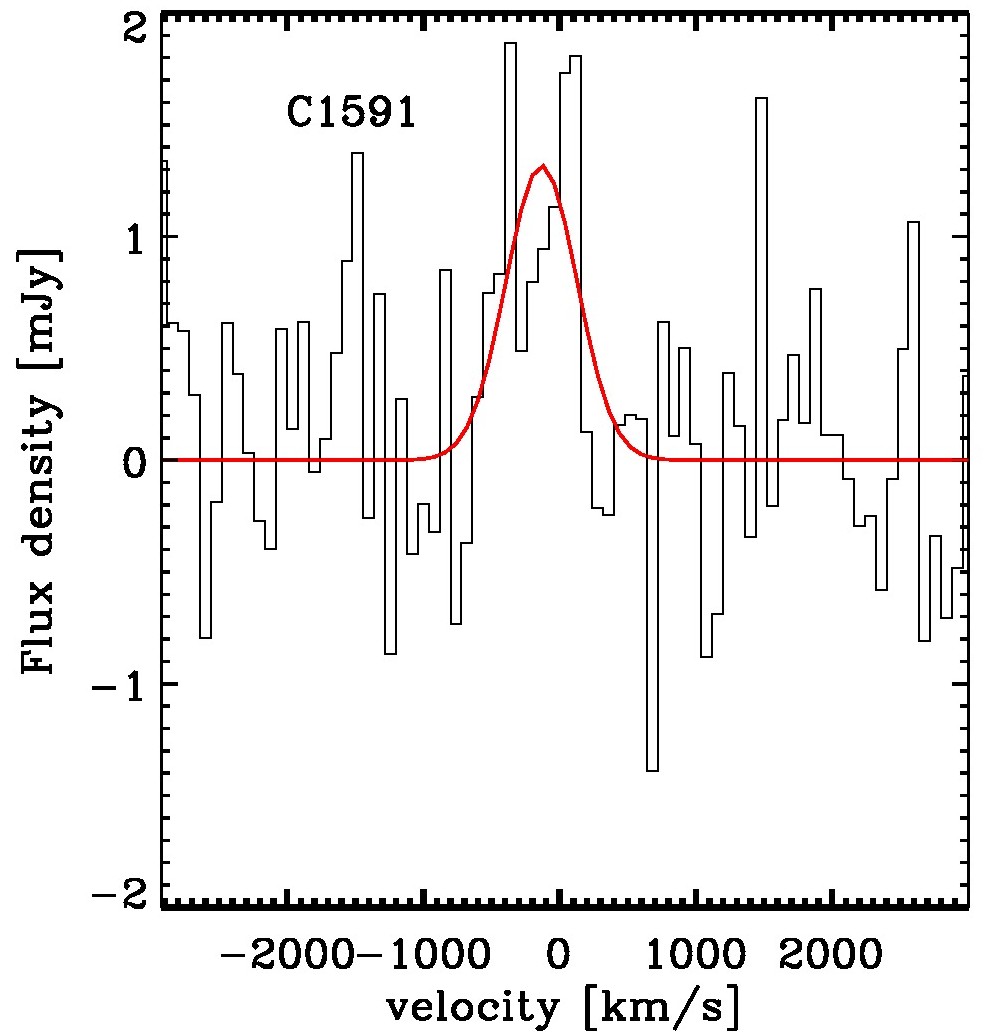
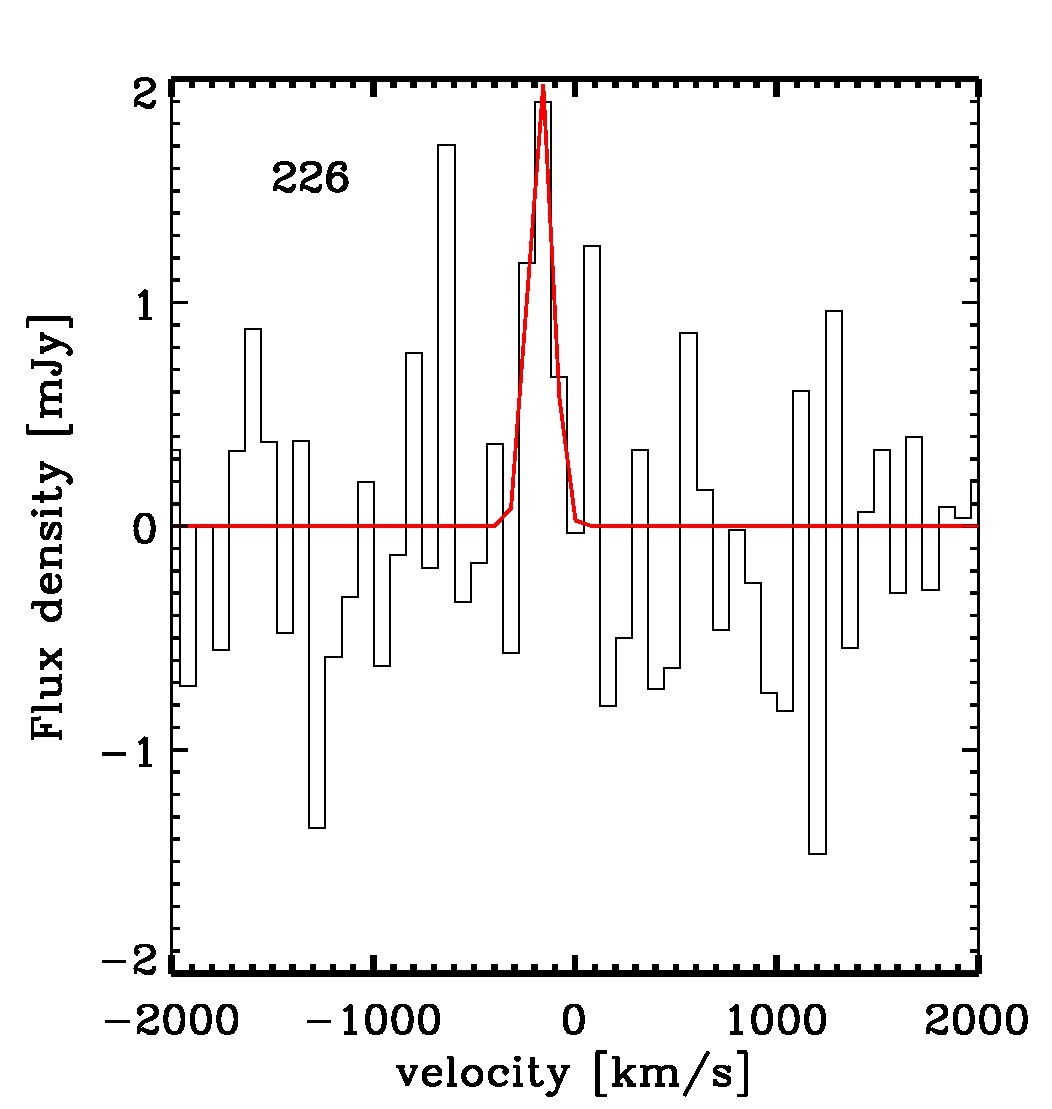
The extracted spectra of each detected object with the Gaussian fits to the emission line profiles are shown in Fig. 3 and the results of various fitting parameters are reported in Table 3. In all cases, the peak of the CO emission is blueshifted compared to the optical wavelengths obtained from the COSMOS & CDFS catalogue, which is apparent from the central velocity of the Gaussian fits as reported in Table 3. Redshifts obtained from the optical catalogues in the respective fields have been used as a reference for all the plots.
| ID | v | vb | fc |
|---|---|---|---|
| (km/s) | (km/s) | (Jy km/s) | |
| C1591 | -133.3680 | 61671 | 0.860.21 |
| C92 | -77.2350 | 22418 | 1.010.13 |
| #226 | -169.8080 | 13722 | 0.290.11 |
4.1 Molecular mass from CO
C1591 has a very broad CO emission line profile with a FWHM of km/s as shown in Fig. 3, middle panel. The CO emission from C1591 shows a double peaked profile suggesting a rotating galaxy. The flux map corresponding to the integrated CO profile is shown in Fig. 4, top right panel. The overlaid white and yellow contours are the emission from these two peaks, each of width 200 km/s. The top left panel of Fig. 4 shows the HST-ACS image of C1591 with CO emission line contours of the entire profile overlaid suggesting a similar extension of CO emission compared to the UV/optical image. Using CASA task imfit, we fit an elliptical Gaussian model to the CO(2-1) emission line integrated map over a velocity width of 880 km/s which gives values of the image component size convolved with the beam as 2.250.15′′ and 1.510.16′′. This suggests a marginal extension in the CO emission profile in the image. Deconvolving the image from the beam, we arrive at a half-light radius of 0.5′′ (4.15 kpc) for C1591.
The CO emission line width in C92 is narrower with respect to C1591 and with a high significance of detection. Therefore, we were able to get the spectrum in smaller bins 50 km/s wide (see Fig. 3). A closer look suggests a double peaked CO emission profile in C92 as well and we constructed the flux maps with the overlaid contours, similar to the case of C1591. This is shown in the middle panel of Fig. 4. The HST map does not reveal a wider extent of molecular gas in the host galaxy compared to the UV/optical image and the CO map shows that the emission is not resolved with the synthesized ALMA beam. An X-shooter spectrum of C92, which is also known as XID60053, is available and the results were published in Brusa et al. (2015b). This object has a high extinction () due to which the and [OIII] emission lines are barely detected.
The marginally resolved CO emission from C1591 can be used to calculate the gas mass using the dynamical mass method which has been frequently used in literature (e.g. Carilli et al., 2010; Daddi et al., 2010; Hodge et al., 2012; Tan et al., 2014). Within a half-light radius (), the dynamical mass for a spherically symmetric case is given by the following equation:
| (1) |
where is the velocity dispersion of the CO emission line with being the line width (FWHM) and is the gravitational constant. The gas mass can then be derived by subtracting the stellar mass and the dark matter component using the following equation (Daddi et al., 2010):
| (2) |
Here we assume a dark matter component within the half-light radius to be 25% of the total dynamical mass (e.g. Daddi et al., 2010). This assumption is based on observations of local spirals (Pizagno et al., 2005) where the total mass at the half-light radius is dominated by baryons. Using this dynamical method, we obtain a gas mass of for C1591. At the redshift of C1591, HI gas content is negligible compared to , hence the reported gas mass is believed to be the mass of molecular hydrogen in the host galaxy (e.g. Neeleman et al., 2016).
For all sources, including C1591, we calculate the CO luminosity using the result from Solomon & Vanden Bout (2005):
| (3) |
where is the CO[2-1] flux in Jy km/s, is the observing frequency in GHz, is the luminosity distance in Mpc at redshift . In case of non-detection, we use the rms from the measurements (see Sect. 3 for a description on calculation of rms) to estimate 3 upper limits on the CO luminosity. Stacking of spectra from the sources with no detection revealed no emission lines, justifying our estimation of upper limits for these sources. In all cases, we assume an excitation correction of 0.8 to convert from to 222Literature values range from 0.7-0.85. See e.g. Frayer et al. (2008); Daddi et al. (2010); Brusa et al. (2015b); Silverman et al. (2015). The calculated CO luminosities and the upper limits are reported in Table 2.
The above calculated CO luminosities are then converted into molecular mass using . presents the biggest systematic uncertainty in molecular gas measurements using CO since its value could lie anywhere between 0.8-3.6 (e.g. Arimoto et al., 1996; Bolatto et al., 2013) depending on various factors such as metallicity and specific SFR (sSFR) (e.g. Genzel et al., 2012; Hunt et al., 2015). For the purpose of our study, we use an value of 3.6, which is commonly used in literature for MS galaxies at a similar redshift as our AGN sample (e.g. Daddi et al., 2010; Tacconi et al., 2013), ignoring the possibility that AGNs might have different due to hard ionizing radiation (see Sect. 5). The gas mass measurement using the dynamical method for C1591 described above gives an value of 4.11.6 which is well within the value of 3.6 used here for all cases. To be consistent, we recalculate the molecular gas mass for the MS comparison sample using =3.6 and for literature data using CO[3-2] emission line, we employ an excitation correction of 2 to convert to CO[1-0] luminosity following Tacconi et al. (2013).
4.2 Observed relations for AGNs
The main goal of this paper is to identify whether the presence of an AGN affects the molecular gas content of its host galaxy and consequently the star formation process. To answer these questions, we compare our molecular mass measurements with those of normal star forming galaxies and starburst galaxies without an AGN. Details of the comparison sample were mentioned earlier in Sect. 2. We stress again that the comparison sample has been matched in redshift and stellar mass to make sure we compare galaxies with similar properties.
Figure 5 shows the various correlations obtained for our targets in the context of the entire comparison sample. Before fitting any function to the AGN sample, we did a survival two-sample test using R function survdiff() implemented in python on each plot to check the probability that the AGN sample and the non-AGN sample are drawn from the same distribution. The function returns a -value from a chi-squared distribution. For all the correlations derived in this section, we obtain a -value of 0.008 i.e. a >99% probability that our AGN sample has a different distribution from the normal MS star forming galaxies. While deriving the correlations for AGNs, we kept the slope of the linear function to be equal to that of the MS relations for ease of comparison with the non-AGN sample.
The top left panel in Fig. 5 shows vs. plot for galaxies between redshift 1 and 2. The infrared luminosity, here represents the total infrared luminosity for all the sample in the plot. The color coding of different points is the same as in Fig. 1. We employ a standard excitation correction of 0.8 to convert from CO(2-1) luminosity to CO(1-0) luminosity for our as well as all the comparison samples for consistency. First of all, we do not find a significant difference in the - correlation for MS and non-AGN starburst galaxies as reported in previous works such as those of Genzel et al. (2010), Sargent et al. (2014), and Tacconi et al. (2013). These works used a compilation of local as well as high redshift galaxies. However, when we only consider the high redshift galaxies between 12, only one correlation is required to describe the star burst and MS population in the - plane given by the following mean equation adapted from Sargent et al. (2014) for MS galaxies and shown as a black line in Fig. 5, upper left panel:
| (4) |
This is consistent with the more recent results (e.g. Genzel et al., 2015; Silverman et al., 2015). Our MS AGN sample lie below this correlation and considering all the 3 upper limits as detections, we derive an average best-fit function for - correlation for AGNs:
| (5) |
This is given by the red line in Fig. 5, upper left panel. Thus the mean - correlation for AGNs is a factor “at least” 2 lower than that of main sequence non-AGN galaxies. Such a trend is also recovered in a flux-flux plot as well. We also stress here that the derived line for AGNs is itself an upper limit since most of the data points used to fit this correlation are upper limits.
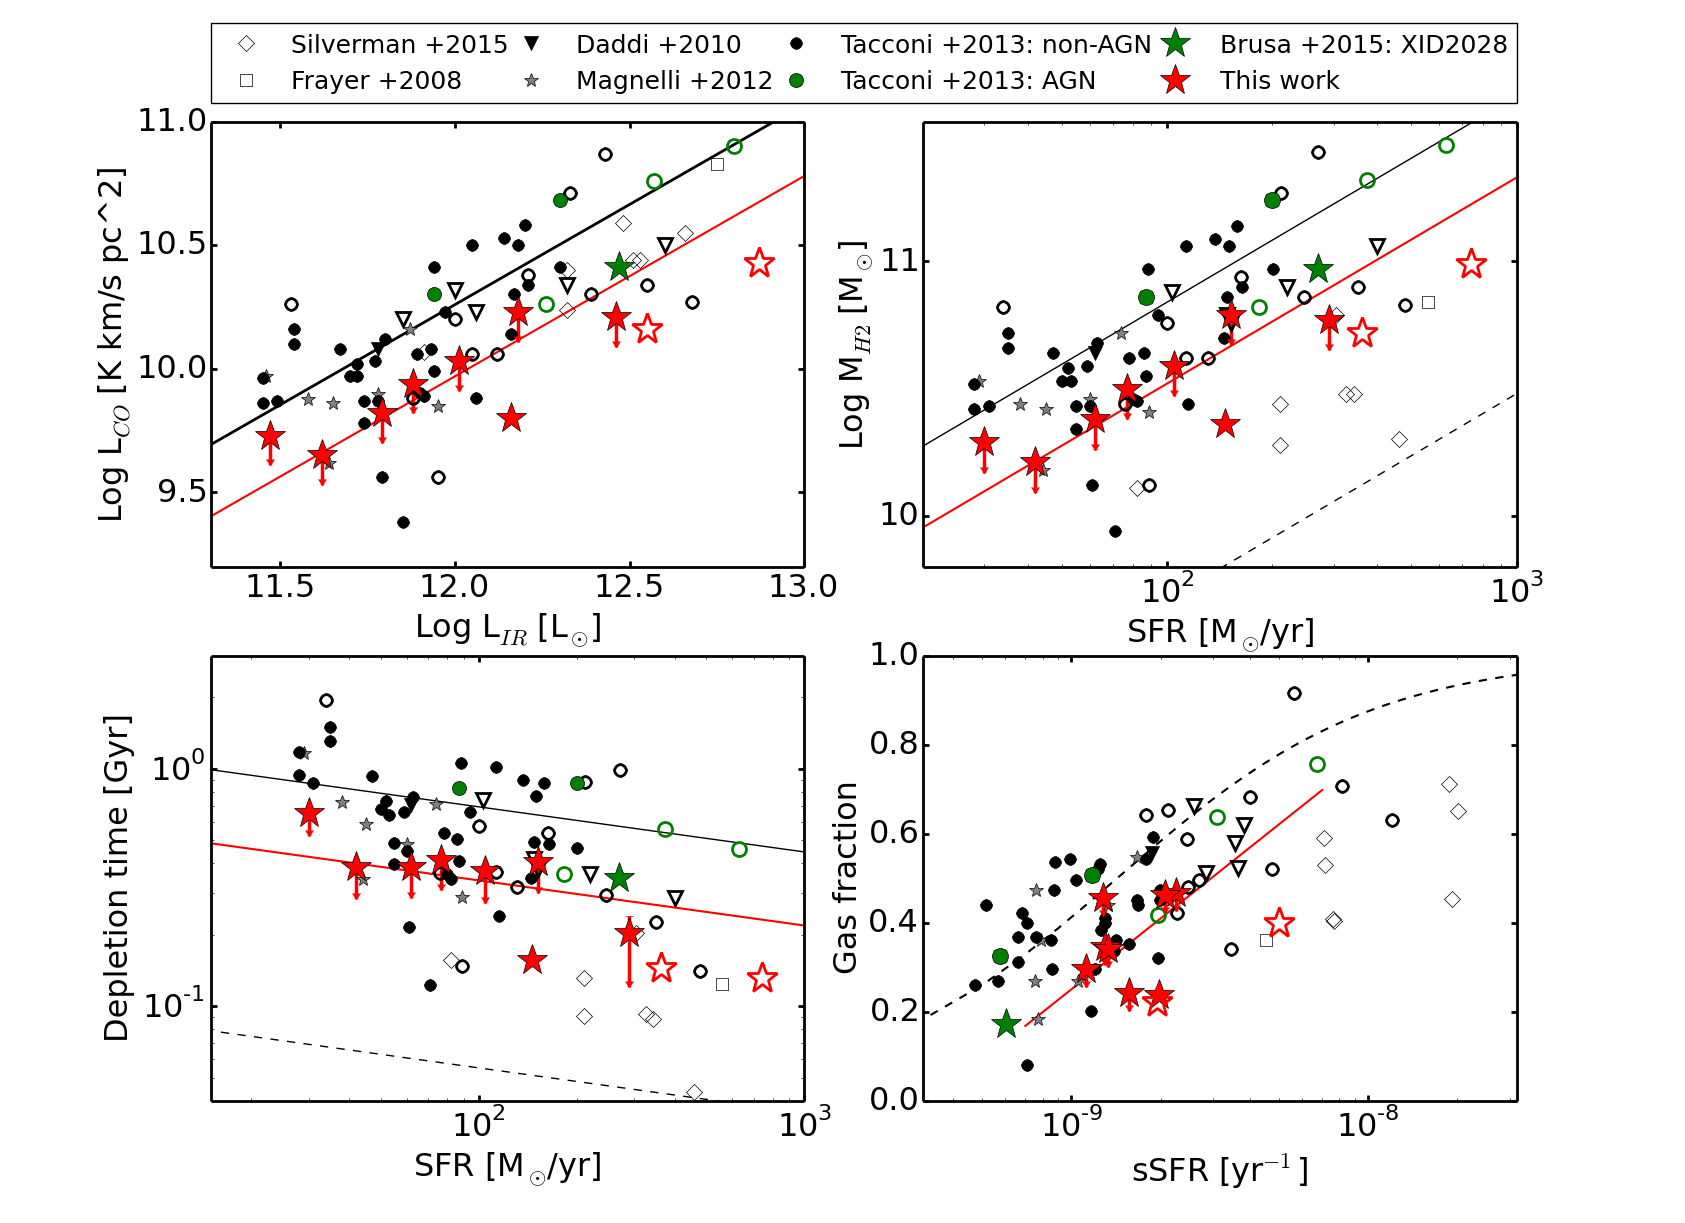
The difference in the properties of the two sets of galaxies (non-AGN star forming and the starburst galaxies) becomes apparent once we convert these CO luminosities into gas masses and this is shown in Fig. 5, top right panel. The solid and the dotted lines are the average correlations obtained by Sargent et al. (2014), where the dotted line indicates the limiting locus for starbursts which are strong outliers to the MS and have among the largest star formation efficiencies (SFEs). This plot is an ideal indicator of the SFE. The galaxies that follow a lower correlation, such as the starburst galaxies along the dotted black line, have a higher SFE compared to those following a higher correlation, such as the MS galaxies along the solid black line. This is because for the same molecular gas mass, there is more star formation in the SB galaxies compared to MS galaxies. Our AGN host galaxies on the MS are consistently below the average MS line in the plane indicating that the star formation efficiency of the AGN host galaxies is higher than for the non-AGN population. We derive the functional form for the best fit relation for the AGNs in the MS (taking the upper limits as detections):
| (6) |
The intercept for this equation is a factor of 2 lower than the average line for the MS galaxies (see Sargent et al. (2014) for the best fit relation for main sequence non-AGN galaxies). These values thus support our assertion above that AGN host galaxies tend to have a higher SFE compared to M∗ and SFR matched non-AGN galaxies. We note here that the value adopted for our galaxies is the same as for the main sequence non-AGN population used in this study. In a scenario where hard ionizing radiation from AGNs could destroy these molecules, conversion factor would be lower for AGN host galaxies and the estimated gas mass would decrease even further. This argument is further strengthened once we take into account the single detection we have from ALMA which is well below the locus of the MS galaxies. In fact, this detection falls in the region of the starburst galaxies in the plane at this redshift. The AGN host galaxies which are starbursts also fall into the same region which confirms previous results that starbursting AGN hosts have properties similar to those of the non-AGN starburst population.
Lower gas mass for a given star formation rate is indicative of higher SFE as discussed above and lower depletion time scales as well. This is confirmed by the depletion time scale () vs. SFR plot in the lower left panel of Fig. 5. Starbursts tend to occupy the region with lower gas depletion time scales as they are believed to be efficient in converting the available cold gas content into stars, while in the case of normal star forming galaxies, they occupy a region of higher (the exact functional forms of the two lines are given in Sargent et al. (2014)). The best fit relation between and SFR for our AGN sample in the MS is:
| (7) |
Our AGN sample on the MS have depletion time scales at least a factor of 2 lower than those of the main sequence non-AGN galaxies of similar stellar mass.
Finally, for each one of our AGNs we derived the gas fraction, and plotted it against the specific SFR (sSFR) as shown in the lower right panel of Fig. 5. The gas fraction rather than the total gas content is the most appropriate parameter to use in order to compare the gas content of galaxies independently of their stellar masses. The best fit correlation for AGN host galaxies can be described using the following equation:
| (8) |
This is shown by the solid red line in Fig. 5, lower right panel and the relation is valid for . The black dashed line in the same panel shows the best fit function for MS galaxies adapted from Tacconi et al. (2013). Although some of our data points fall within the general population of the MS galaxies, the average line fitting function for AGNs show gas fractions less by a factor of at least 2 compared to the MS galaxies. Hence, together with a higher SFE, these moderate luminosity AGN host galaxies also show a lower gas fraction.
5 Discussion
The observation of high SFE, lower gas depletion time scales and lower gas fractions in our AGN sample may be an indirect evidence of AGN feedback on the host galaxy. However with the current data we cannot distinguish between a positive or a negative feedback scenario (in other words, we cannot tell if the AGNs are shifted right or down in Fig. 5).
Negative Feedback: As mentioned earlier, AGNs are known to host powerful outflows within their host galaxies. These outflows may drive the gas away from the galaxy, hence preventing further star formation without affecting the current star formation rate. As an example, for XID2028, it has been shown from observations with SINFONI (Cresci et al., 2015b) that this galaxy hosts a powerful outflow traced by the ionized gas. The PdBI molecular gas observation for this object using CO(3-2) emission line is shown by the green star in all the plots (Brusa et al., 2015b). Similar to the properties of our AGN sample, this target seems to have a higher SFE, lower depletion time scale and lower gas fraction compared to the “average” best fit functions of the MS galaxies. A confirmation of the depleted gas content in XID2028 comes from the molecular gas mass measurements obtained from the dust mass, which is a factor of 2 lower than the values obtained assuming , supporting the hypothesis that the outflow observed in the ionized gas phase may be depleting the cold molecular gas in the host galaxy.
To prove the presence of on-going outflows in our sample, we will need deeper observations in the sub-mm and near infrared regime to trace the molecular and ionized gas phase respectively. The presence of molecular gas observations coupled with the outflow power estimates in such a sample will tell us whether there is a relation between the outflow power and the available molecular gas in the host galaxy.
Positive feedback: An alternative scenario is that the AGN could in fact enhance the star formation as well which would result in an increase in the SFE of the host galaxies. Incidences of such positive AGN feedback have been reported in literature (e.g. Croft et al., 2006; Silk, 2013; Gabor & Bournaud, 2014; Cresci et al., 2015a) and it is believed that the star formation is triggered in the pressurized medium as the outflows shock against the surrounding ISM. The effects of positive feedback could be investigated with high resolution 0.1" continuum and CO imaging, coupled with similar resolution star formation maps.
Change in gas phase due to AGN: If the outflows are not powerful enough to expel the gas, the strong ionizing radiation from AGNs might also have the ability to change the status of the gas by either destroying the molecules or ionizing them. This could be observed in other wavebands of the electromagnetic spectrum. Thus, a multi-wavelength approach is fundamental to understand the observations of the AGN sample presented in this paper.
Starburst followed by an AGN phase: Lastly, the current observations would also be consistent with a starburst episode followed by an AGN phase (Bergvall et al., 2016) and we might happen to catch the targets in the latter phase. An insight into the star formation history of the AGN sample might give us a clue about the observed correlations.
Finally it is worth noting that the AGN sample from Tacconi et al. (2013) does not show any remarkable difference in its molecular gas properties from those of the non-AGN population at odds with our sample and the target from Brusa et al. (2015a). For example, in Fig. 5, lower right panel, the gas fraction of the Tacconi et al. (2013) AGN sample fall almost on (or a bit above) the MS line as while our sample falls below this MS line by a factor on average. The main difference between our AGN and the AGN sample from Tacconi et al. (2013) is that our AGN are on average brighter ( erg/s) than the PHIBBS AGN (i.e. the Tacconi et al. (2013) AGN) which have X-ray luminosity of erg/s which translates into erg/s. We infer that in the case of our AGNs, the gas might have been depleted by a more powerful AGN feedback due to the higher bolometric luminosities, which are responsible for the observed lower gas fraction.
6 Summary and Conclusions
We have presented the molecular gas mass measurements obtained from ALMA observations of in a representative sample of 10 AGNs, 8 of which lie on the MS of star forming galaxies and 2 are classified as starbursts. Their selection is based on their position with the aim to compare the molecular gas fractions and SFE of these AGN hosts on the MS with a redshift, M∗ and SFR matched sample of non-AGN star forming galaxies. The following points summarize results and conclusions of this work:
-
•
We detect CO emission in 3 out of the 10 AGNs observed with ALMA, C92, C1591 and #226 with a significance of >5, 4 and 3 respectively. The emission line widths are in the range 140-620 km/s. For the rest of the sample, we use 3 upper limits as proxy for CO luminosity for analysis.
-
•
Molecular gas for all the objects has been determined assuming the conventional conversion factor, to be 3.6. For C1591, a starbursting AGN system, the observed CO emission is marginally resolved and we could use dynamical analysis as well to measure the gas mass. The gas mass measured using the dynamical analysis agrees within the errors with that estimated using .
-
•
Using the same conversion factor between CO luminosity and molecular gas mass for the non-AGN comparison sample and the AGN sample,we find that AGN hosts have on average a gas fraction lower by a factor of 2, higher SFR and consequently 2.3 times lower gas depletion time scales compared to non-AGN main sequence galaxies of similar stellar mass and SFR at z1.5. In fact, the AGNs follow a different correlation compared to the non-AGN comparison sample. These differences are significant at the level.
-
•
Our hypothesis is that the gas depletion may be an indirect evidence of the impact of AGN feedback on the host galaxy. Powerful winds from the central source might be sweeping the galaxies clean of molecular gas content and/or enhance star formation in the shocked medium. The AGN radiative field might also change the status of the ISM by heating, ionization and disruption of molecules. Multiwavelength studies of statistical samples, aimed to prove or disprove this scenario are ongoing.
Acknowledgements
We thank G. Popping and M. Bethermin for helpful discussions and suggestions. M. Brusa acknowledges support from the FP7 Career Integration Grant "eEASY: supermassive black holes through cosmic time from current surveys to eROSITA-Euclid Synergies" (CIG 321913). SC acknowledges financial support from the Science and Technology Facilities Council (STFC). CF acknowledges funding from the European Union’s Horizon 2020 research and innovation programme under teh Marie Sklodowska-Curie Grant agreement No 664931. MTS acknowledges support from a Royal Society Leverhulme Trust Senior Research Fellowship (LT150041). This paper makes use of the following ALMA data: ADS/JAO.ALMA#2013.1.00171.S. ALMA is a partnership of ESO (representing its member states), NSF (USA) and NINS (Japan), together with NRC (Canada), NSC and ASIAA (Taiwan), and KASI (Republic of Korea), in cooperation with the Republic of Chile. The Joint ALMA Observatory is operated by ESO, AUI/NRAO and NAOJ.
References
- Alaghband-Zadeh et al. (2013) Alaghband-Zadeh S., et al., 2013, MNRAS, 435, 1493
- Aravena et al. (2008) Aravena M., et al., 2008, A&A, 491, 173
- Arimoto et al. (1996) Arimoto N., Sofue Y., Tsujimoto T., 1996, PASJ, 48, 275
- Bauermeister et al. (2013) Bauermeister A., et al., 2013, ApJ, 768, 132
- Bergvall et al. (2016) Bergvall N., Marquart T., Way M. J., Blomqvist A., Holst E., Östlin G., Zackrisson E., 2016, A&A, 587, A72
- Berta et al. (2013) Berta S., et al., 2013, A&A, 551, A100
- Bolatto et al. (2013) Bolatto A. D., Wolfire M., Leroy A. K., 2013, ARA&A, 51, 207
- Bongiorno et al. (2012) Bongiorno A., et al., 2012, MNRAS, 427, 3103
- Bonzini et al. (2013) Bonzini M., Padovani P., Mainieri V., Kellermann K. I., Miller N., Rosati P., Tozzi P., Vattakunnel S., 2013, MNRAS, 436, 3759
- Bonzini et al. (2015) Bonzini M., et al., 2015, MNRAS, 453, 1079
- Bothwell et al. (2013) Bothwell M. S., et al., 2013, MNRAS, 429, 3047
- Brusa et al. (2010) Brusa M., et al., 2010, ApJ, 716, 348
- Brusa et al. (2015a) Brusa M., et al., 2015a, MNRAS, 446, 2394
- Brusa et al. (2015b) Brusa M., et al., 2015b, A&A, 578, A11
- Cano-Díaz et al. (2012) Cano-Díaz M., Maiolino R., Marconi A., Netzer H., Shemmer O., Cresci G., 2012, A&A, 537, L8
- Carilli & Walter (2013) Carilli C. L., Walter F., 2013, ARA&A, 51, 105
- Carilli et al. (2010) Carilli C. L., et al., 2010, ApJ, 714, 1407
- Carniani et al. (2016) Carniani S., et al., 2016, A&A, 591, A28
- Civano et al. (2012) Civano F., et al., 2012, ApJS, 201, 30
- Cresci et al. (2015a) Cresci G., et al., 2015a, A&A, 582, A63
- Cresci et al. (2015b) Cresci G., et al., 2015b, ApJ, 799, 82
- Croft et al. (2006) Croft S., et al., 2006, ApJ, 647, 1040
- Daddi et al. (2007) Daddi E., et al., 2007, ApJ, 670, 156
- Daddi et al. (2010) Daddi E., et al., 2010, ApJ, 713, 686
- Davis et al. (2011) Davis T. A., et al., 2011, MNRAS, 417, 882
- Elbaz et al. (2007) Elbaz D., et al., 2007, A&A, 468, 33
- Engel et al. (2010) Engel H., et al., 2010, ApJ, 724, 233
- Fabian (2012) Fabian A. C., 2012, ARA&A, 50, 455
- Feruglio et al. (2014) Feruglio C., et al., 2014, A&A, 565, A91
- Frayer et al. (2008) Frayer D. T., et al., 2008, ApJ, 680, L21
- Gabor & Bournaud (2014) Gabor J. M., Bournaud F., 2014, MNRAS, 441, 1615
- Gao & Solomon (2004) Gao Y., Solomon P. M., 2004, ApJ, 606, 271
- Geach et al. (2011) Geach J. E., Smail I., Moran S. M., MacArthur L. A., Lagos C. d. P., Edge A. C., 2011, ApJ, 730, L19
- Genzel et al. (2010) Genzel R., et al., 2010, MNRAS, 407, 2091
- Genzel et al. (2012) Genzel R., et al., 2012, ApJ, 746, 69
- Genzel et al. (2015) Genzel R., et al., 2015, ApJ, 800, 20
- Greve et al. (2005) Greve T. R., et al., 2005, MNRAS, 359, 1165
- Gullberg et al. (2015) Gullberg B., et al., 2015, MNRAS, 449, 2883
- Harrison et al. (2012) Harrison C. M., et al., 2012, MNRAS, 426, 1073
- Heyer & Dame (2015) Heyer M., Dame T. M., 2015, ARA&A, 53, 583
- Hodge et al. (2012) Hodge J. A., Carilli C. L., Walter F., de Blok W. J. G., Riechers D., Daddi E., Lentati L., 2012, ApJ, 760, 11
- Hunt et al. (2015) Hunt L. K., et al., 2015, A&A, 583, A114
- Kakkad et al. (2016) Kakkad D., et al., 2016, A&A, 592, A148
- Kashino et al. (2013) Kashino D., et al., 2013, ApJ, 777, L8
- Kennicutt (1998) Kennicutt Jr. R. C., 1998, ARA&A, 36, 189
- Lehmer et al. (2005) Lehmer B. D., et al., 2005, ApJS, 161, 21
- Leung & Riechers (2016) Leung T. K. D., Riechers D. A., 2016, ApJ, 818, 196
- Lilly et al. (1996) Lilly S. J., Le Fevre O., Hammer F., Crampton D., 1996, ApJ, 460, L1
- Lilly et al. (2007) Lilly S. J., et al., 2007, ApJS, 172, 70
- Lusso et al. (2011) Lusso E., et al., 2011, A&A, 534, A110
- Madau & Dickinson (2014) Madau P., Dickinson M., 2014, ARA&A, 52, 415
- Magdis et al. (2012) Magdis G. E., et al., 2012, ApJ, 758, L9
- Magnelli et al. (2012) Magnelli B., et al., 2012, A&A, 539, A155
- Magnelli et al. (2013) Magnelli B., et al., 2013, A&A, 553, A132
- Mainieri et al. (2005) Mainieri V., et al., 2005, A&A, 437, 805
- Maiolino et al. (2015) Maiolino R., et al., 2015, MNRAS, 452, 54
- Markwardt (2012) Markwardt C., 2012, MPFIT: Robust non-linear least squares curve fitting, Astrophysics Source Code Library (ascl:1208.019)
- Mullaney et al. (2012) Mullaney J. R., et al., 2012, MNRAS, 419, 95
- Mullaney et al. (2015) Mullaney J. R., et al., 2015, MNRAS, 453, L83
- Nandra et al. (2015) Nandra K., et al., 2015, ApJS, 220, 10
- Neeleman et al. (2016) Neeleman M., Prochaska J. X., Ribaudo J., Lehner N., Howk J. C., Rafelski M., Kanekar N., 2016, ApJ, 818, 113
- Noeske et al. (2007) Noeske K. G., et al., 2007, ApJ, 660, L43
- Pannella et al. (2009) Pannella M., et al., 2009, ApJ, 698, L116
- Perna et al. (2015) Perna M., et al., 2015, A&A, 574, A82
- Pizagno et al. (2005) Pizagno J., et al., 2005, ApJ, 633, 844
- Polletta et al. (2011) Polletta M., Nesvadba N. P. H., Neri R., Omont A., Berta S., Bergeron J., 2011, A&A, 533, A20
- Renzini & Peng (2015) Renzini A., Peng Y.-j., 2015, ApJ, 801, L29
- Riechers (2011) Riechers D. A., 2011, ApJ, 730, 108
- Rodighiero et al. (2014) Rodighiero G., et al., 2014, MNRAS, 443, 19
- Rosario et al. (2012) Rosario D. J., et al., 2012, A&A, 545, A45
- Saintonge et al. (2012) Saintonge A., et al., 2012, ApJ, 758, 73
- Saintonge et al. (2013) Saintonge A., et al., 2013, ApJ, 778, 2
- Salvato et al. (2011) Salvato M., et al., 2011, ApJ, 742, 61
- Sargent et al. (2014) Sargent M. T., et al., 2014, ApJ, 793, 19
- Schreiber et al. (2015) Schreiber C., et al., 2015, A&A, 575, A74
- Shankar et al. (2009) Shankar F., Weinberg D. H., Miralda-Escudé J., 2009, ApJ, 690, 20
- Sharon et al. (2016) Sharon C. E., Riechers D. A., Hodge J., Carilli C. L., Walter F., Weiß A., Knudsen K. K., Wagg J., 2016, ApJ, 827, 18
- Silk (2013) Silk J., 2013, ApJ, 772, 112
- Silk & Mamon (2012) Silk J., Mamon G. A., 2012, Research in Astronomy and Astrophysics, 12, 917
- Silverman et al. (2015) Silverman J. D., et al., 2015, ApJ, 812, L23
- Solomon & Vanden Bout (2005) Solomon P. M., Vanden Bout P. A., 2005, ARA&A, 43, 677
- Speagle et al. (2014) Speagle J. S., Steinhardt C. L., Capak P. L., Silverman J. D., 2014, ApJS, 214, 15
- Stefan et al. (2015) Stefan I. I., et al., 2015, MNRAS, 451, 1713
- Szokoly et al. (2004) Szokoly G. P., et al., 2004, ApJS, 155, 271
- Tacconi et al. (2010) Tacconi L. J., et al., 2010, Nature, 463, 781
- Tacconi et al. (2013) Tacconi L. J., et al., 2013, ApJ, 768, 74
- Tan et al. (2014) Tan Q., et al., 2014, A&A, 569, A98
- Tozzi & Norman (2001) Tozzi P., Norman C., 2001, ApJ, 546, 63
- Villar-Martín et al. (2013) Villar-Martín M., et al., 2013, MNRAS, 434, 978
- Walter et al. (2016) Walter F., et al., 2016, preprint, (arXiv:1607.06768)
- Whitaker et al. (2012) Whitaker K. E., van Dokkum P. G., Brammer G., Franx M., 2012, ApJ, 754, L29
- Wylezalek & Zakamska (2016) Wylezalek D., Zakamska N. L., 2016, MNRAS, 461, 3724
- Xue et al. (2011) Xue Y. Q., et al., 2011, ApJS, 195, 10
- Zakamska et al. (2016) Zakamska N. L., et al., 2016, MNRAS, 459, 3144