Accurate sub-millimetre rest-frequencies
for HOCO+ and DOCO+ ions
Abstract
Context. HOCO+ is a polar molecule that represents a useful proxy for its parent molecule CO2, which is not directly observable in the cold interstellar medium. This cation has been detected towards several lines of sight, including massive star forming regions, protostars, and cold cores. Despite the obvious astrochemical relevance, protonated CO2 and its deuterated variant, DOCO+, still lack an accurate spectroscopic characterisation.
Aims. The aim of this work is to extend the study of the ground-state pure rotational spectra of HOCO+ and DOCO+ well into the sub-millimetre region.
Methods. Ground-state transitions have been recorded in the laboratory using a frequency-modulation absorption spectrometer equipped with a free-space glow-discharge cell. The ions were produced in a low-density, magnetically-confined plasma generated in a suitable gas mixture. The ground-state spectra of HOCO+ and DOCO+ have been investigated in the 213–967 GHz frequency range, with the detection of 94 new rotational transitions. Additionally, 46 line positions taken from the literature have been accurately remeasured.
Results. The newly-measured lines have significantly enlarged the available data sets for HOCO+ and DOCO+, thus enabling the determination of highly accurate rotational and centrifugal distortion parameters. Our analysis showed that all HOCO+ lines with are perturbed by a ro-vibrational interaction that couples the ground state with the vibrationally-excited state. This resonance has been explicitly treated in the analysis in order to obtain molecular constants with clear physical meaning.
Conclusions. The improved sets of spectroscopic parameters provide enhanced lists of very accurate, sub-millimetre rest-frequencies of HOCO+ and DOCO+ for astrophysical applications. These new data challenges a recent tentative identification of DOCO+ toward a pre-stellar core.
Key Words.:
Molecular data – Methods: laboratory: molecular – Techniques: spectroscopic – Radio lines: ISM1 Introduction
Protonated ions were first suggested as proxies for important interstellar molecules by Herbst et al. (1977), shortly after the first detection of charged polyatomic species in space (HCO+, Buhl & Snyder 1970; N2H+, Turner 1974). These first pioneering studies demonstrated that ion–molecule reactions must occur in the interstellar medium (ISM), and are capable of generating ionic forms of non-polar molecules, such as N2, C2, CO2, and HCCH. These species are likely to be present to a large extent in the dense gas, but they escape radio-telescope detection owing to the lack of rotational spectra.
Carbon dioxide (CO2) is widespread in space. It is abundant in planetary atmospheres, comets, and especially interstellar ices, where it has been extensively detected in these latter environments by ISO and Spitzer telescopes towards several lines of sight (e.g., Whittet et al., 1998; Bergin et al., 2005). In the solid phase, the CO2:H2O ratio has been observed to vary in the range of 0.15–0.5 in molecular clouds and protostars (e.g., Boogert et al., 2015; Whittet et al., 2009; Öberg et al., 2011). Since the abundance of CO2 has been observed to be lower in the gas phase by a factor of 100 (van Dishoeck et al., 1996; Boonman et al., 2003), its formation is thought to proceed on dust grains, via UV- or cosmic-ray-induced processing of a variety of icy mixtures (Ioppolo et al., 2009; Mennella et al., 2006; Pontoppidan et al., 2003; Watanabe & Kouchi, 2002). Nonetheless, speculation on the possible contribution of a gas-phase formation route remains (e.g., Sakai et al., 2008), and the difficulties involved in the direct observation of CO2 in the infrared hinder the clarification of this matter.
Protonated carbon dioxide (HOCO+) provides a useful, indirect way to trace gaseous CO2 in the ISM. Vastel et al. (2016) constrained the CO2 abundance in the L1544 pre-stellar core using an extensive chemical model that considered the following HOCO+ main formation channels:
| (1a) | |||
| (1b) |
| (2) |
At the steady state, they derived an indirect estimate of the [CO2]/[CO] ratio from [HOCO+]/[HCO+]. The assumptions involved in this approach hold for the external layers of dense cloud cores, where CO freeze-out rates are moderate. The same method, in a simplified form (i.e., neglecting reaction (2)), was also adopted by Neill et al. (2014) towards Srg B2(N), and by Sakai et al. (2008) in the Class 0 protostar IRAS 04368+2557 embedded in L1527.
The first laboratory identification of protonated carbon dioxide was accomplished by Bogey et al. (1984), who observed six rotational lines of HOCO+ in the 350–380 GHz frequency range. This work substantiated the tentative interstellar detection proposed by Thaddeus et al. (1981), and an additional, independent, confirmation was provided by the laboratory observation of the ro-vibrational band of HOCO+ (Amano & Tanaka, 1985a, b). Later, Bogey and co-workers published two more papers about laboratory studies in which they enlarged the frequency coverage and extended the study to the isotopic species DOCO+ and HO13CO+ (Bogey et al., 1986, 1988). More recently, the low-lying line of HOCO+ was measured by Ohshima & Endo (1996) using a pulsed-jet Fourier-transform microwave (FTMW) spectrometer.
Despite these considerable experimental efforts, the spectroscopic characterisation of this astrophysically-relevant ion remains not fully satisfactory. Recordings of the pure rotational spectra are indeed restricted to a rather limited frequency range; only a few lines have been measured in the 3 mm band, and the whole spectral region above 420 GHz is completely unexplored. No -type transitions were measured for DOCO+, thus resulting in a poorly determined rotational constant for this isotopic species. Moreover, anomalously large centrifugal distortion effects are present in both HOCO+ and DOCO+. As a result, the line positions of many astronomically important features cannot be computed to a desirable accuracy.
For example, the rest frequencies used by Neill et al. (2014) to assign the HOCO+, ladder () observed towards the Galactic centre are affected by 1 uncertainties of 300–400 kHz, as indicated by the JPL line catalogue (Pickett et al., 1998). Also, the tentative detection of DOCO+ in L1544 claimed by Vastel et al. (2016) is based on a reference datum that is not fully reliable: the line position provided by the JPL catalogue is MHz, but a calculation performed using the “best” literature spectroscopic data (Bogey et al., 1988) gives MHz. The resulting 410 kHz discrepancy (1.2 km s-1) therefore hints at possible issues affecting the spectral analysis of DOCO+.
With the aim of providing highly-accurate rest frequencies for astrophysical applications, we have performed a comprehensive laboratory investigation of the pure rotational spectra of HOCO+ and DOCO+. About fifty new lines were recorded for each isotopologue and, in addition, many literature transitions were accurately remeasured, to either refine their frequency positions or to rule out possible misassignments. The measurements presented in this work also extend towards the THz region, thus considerably enlarging the frequency range with respect to previous studies.
The data analysis shows that the HOCO+ spectrum is affected by a ro-vibrational interaction, coupling the ground state with the low-lying vibrationally-excited state. This resonance is characteristic of many quasi-linear molecules, such as HNCO (Niedenhoff et al., 1995b), HNCS (Niedenhoff et al., 1995a), and HN3 (Krakow et al., 1968). In HOCO+, this perturbation produces non-negligible effects for rotational levels having the quantum number greater than 2. A special treatment was adopted to analyse this spectrum in order to retrieve a set of spectroscopic constants with clear physical meaning.
2 Experiments
The spectra described in this work have been recorded with the frequency-modulation (FM) sub-millimetre absorption spectrometer recently developed at the Center for Astrochemical Studies (Max-Planck-Institut für extraterrestrische Physik) in Garching.
The instrument is equipped with a negative glow-discharge cell made of a Pyrex tube (3 m long and 5 cm in diameter) containing two stainless steel, cylindrical hollow electrodes separated by 2 m. The plasma region is cooled by liquid nitrogen circulation and is contained inside a 2 m-long solenoid, which can produce a coaxial magnetic field up to 300 G to enhance the discharge negative column (De Lucia et al., 1983).
The radiation source is an active multiplier chain (Virginia Diodes) that is driven by a synthesizer (Keysight E8257D) operating at centimetre wavelengths. Using a series of frequency multiplication stages, this setup provides continuous coverage across the 82–1100 GHz frequency range. Accurate frequency and phase stabilisation is achieved by providing the synthesizer with a 10 MHz rubidium frequency standard (Stanford Research Systems). A liquid-He-cooled InSb hot electron bolometer (QMC Instr. Ltd.) is used as a detector. FM is achieved by modulating the carrier signal with a sine-wave at a rate of 15 kHz, and then demodulating the detector output at using a digital lock-in amplifier (SRS SR830). In this way, the second derivative of the actual absorption profile is recorded by the computer controlled acquisition system.
HOCO+ and DOCO+ were produced by a DC discharge (5–15 mA, 2 kV) and a 3:1 mixture of CO2 and H2/D2 diluted in a buffer gas of Ar (total pressure 15 Bar). As for other protonated ions, cell cooling is critical to enhance the absorption signals. In the present case, the use of a condensable precursor (CO2) imposes a practical lower limit of K to the cell wall temperature. Also, magnetic plasma confinement by a 200 G field was found to provide the best conditions for the production of the protonated CO2 ion.
3 Results and data analysis
Protonated carbon dioxide is a slightly asymmetric prolate rotor (), with the inertial axis being closely aligned to the slightly bent heavy-atom backbone (), and the hydrogen atom lying on the plane () (Fortenberry et al., 2012). Hence, both - and -type transitions are observable. The electric dipole moment was theoretically computed by (Green et al., 1976) yielding D, and D. Bogey et al. (1988) pointed out that these values might be inaccurate and, indeed, our observations of the intensity ratio between - and -type lines are not in agreement with the above figures. The latest theoretical studies on HOCO+ (Francisco, 1997; Fortenberry et al., 2012) do not report estimates of the dipole moments, thus we have performed an ab initio calculation using the CFOUR software package111See www.cfour.de. At the CCSD(T) level of theory (Raghavachari et al., 1989), and using the cc-pCVQZ basis sets (Woon & Dunning, 1994), it yielded: D, and D. These values give fair agreement ( 30%) with the line intensity ratios observed experimentally.
The absorption profiles of the observed transitions were modelled with the proFFit line profile analysis code (Dore, 2003), in order to extract their central frequency with high accuracy. We adopted a modulated Voigt profile, and the complex component of the Fourier-transformed dipole correlation function (i.e. the dispersion term) was also taken into account to model the line asymmetry produced by the parasitic etalon effect of the absorption cell (i.e., background standing-waves between non-perfectly transmitting windows). The frequency accuracy is estimated to be in the range of 20–50 kHz, depending on the line width, the achieved signal-to-noise ratio (S/N), and the baseline. With a magnetic field applied during the plasma discharge, the ions are produced primarily in the negative column, which is a nearly field-free region. Therefore we assume the Doppler shift caused by the drift velocity of the absorbing species is negligible (see e.g., Tinti et al., 2007).
| observed | o. – c. (fit I) | o. – c. (fit II) | ass. unc. | Ref. | ||||||
|---|---|---|---|---|---|---|---|---|---|---|
| (1) | (2) | (3) | (4) | (5) | (6) | (9) | (10) | (11) | ||
| … | ||||||||||
| 19 | 1 | 19 | 18 | 1 | 18 | B86 | ||||
| 19 | 0 | 19 | 18 | 0 | 18 | B86 | ||||
| 10 | 2 | 9 | 9 | 2 | 8 | TW | ||||
| 10 | 2 | 8 | 9 | 2 | 7 | TW | ||||
| 10 | 1 | 9 | 9 | 1 | 8 | TW | ||||
| 11 | 1 | 11 | 10 | 1 | 10 | TW | ||||
| 11 | 3 | * | 10 | 3 | * | TW | ||||
| … |
3.1 HOCO+
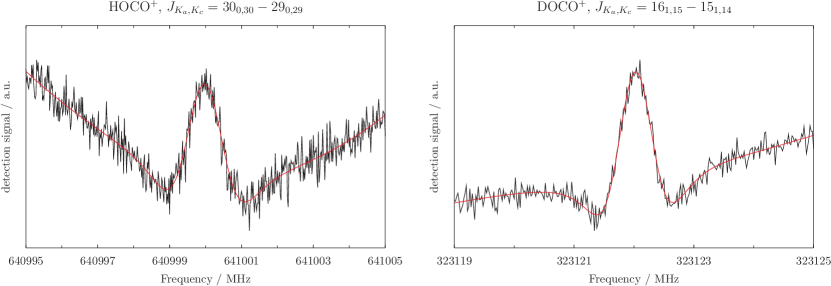
The search for new rotational transitions of HOCO+ was guided by the spectroscopic parameters previously reported by Bogey et al. (1988), thus their assignment was accomplished in a straightforward way. However, at frequencies above 500 GHz, increasingly larger discrepancies ( 500 kHz) were found between observed and predicted line positions. Forty-three new rotational lines were recorded, reaching a maximum quantum number values of 29 and a frequency as high as 967 GHz. These data included 12 -type transitions belonging to the , , and branches. In addition, 18 lines previously reported by Bogey et al. (1986, 1988) were remeasured to check/improve their frequency positions. Figure 1 (left panel) shows the recording of the line of HOCO+ located at ca. 640 GHz, which is the highest frequency reached for -type transitions.
The combined data set of literature and newly-measured lines was fitted employing a -reduced, asymmetric rotor Hamiltonian in its representation (Watson, 1977) using Pickett’s CALPGM programme suite (Pickett, 1991). Statistical weights () were adopted for each -th datum to account for the different measurement precisions. In our measurements, an estimated uncertainty () of 20 kHz is assigned to the -type lines, whereas 50 kHz is assigned to the weaker -type transitions, the latter of which derive from comparatively noisier spectra. For the data taken from the literature, we adopted the assumed uncertainties given in the corresponding papers. The complete list of the analysed rotational transitions is provided as electronic supplementary material at the CDS333http://cdsweb.u-strasbg.fr/. An excerpt is reported in Table 1 for guidance.
The analysis clearly showed that the ground-state spectrum of HOCO+ is perturbed. An anomalous slow convergence of the rotational Hamiltonian had already been noted by Bogey et al. (1986), such that high-order terms were used to achieve a satisfactory fit of the measured frequencies. Similar perturbations have been observed in many quasi-linear molecules, for which HNCO (isoelectronic with HOCO+) serves as a case study (Niedenhoff et al., 1995b). These anomalies reflect the breakdown of the Watson-type asymmetric rotor Hamiltonian because of the accidental degeneracy occurring between ground-state rotational levels and those of a low-lying, totally-symmetric excited state.
We carried out the analysis of the HOCO+ spectrum following two different approaches. The first, simpler analysis was performed by applying a cut-off at . This excluded from the least-squares fit all the lines affected by the resonance, and allowed us to consider the HOCO+ ground state as isolated. The lines were fitted using a single state Hamiltonian, and these results are reported in the first column of Table 2 (referred to as fit I hereafter). This analysis provides a compact set of rotational parameters, including four quartic and two sextic centrifugal distortion constants. Having observed only one subset of -type transitions (), the constant could not be determined reliably, and was thus constrained to the value derived from previous infrared measurements (Amano & Tanaka, 1985b). The and sextic constants were also held fixed at their corresponding theoretically computed values (Fortenberry et al., 2012).
In the second stage of the analysis, the interaction coupling the ground and the states was explicitly treated, and all the available transitions ( up to 5) were included in the least-squares fit. Assumptions for the rotational parameters of the state (actually unobserved) were derived from the ground state constants (, , ) and the theoretically computed vibration-rotation constants from Fortenberry et al. (2012). An optimal fit was achieved by adjusting the same ground-state constants of the previous, simplified analysis, plus the resonance parameters and . The quartic centrifugal distortion constant of the perturbing state was held fixed in the fit, but its value was updated iteratively until a minimum of the root mean square (RMS) deviation was reached. The resulting spectroscopic constants of this analysis are gathered in the second column of Table 2 (referred hereafter to as fit II). Full details of this analysis are given in Appendix A.
| parameter | unit | fit I | fit II | ab initiob |
|---|---|---|---|---|
| ground state | ||||
| MHz | ||||
| MHz | ||||
| MHz | ||||
| kHz | ||||
| MHz | ||||
| MHz | ||||
| kHz | ||||
| kHz | ||||
| Hz | ||||
| Hz | ||||
| kHz | ||||
| MHz | ||||
| MHz | ||||
| MHz | ||||
| MHz | ||||
| kHz | ||||
| MHz | ||||
| MHz | ||||
| kHz | ||||
| kHz | ||||
| Hz | ||||
| Hz | ||||
| kHz | ||||
| MHz | ||||
| cm-1 | ||||
| MHz | ||||
| MHz | ||||
| no. of lines | ||||
-
a
See text for details on fit I and fit II. Values in parentheses represent 1 uncertainties, expressed in units of the last quoted digit.
-
b
Theoretical values computed by Fortenberry et al. (2012).
-
c
Fixed at the value determined by Amano & Tanaka (1985b).
-
d
Fixed at the ab initio value.
-
e
Derived from the ground state value plus ab initio (Fortenberry et al., 2012).
-
f
Adjusted by step-by-step procedure.
3.2 DOCO+
A limited portion of the millimetre spectrum of DOCO+ had been recorded by Bogey et al. (1986), but the quality of the resulting spectral analysis was not completely adequate. Indeed, in a second study, Bogey et al. (1988) had encountered serious difficulties in fitting new low- transitions together with the bulk of the previously measured data. They had thus excluded all the lines from the final, published analysis. This represents a severe shortage for the astronomical utility of this data, as the lines that may be most-detected in the ISM arise from these low energy levels. We have thus re-investigated carefully the rotational spectrum of DOCO+, focusing on low- lines that show predictions errors up to ca. 1 MHz.
Extensive spectral searches had to be performed to identify -type transitions due to the large error associated to the previous determination of the rotational constant. Lines belonging to the and branches were finally assigned at a distance of about 500 MHz from the position computed from the literature data. Ten -type transitions were recorded in total. The final DOCO+ data set comprises 85 lines, covering the frequency range from 120 to 672 GHz, with quantum number spanning values 5–30. The frequency list is provided as electronic supplementary material at the CDS444http://cdsweb.u-strasbg.fr/. Figure 1 (right panel) shows the recording of the line of DOCO+, obtained in about 3.5 min of integration time.
Contrary to the parent isotopologue, the ground-state spectrum of DOCO+ does not show evidence of perturbation. For the deuterated variant, the rotational constant is smaller (14.4 cm-1 compared to 26.2 cm-1 for HOCO+), thus the quasi-degeneracy between the ground and excited state occurs at a higher value of . As a result, the transitions involving low energy levels are essentially unperturbed. The analysis was therefore carried out by considering the ground vibrational state of DOCO+ as isolated, and including in the fit transitions with up to 4. A few, possibly perturbed lines involving showed large deviations and were then excluded from the final data set. We adopted the same weighting scheme described in the previous subsection, where the assumed uncertainties () were set to 20 kHz and 50 kHz for - and -type lines, respectively. For the 3 mm lines previously recorded by Bogey et al. (1988), we retained the error reported by these authors. These fit results are reported in Table 3.
| parameter | unit | experimental | ab initiob |
|---|---|---|---|
| ground state | |||
| MHz | |||
| MHz | |||
| MHz | |||
| kHz | |||
| MHz | |||
| MHz | |||
| kHz | |||
| kHz | |||
| Hz | |||
| Hz | |||
| Hz | |||
| MHz | |||
| no. of lines | |||
-
a
Values in parentheses represent 1 uncertainties expressed in units of the last quoted digit.
-
b
Theoretical values computed by Fortenberry et al. (2012).
-
c
Held fixed.
4 Discussion
The spectral analyses presented here, have been performed on an enlarged and improved data set, and yielded a more precise set of rotational and centrifugal distortion constants for HOCO+ and DOCO+. In comparison to the latest literature data (Bogey et al., 1988), the new spectroscopic constants presented in Tables 2 and 3 exhibit a significant reduction of their standard uncertainties. The improvement is particularly relevant for DOCO+ thanks to the identification of the weaker -type spectrum, such that the precision of its rotational constant has been enhanced by a factor of 104. As a consequence, predictive capabilities at millimetre and sub-millimetre wavelengths have been improved.
Regarding HOCO+, we have presented two different analyses. Fit I, (Table 2, Column 1) includes only lines originating from levels with . Within the precision of our measurements, these transitions are essentially unaffected by the centrifugal distortion resonance that perturbs the ground-state spectrum (see Appendix A), and they can be treated with a standard asymmetric rotor Hamiltonian. This simple solution provides reliable spectral predictions for all the transitions with upper-state energies K, hence it is perfectly suited to serve as a guide for astronomical searches of HOCO+ in the cold ISM.
In fit II, all the experimental data are considered, and the interaction that couples the ground state with the vibrationally-excited state has been treated explicitly (Table 2, Column 2). Here, extensive use of the latest high-level theoretical calculations (Fortenberry et al., 2012) has been made to derive reliable assumptions for those spectroscopic parameters which could not be directly determined from the measurements. Though more complex, fit II implements a more realistic representation of the rotational dynamics of this molecule, and yields a set of spectroscopic constants with clearer physical meaning. Indeed, the anomalously large centrifugal distortion effects noted in the previous investigations (Bogey et al., 1986, 1988) have been effectively accounted for. No octic () or decic () constants were required for the analysis, and the agreement between experimental and ab initio quartic centrifugal distortion constants is reasonably good. On the other hand, the values determined for the and sextic constants should be considered only as effective approximations, since they include spurious resonance contributions not explicitly treated by this analysis. Finally, it is to be noted that fit I and fit II, when limited to lines, yield spectral predictions that are coincident within the computed uncertainties.
New HOCO+ and DOCO+ line catalogues, based on the spectroscopic constants of Table 2 (fit I, only) and Table 3, have been computed and are provided as supplementary data available at the CDS. These data listings include: the uncertainties (calculated taken into account the correlations between spectroscopic constants), the upper-state energies, the line strength factors (), and the Einstein coefficients for spontaneous emission,
| (3) |
where all the quantities are expressed in SI units and the line strengths are obtained by projecting the squared rotation matrix onto the basis set that diagonalises the rotational Hamiltonian (Gordy & Cook, 1984). The computation was performed using D and D. The compilation contains 57 lines for HOCO+ and 72 lines for DOCO+. They are selected in the frequency range 60 GHz 1 THz and applying the cut offs K. The precision of these rest-frequencies is at least , which corresponds to 0.011 km s-1 (or better) in unit of radial velocity.
Our analysis suggests that the line observed in L1544 by Vastel et al. (2016) and tentatively assigned to DOCO+, , cannot actually be attributed to this ion. The observed feature, once red-shifted by the 7.2 km s-1 of L1544, has a rest frequency of MHz, whereas our predicted line position is MHz. This 295 kHz discrepancy corresponds to 0.88 km s-1, which is over twice the average FWHM of the HOCO+ lines detected in the same source. It is thus likely that the line tentatively detected by Vastel et al. (2016) does not belong to DOCO+ and, indeed, these authors stated that this needed confirmation from laboratory measurements.
5 Chemical model
Predictions for the HOCO+ and DOCO+ abundances in L1544 can be derived from the chemical model developed by Sipilä et al. (2015), which considers a static physical structure and an evolving gas-grain chemistry (as described in Sipilä et al. 2016). Table 4 shows the model computed column densities of HOCO+ and DOCO+ for different cloud evolutionary ages averaged over a 30′′ beam. Vastel et al. (2016) found a HOCO+ column density of about cm-2. Comparison with the predicted column densities, shown in Table 4 suggests that the best agreement is found at late evolutionary times. However, since above yr, the model predicts too much CO freeze-out compared to the observations of Caselli et al. (1999), we consider yr as the best agreement time. At this stage, the DOCO+/HOCO+ is about 10% and the predicted DOCO+, main beam brightness temperature is 6 mK (assuming an excitation temperature of 8.5 K, as deduced by Vastel et al. (2016) for their observed HOCO+ line).
| time / yr | / cm-2 | / cm-2 | |
|---|---|---|---|
| 0.042 | |||
| 0.084 | |||
| 0.106 | |||
| 0.086 | |||
| 0.067 |
6 Conclusions
This laboratory study substantially improves the spectroscopic characterisation of the protonated CO2 ion. The spectral region sampled by the measurements has been considerably extended into the sub-millimetre regime, reaching maximum frequencies of 967 GHz for HOCO+, and 672 GHz for DOCO+. In addition, new recordings were obtained for most of the previously reported lines in order to enhance their measurement precision using a sophisticated line profile analysis. Our analysis shows that the line tentatively detected towards the pre-stellar core L1544 cannot be attributed to DOCO+.
Acknowledgements.
The authors wish to thank Mr. Christian Deysenroth for the thorough assistance in the engineering of the molecular spectroscopy laboratory at the MPE/Garching. We are also grateful to Luca Dore for providing the proFFit line profile analysis code.References
- Amano & Tanaka (1985a) Amano, T. & Tanaka, K. 1985a, J. Chem. Phys., 82, 1045
- Amano & Tanaka (1985b) Amano, T. & Tanaka, K. 1985b, J. Chem. Phys., 83, 3721
- Bergin et al. (2005) Bergin, E. A., Melnick, G. J., Gerakines, P. A., Neufeld, D. A., & Whittet, D. C. B. 2005, ApJ, 627, L33
- Bogey et al. (1984) Bogey, M., Demuynck, C., & Destombes, J. L. 1984, A&A, 138, L11
- Bogey et al. (1986) Bogey, M., Demuynck, C., & Destombes, J.-L. 1986, J. Chem. Phys., 84, 10
- Bogey et al. (1988) Bogey, M., Demuynck, C., Destombes, J. L., & Krupnov, A. 1988, J. Mol. Struct., 190, 465
- Boogert et al. (2015) Boogert, A. C. A., Gerakines, P. A., & Whittet, D. C. B. 2015, ARA&A, 53, 541
- Boonman et al. (2003) Boonman, A. M. S., van Dishoeck, E. F., Lahuis, F., & Doty, S. D. 2003, A&A, 399, 1063
- Buhl & Snyder (1970) Buhl, D. & Snyder, L. E. 1970, Nature, 228, 267
- Caselli et al. (1999) Caselli, P., Walmsley, C. M., Tafalla, M., Dore, L., & Myers, P. C. 1999, ApJ, 523, L165
- De Lucia et al. (1983) De Lucia, F. C., Herbst, E., Plummer, G. M., & Blake, G. A. 1983, J. Chem. Phys., 78, 2312
- Dore (2003) Dore, L. 2003, J. Mol. Spectrosc., 221, 93
- Fortenberry et al. (2012) Fortenberry, R. C., Huang, X., Francisco, J. S., Crawford, T. D., & Lee, T. J. 2012, J. Chem. Phys., 136, 234309
- Francisco (1997) Francisco, J. S. 1997, J. Chem. Phys., 107, 9039
- Gordy & Cook (1984) Gordy, W. & Cook, R. L. 1984, Microwave molecular spectra (Wiley, New York)
- Green et al. (1976) Green, S., Schor, H., Siegbahn, P., & Thaddeus, P. 1976, J. Chem. Phys., 17, 479
- Herbst et al. (1977) Herbst, E., Green, S., Thaddeus, P., & Klemperer, W. 1977, ApJ, 215, 503
- Ioppolo et al. (2009) Ioppolo, S., Palumbo, M. E., Baratta, G. A., & Mennella, V. 2009, A&A, 493, 1017
- Krakow et al. (1968) Krakow, B., Lord, R. C., & Neely, G. O. 1968, J. Mol. Spectrosc., 27, 148
- Mennella et al. (2006) Mennella, V., Baratta, G. A., Palumbo, M. E., & Bergin, E. A. 2006, ApJ, 643, 923
- Neill et al. (2014) Neill, J. L., Bergin, E. A., Lis, D. C., et al. 2014, ApJ, 789, 8
- Niedenhoff et al. (1995a) Niedenhoff, M., Winnewisser, G., Yamada, K. M. T., & Belov, S. P. 1995a, J. Mol. Spectrosc., 169, 224
- Niedenhoff et al. (1995b) Niedenhoff, M., Yamada, K. M. T., Belov, S. P., & Winnewisser, G. 1995b, J. Mol. Spectrosc., 174, 151
- Öberg et al. (2011) Öberg, K. I., Boogert, A. C. A., Pontoppidan, K. M., et al. 2011, ApJ, 740, 109
- Ohshima & Endo (1996) Ohshima, Y. & Endo, Y. 1996, Chem. Phys. Lett., 256, 635
- Papoušek & Aliev (1982) Papoušek, D. & Aliev, M. R. 1982, Molecular vibrational-rotational spectra (Elsevier)
- Pickett (1991) Pickett, H. M. 1991, J. Mol. Spectrosc., 148, 371
- Pickett et al. (1998) Pickett, H. M., Poynter, R. L., Cohen, E. A., et al. 1998, J. Quant. Spectrosc. Radiat. Transfer, 60, 883
- Pontoppidan et al. (2003) Pontoppidan, K. M., Fraser, H. J., Dartois, E., et al. 2003, A&A, 408, 981
- Raghavachari et al. (1989) Raghavachari, K., Trucks, G. W., Pople, J. A., & Head-Gordon, M. 1989, Chem. Phys. Lett., 157, 479
- Sakai et al. (2008) Sakai, N., Sakai, T., Aikawa, Y., & Yamamoto, S. 2008, ApJ, 675, L89
- Sipilä et al. (2015) Sipilä, O., Harju, J., Caselli, P., & Schlemmer, S. 2015, A&A, 581, A122
- Sipilä et al. (2016) Sipilä, O., Spezzano, S., & Caselli, P. 2016, A&A, 591, L1
- Thaddeus et al. (1981) Thaddeus, P., Guelin, M., & Linke, R. A. 1981, ApJ, 246, L41
- Tinti et al. (2007) Tinti, F., Bizzocchi, L., Degli Esposti, C., & Dore, L. 2007, ApJ, 669, L113
- Turner (1974) Turner, B. E. 1974, ApJ, 193, L83
- Urban & Yamada (1993) Urban, S. & Yamada, K. M. T. 1993, J. Mol. Spectrosc., 160, 279
- van Dishoeck et al. (1996) van Dishoeck, E. F., Helmich, F. P., de Graauw, T., et al. 1996, A&A, 315, L349
- Vastel et al. (2016) Vastel, C., Ceccarelli, C., Lefloch, B., & Bachiller, R. 2016, A&A, 591, L2
- Watanabe & Kouchi (2002) Watanabe, N. & Kouchi, A. 2002, ApJ, 567, 651
- Watson (1977) Watson, J. K. G. 1977, in Vibrational Spectra and Structure, ed. J. Durig, Vol. 6 (Elsevier, Amsterdam), 1–89
- Whittet et al. (2009) Whittet, D. C. B., Cook, A. M., Chiar, J. E., et al. 2009, ApJ, 695, 94
- Whittet et al. (1998) Whittet, D. C. B., Gerakines, P. A., Tielens, A. G. G. M., et al. 1998, ApJ, 498, L159
- Woon & Dunning (1994) Woon, D. E. & Dunning, T. H. 1994, J. Chem. Phys., 100, 2975
- Yamada (1980) Yamada, K. M. T. 1980, J. Mol. Spectrosc., 81, 139
Appendix A Analysis of the ground state interaction
The perturbation that affects the ground-state spectrum of HOCO+ is a common feature of quasi-linear molecules, and reflects a breakdown of the Watson-type asymmetric rotor Hamiltonian caused by accidental rotational level degeneracies. It was first described by Yamada (1980), and the theory has been treated in particular detail by Urban & Yamada (1993).
Due to the small component of the moment of inertia, levels of the ground state can become close in energy with the levels of a low-lying, totally-symmetric vibrationally-excited state. These levels can be coupled by the term (i.e. the centrifugal distortion term) of the molecular Hamiltonian defined as:
| (4) |
where the notation represents the anti-commutator, the sum runs over the totally-symmetric vibrational states, and refers to the principal axis plane where the molecule lies.
In HOCO+, the closest totally-symmetric () state is the , which is located ca. 536 cm-1 above the ground state (Fortenberry et al. 2012). Therefore, given the magnitude of the rotational constant at cm-1, its rotational levels are crossed by the ground state ones at . While the transitions are expected to show the largest deviations around this value of , significant contributions are present already at as sizeable centrifugal distortion effects.
Substitution of to represent the normal mode thus reduces Eq. (4) to
| (5) |
where is the harmonic frequency, and is the adimensional rotational derivative relative to the principal axes (Papoušek & Aliev 1982). In practice, the treatment of this resonance is accomplished by fitting the empirical parameters that multiply the rotational operator . This parameter has the form:
| (6) |
A full analysis of this kind of ro-vibrational interaction requires, in principle, measurements of perturbed lines belonging to both interacting states. For our study of HOCO+, this approach is not feasible due to the lack of experimental data for the perturbing state. Nonetheless, one can use the results of the theoretical study of Fortenberry et al. (2012) to derive reasonable assumptions for the missing data. For this case, the rotational constants were computed from the ground state values of , and the relevant ab initio vibration-rotation interaction constants (). For the pure vibrational energy difference between the ground and state, we used the estimate of that includes quartic anharmonicity. Finally, all five quartic and four sextic centrifugal distortion constants were assumed equal to the theoretically computed equilibrium values. All these parameters were held fixed in the least-squares analysis of the ground state lines, in which we adjusted the same set of ground state parameters from fit I, with the addition of the resonance parameter and its centrifugal correction . By adopting this scheme, it was possible to reproduce the measured transitions for without the need of additional high-order centrifugal distortion terms. The fit was finally optimised by adjusting the constants of the states through a step-by-step procedure until the root-mean-square deviation was minimised.
The determination of the value of (see Table 2, fit II) provides also an estimation of the magnitude of the adimensional resonance parameter, . Using the theoretical value (535.6 cm-1, Fortenberry et al. 2012), we find . This value is in fair agreement to those of the isoelectronic molecules H2CCO, H2CNN (, Urban & Yamada 1993), and HNCO (, Niedenhoff et al. 1995b).