HALOGAS Observations of NGC 4559: Anomalous and Extra-Planar Hi and its Relation to Star Formation
Abstract
We use new deep 21 cm Hi observations of the moderately inclined galaxy NGC 4559 in the HALOGAS survey to investigate the properties of extra-planar gas. We use TiRiFiC to construct simulated data cubes to match the Hi observations. We find that a thick disk component of scale height , characterized by a negative vertical gradient in its rotation velocity (lag) of km s-1 kpc-1 is an adequate fit to extra-planar gas features. The tilted ring models also present evidence for a decrease in the magnitude of the lag outside of , and a radial inflow of km s-1. We extracted lagging extra-planar gas through Gaussian velocity profile fitting. From both the 3D models and and extraction analyses we conclude that of the total Hi mass is extra-planar. Most of the extra-planar gas is spatially coincident with regions of star formation in spiral arms, as traced by H and GALEX FUV images, so it is likely due to star formation processes driving a galactic fountain. We also find the signature of a filament of a kinematically “forbidden” Hi, containing M⊙ of Hi, and discuss its potential relationship to a nearby Hi hole. We discover a previously undetected dwarf galaxy in Hi located ( kpc) from the center of NGC 4559, containing M⊙. This dwarf has counterpart sources in SDSS with spectra typical of Hii regions, and we conclude it is two merging blue compact dwarf galaxies.
1 Introduction
Substantial reservoirs of material have been documented to exist outside of the plane of disk galaxies (Putman et al., 2012). This extra-planar material has been found at multiple wavelengths and emission sources, including X-rays (Tüllmann et al., 2006), dust (Howk & Savage, 1999), H (Rossa & Dettmar, 2003), and Hi (Fraternali et al., 2002; Oosterloo et al., 2007; Heald et al., 2011), indicating gas over a wide range in temperatures and densities. Extra-planar material is likely an excellent probe of the effects spiral galaxies have on their environments, and vice versa.
It is possible that extra-planar matter could have originally been a part of the disk of the underlying galaxy, but was expelled from the disk through various energetic processes, such as supernova explosions or stellar winds from massive stars. This material could then expand, and rain back down onto the galaxy after cooling. This process is referred to as the galactic fountain mechanism (Shapiro & Field, 1976). The rotation velocity of this material about the galactic center is expected to decrease with distance from the plane (Bregman, 1980). This reduction in rotation velocity is generally referred to as a “lag”, and is a signature of extra-planar matter. However, observations of extra-planar gas show lag magnitudes that are larger than could be reproduced with ballistic models, implying that additional mechanisms are needed to explain the behavior of this material (Collins et al., 2002; Fraternali & Binney, 2006). Marinacci et al. (2011) postulated that this extra interaction could be with a hot, but slowly rotating corona of gas already residing above the disks of galaxies. Alternately, a study by Benjamin (2002) using a hydrostatic disk model finds that pressure gradients or magnetic tension could also play a part in setting the magnitude of observed lags.
Observationally, lagging gas can be found in both edge-on and inclined galaxies. In edge-on situations, one can directly measure the vertical extent and lag in the rotational velocities of the extra-planar gas. In moderately inclined galaxies, the disentangling of extra-planar gas from disk gas is more difficult, but is possible if a detectable lag exists, as in Fraternali et al. (2002); Barbieri et al. (2005); Boomsma et al. (2008). Additionally, in such galaxies the connection with star formation across the disks is easier to establish.
The Westerbork Hydrogen Accretion in LOcal GAlaxieS (HALOGAS) survey (Heald et al., 2011) targets 22 nearby moderately inclined and edge-on spiral galaxies for deep 21 cm observations using the Westerbork Synthesis Radio Telescope (WSRT). This survey has increased the sample of nearby galaxies for which extra-planar gas can be characterized, and one of its goals is to search for a connection between extra-planar Hi and star formation, and externally originating Hi with galactic fountain gas. In this paper we present a detailed analysis of the HALOGAS data cube for the moderately inclined spiral NGC 4559. The Hubble type of the galaxy cited in Heald et al. (2011) is SABcd, though a kinematic influence on the Hi from a bar is not apparent. The adopted distance to the galaxy, Mpc, was obtained through the median of all Tully-Fisher distances.
| Parameter | Value |
|---|---|
| Hubble Type | SABcd |
| Adopted Distance | 7.9 Mpc ( pc) |
| km s-1 | |
| Total Mass (Virial) | M⊙ |
| Parameter | Smoothed Cube | Full Resolution Cube |
|---|---|---|
| Synthesized beam FWHM | ||
| Conversion Factor | K mJy-1 | K mJy-1 |
| Velocity resolution | km s-1 | km s-1 |
| RMS noise per channel | mJy beam-1; K | mJy beam-1; K |
| Minimum Detectable Column Density () | atoms cm-2 | atoms cm-2 |
A previous Hi study by Barbieri et al. (2005) (hereafter, B05) revealed many interesting details about the gas in NGC 4559. The study found evidence of M⊙ of extra-planar gas with a scale height of kpc, rotating km s-1 slower than the uniform thin disk of Hi. The extra-planar gas was found to be kinematically and spatially regular throughout the galaxy. Though accretion from the intergalactic medium (IGM) could not be ruled out, the regular extent of extra-planar gas suggests it is likely due to a widespread phenomenon, such as star formation across the disk. B05 used 3-D tilted ring models to model the extra-planar gas, where the thick disk had a separate rotation curve from the thin disk. We build upon this result by constraining the magnitude of vertical lag, rather than computing a separate rotation curve for the extra-planar gas. B05 also found evidence for a large Hi hole at , that would require M⊙ of Hi to fill. They determined the Hi distribution to be highly asymmetric between the approaching and receding halves of the galaxy. Interestingly, B05 also found evidence for a stream of gas located at “forbidden” velocity in the major axis position-velocity diagram, near the center of the galaxy, which they postulate to be associated with the aforementioned Hi hole. We further the discussion on the possible origins of this forbidden velocity feature and its possible relation to the hole.
The aim of this work is to expand upon the analysis done by B05 using the more sensitive HALOGAS observations of the same galaxy, together with ancillary H and GALEX FUV observations as tracers of star formation activity. We present the data in Sections 2 and 3, explore three-dimensional tilted ring models to characterize the presence of extra-planar gas in Section 4, and determine the mass and relation to star formation of the extra-planar gas in Section 5. In the remainder of Section 5 we further characterize the forbidden gas feature discovered in B05 and discuss its potential origins and connection to the nearby Hi hole. Section 6 discusses a new detection of Hi in a nearby dwarf companion galaxy, while Section 7 concludes the paper with a discussion of the results.
2 Data Acquisition and Reduction
A brief overview of the data collection and reduction process is included. We refer the reader to Heald et al. (2011) for a comprehensive description.
We used the HALOGAS survey observations of NGC 4559, taken in the Maxi-short WSRT configuration, with baselines ranging from 36 m to 2.7 km to maximize sensitivity to faint, extended emission. Nine of the ten fixed antennas were used with a regular spacing of 144m. The total bandwidth of 10 MHz was split into 1024 channels (2.06 km s-1 per channel), with two linear polarizations. Galaxy observations spanned 10 12 hr between January and May 2011.
We used Miriad (Sault et al., 1995) to perform the data reduction. Data properties are included in Table 2. We produced multiple data cubes using a variety of weighting schemes. The cubes were Hanning smoothed to obtain the final velocity resolution of km s-1 per channel, and a beam size of . The rms noise in a single channel of the full-resolution cube is mJy beam-1. The minimum detectable column density ( and km s-1 velocity width) of the full resolution cube is cm-2. The widest field data cube is pixels of size , giving it a field of view of . The galaxy emission is much smaller than that, so we trim the field of view to due to data size considerations.
We note the existence of strong solar interference in the data cube of NGC 4559. The observations of this galaxy were taken in 10 12-hour blocks with time from January through May, 2011. This timeframe was a period of moderately large solar activity. Five out of the ten tracks were taken in May, with hours of exposed sunlight time. Though the angular separation between the galaxy and the Sun was kept as large as possible (), there is still solar interference affecting the short baselines. This solar interference was flagged in problematic baselines and timeframes during the data reduction. The flagging reduced inner uv coverage, which makes sensitivity to extended, faint emission lessened. Furthermore, remaining solar interference artifacts preclude the cleaning of the data cube to reach the deepest possible noise level of the HALOGAS data. We attribute this solar interference as the most likely explanation for the lack of appreciable improvement in sensitivity to extended emission over B05. However, we also note that the rms noise per channel is improved by a factor of over B05, so we have improved point source sensitivity, despite the lack of extended emission sensitivity.
To improve sensitivity to faint, extended emission, we smoothed the original HALOGAS data cube to a beam, making the noise level in a single channel mJy/beam, or K. See Table 2 for details of the beam cube. The cube was primary beam corrected using the Miriad task “linmos” when calculating total Hi mass. We use the cube for all tilted ring modelling. Moment maps were created using the “moments” task within the Groningen Image Processing System (GIPSY; van der Hulst et al. (1992)). Moment maps were created by first smoothing the original cube to , with which masks at the level were produced and applied to the full resolution cube.
GALEX FUV and ground-based H images allow us to investigate in more detail the correlation between the lagging Hi layer and star formation in NGC 4559. The GALEX FUV image from Gil de Paz et al. (2007), and a continuum subtracted H image are included in our analysis. The H image was taken by one of the authors (MP) on March 21, 2012, with the Kitt Peak National Observatory (KPNO) 4-m telescope. The H exposure time was minutes. The mosaic instrument is known to produce artifacts in which bright stars may appear in multiple CCDs. We first removed this crosstalk between CCDs and trimmed the image. The image was bias subtracted, flat fielded with dark sky flats, and stacked from dithered images. The image was then continuum subtracted with an minute exposure -band image taken on the same night. The pixel scale of the H image is per pixel.
3 Hi Mass and Extent of the Hi Disk
We estimate the total Hi mass using the primary beam corrected and masked total Hi map and assume the emission is optically thin. We use the standard conversion to column density, where the beam HPBW major and minor axes, a and b respectively, are in units of arcseconds: N. The total Hi mass obtained from the HALOGAS data cube is in very good agreement with that found in B05 when the same distance is assumed: M⊙ versus M⊙ in B05 using our assumed distance of Mpc. As mentioned in B05, this agrees with alternate and single dish measurements of the mass from Broeils (1992) and Shostak (1975). This shows that the increase in integration time and sensitivity of the HALOGAS observations did not discover a larger amount of Hi that the observations of B05 were not sensitive enough to probe.
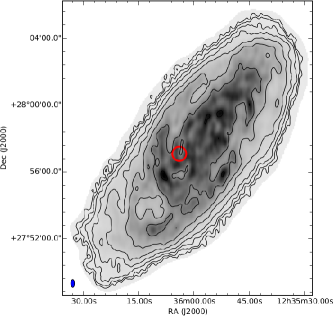
We analyze the extent of the Hi disk and radial profile in the highest resolution data cube with a beam size of . The masked, high resolution cube is integrated over the velocity axis to produce the total Hi image, or integrated Hi map shown in the top panel of Figure 1. We use the GIPSY task ELLINT to create an azimuthally averaged surface brightness profiles for the receding and approaching halves independently. ELLINT is a 2D ring fitting code that uses a least-squares fitting algorithm to constrain the Hi density profile. We provide the moment 0 map as input to ELLINT and fit only the surface brightness profile in the approaching and receding sides, independently. We fix the position angle, inclination, and central position using the quoted values in Table 1 of B05 (, , , and respectively) for the ELLINT calculation of the surface brightness profile. The inclination and position angle were both derived from the morphology and kinematics of the tilted ring model analysis done in B05. The central position was also tabulated by B05 using the kinematics of the Hi data from B05, and represents the kinematical center of NGC 4559. This is then converted into the column density profiles shown also in Figure 1.
The HALOGAS data is somewhat deeper than the data from B05. In Figure 1, the radial extent is similar to that found in B05. We calculate the minimum detectable column density in the smoothed cube to be cm-2 (see Table 2), which is times lower than the minimum detected column density from the cube in B05: cm-2. Also, had B05 smoothed their cube to , this difference would be slightly smaller. Furthermore, when the same distance is assumed, the HALOGAS data produced an extremely similar total Hi mass to B05, implying there is not much extra diffuse Hi in the HALOGAS data that was not captured by B05. If we assume there exists a plateau of Hi at our limiting column density due to the solar RFI ( atoms cm-2) ranging a radial distance between kpc from the center of the galaxy, there would be only M⊙ of extra Hi to detect.
We do not detect a sharp cut-off in Hi but see a rather constant slope in log (column density) down to the last detected point at atoms cm-2. A cutoff might be expected due the intergalactic ionizing radiation field, as was found in M83 (Heald et al., 2016). However, this effect would appear near a column density of a few times atoms cm-2 (e.g. Corbelli & Salpeter (1993), Maloney (1993)), which is near our sensitivity limit. We also note the clear change in Hi profile morphology inside and outside of R25. Within R25 the Hi profile seems clumpy and oscillates, perhaps due to overdensities like spiral arms. Outside of R25 the Hi distribution becomes more uniform.
Given the high theoretical sensitivity of the HALOGAS data cube, it is surprising that the Hi column density radial profile does not reach fainter levels. We suspect this is due to the effects of solar interference on the observations (see Section 2). The deconvolution process of the HALOGAS data is imperfect and cannot fully recover the lack of short-spacings. In particular, we can detect slightly negative and positive residuals due to solar interference on large angular scales in individual cleaned channel maps at the level of atoms cm-2. These residuals change in depth and location between channel maps and the summation of channels will then limit the sensitivity in the integrated Hi map. If these residuals are summed over channels at , this limiting column density would approach atoms cm-2, the lowest column densities we observe in the integrated Hi radial profile. It is likely that a combination of the HALOGAS data with Green Bank Telescope (GBT) observations of NGC 4559 would lead to detection of lower column densities. An effort along these lines is underway using observations with the GBT (Pingel et al. in prep).
4 Tilted Ring Models
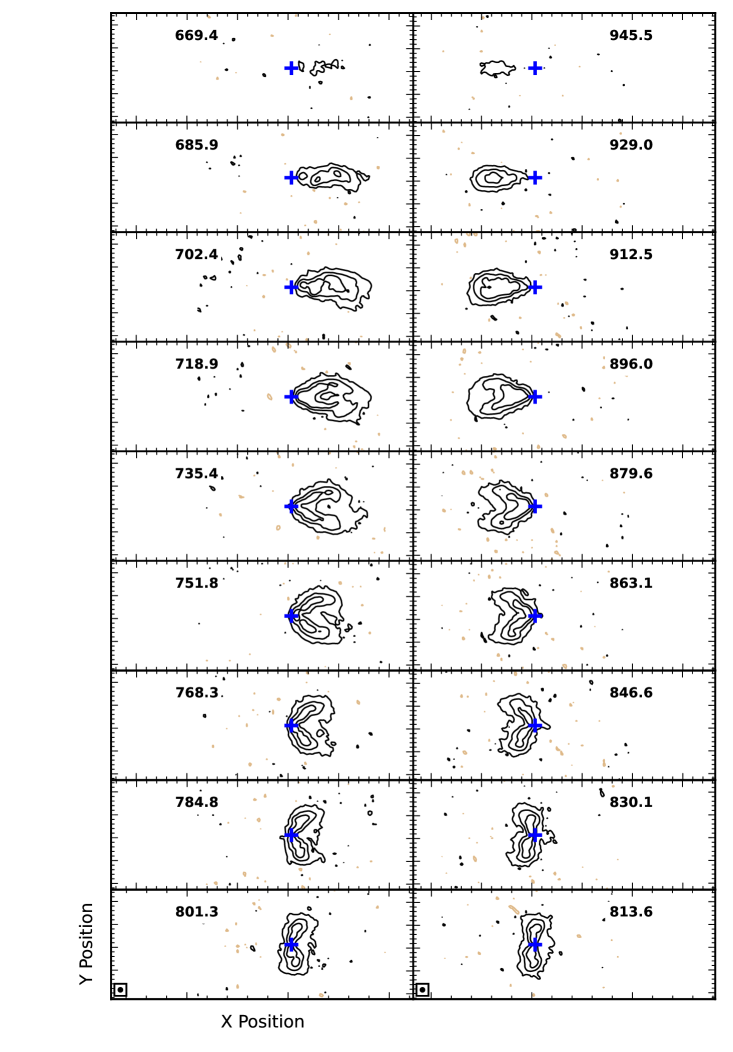
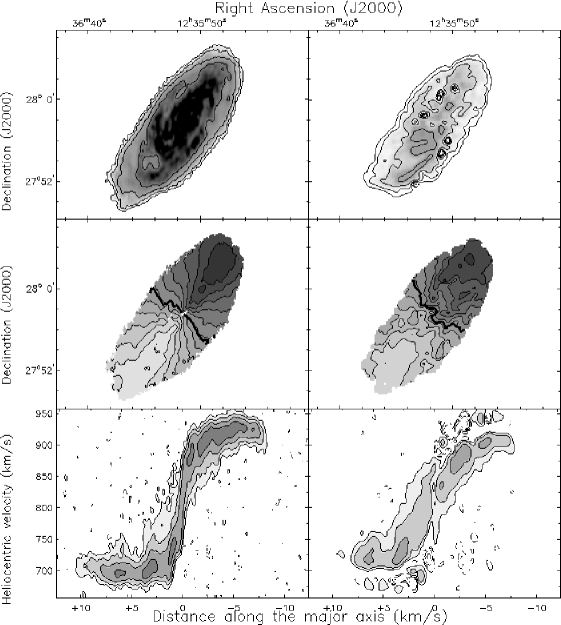
There are various signs of vertically extended lagging gas within the HALOGAS data cube, itself. In Figure 2, we show the channel maps of the resolution HALOGAS cube, rotated so the major axis is horizontal. Signs of lagging extra-planar gas can be seen as emission that fills the “C”-shaped channel maps at intermediate velocities.
Since the analysis in B05 was done, the vertical velocity structure was measured in edge-on galaxies, like NGC 891 (Kamphuis et al., 2007; Oosterloo et al., 2007). Such studies have found that the lagging component is characterized by a vertical gradient in velocity, rather than a bulk decrease in velocity with separate rotation curve from the disk, making the velocity gradient the preferred characterization. Thus, in this study, we constrain the magnitude of the velocity gradient. This is an improvement over B05, where a separate rotation curve for the thick disk was used. To accomplish this, we use TiRiFiC (Józsa et al., 2007) to create 3D tilted ring models to match to the HALOGAS data cube. TiRiFiC is a stand-alone program that constructs 3-D simulated data cubes of rotating galaxy disks. In addition to standard capabilities in other tilted ring codes, TiRiFiC allows for the addition of simple radial and vertical inflows and outflows in the construction of the simulated cubes. We present diagnostic position-velocity diagrams and channel maps of the 3D models as compared to the data in Figure 3.
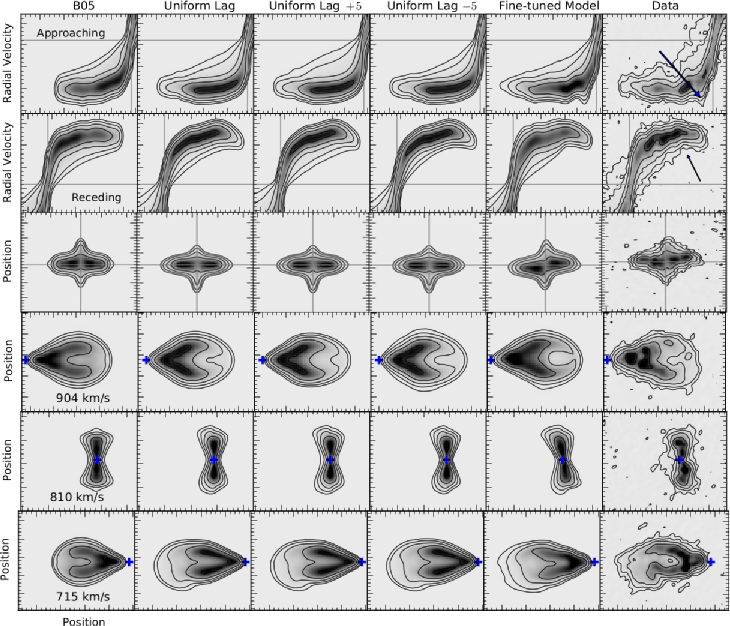
We reproduce the “lagging” model from B05 as a point of comparison. This model contains a two-component gas layer with a thin disk of kpc and a thick disk of kpc. Both disks have separate rotation curves with the exact values as presented in Figure 7 of B05. The radial surface brightness profile was reproduced from Figure 3 of B05, and of the total was put into the thick disk, as was found in B05. The B05 model is included in the left-most column in Figure 3.
We create new 3D models to match to the HALOGAS data cube. We use the GIPSY tasks ELLINT and ROTCUR to find initial estimates for the surface brightness profile and rotation curve. Both tasks are 2D ring fitting codes that use a least-squares fitting algorithm to constrain the Hi density profile (ELLINT) and the rotation curve (ROTCUR).
We use ELLINT in the same fashion here as for the radial profile calculation in Section 3. In a similar fashion, we provide the moment 1 map (velocity field) as input to ROTCUR, and fit only the rotation curve in the approaching and receding halves of the galaxy, independently. In the ROTCUR fitting of the rotation curve, we fix the position angle, inclination, central position and systemic velocity using the values quoted in Table 1 of B05. In both tasks we use rings, all of thickness . We used the initial output surface brightness profile and rotation curve from ELLINT and ROTCUR as the initial input parameters to TiRiFiC to produce 3D tilted ring models. In TiRiFiC, the values of inclination angle, central position angle, and central position are the same throughout all models and are , , and , respectively. The approaching half also seems to show a slight warp at large radii. So, the position angle was lowered, through trial and error, by beginning at a radius of kpc, in that half of the galaxy.
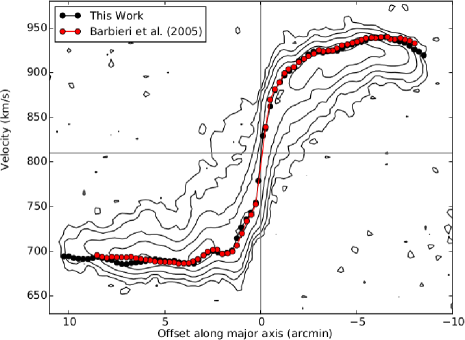
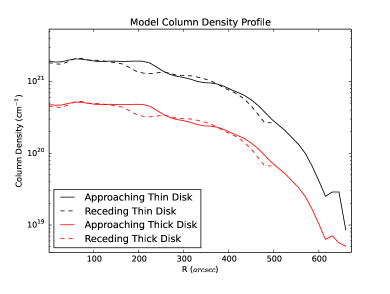
Minor adjustments were made to the ELLINT and ROTCUR output surface brightness profile and rotation curve. These adjustments were made interactively, through trial and error, using TiRiFiC to better match the full 3D structure of the data cube. In all subsequent 3D models, we use trial and error to optimize each parameter by comparing the model to the channel maps, the position-velocity diagrams along both the major and minor axes, the moment 0 map, and the moment 1 map of the cube. We do not use TiRiFiC in automated fitting mode, because conventional fitting routines fail to adequately fit faint structures. Since this study is most interested in characterizing faint structures, such as diffuse lagging extra-planar gas and the forbidden gas stream, we elect to fit the cube in this manner. The rotation curve we adopted for all models overlaid on the position-velocity diagram along the major axis and column density profiles are included in Figure 4 and Figure 5.
We experimented with various warp morphologies by varying the inclination near the edges of the disk, and the scale height in an attempt to reproduce the lagging gas signatures. One such signature can be seen in the position-velocity diagram along the major axis as diffuse emission that is found at velocities closer to systemic than the normally rotating disk. This extra-planar gas feature is commonly referred to as ’beard gas’. No amount of disk warping or disk thickness alone could reproduce the data adequately.
We then added a thick disk component to the first models with a uniform lag throughout. The following parameters were adjusted and matched to the data through trial and error: thick disk scale height, thick disk lag, percentage of total gas in the thick disk, and global velocity dispersion. The velocity dispersion was constrained primarily by matching the thickness and spacing of brightness contours in the position-velocity diagram along the major axis and channel maps. The resulting parameters are shown in Table 2, and the model itself can be seen in the second column of Figure 3.
To better illustrate how constrained the key parameter of lag is in this model, we produce two additional models that are identical to the uniform lag model, but with km s-1 kpc-1 lag. We note that the lag value is degenerate with other parameters of the model, like the thick disk scale height and velocity dispersion (see Section 4.1). These two new models are shown in the third and fourth columns of Figure 3.
| Parameter | Uniform Lag Model | Fine-tuned Model |
|---|---|---|
| Thin Disk Scale Height pc | pc | pc |
| Thick Disk Scale Height | kpc | kpc |
| Central Position Angle | ||
| Central Inclination | ||
| Kinematic Center (, , J2000) | ||
| Thick Disk Lag Magnitude | Approaching:; Receding: km s-1 kpc-1 | Approaching: ; Receding: km s-1 kpc -1 |
| Global Velocity Dispersion | km s-1 | km s-1 + () km s-1 |
| Percentage Gas in Thick Disk | ||
| Vertical Density Profile |
In a final model, referred to as the fine-tuned model, we experimented with various values of velocity dispersion and lag in each individual ring.
We converged on a model containing three values of velocity dispersion in three radial extents. For kpc, the velocity dispersion is km s-1 in the receding half of the thin disk. For kpc kpc the dispersion is km s-1. Outside of kpc, the velocity dispersion is km s-1. This can likely be attributed to turbulent motions in central star forming regions. In the approaching half, rings at kpc and kpc of the thin disk contain km s-1 of velocity dispersion, to account for the “bump” in the position-velocity diagram (see arrow in first row, data column Figure 3). We also increase the lag in the receding half to km s-1 kpc-1 for kpc of the thick disk, which roughly corresponds with R25. The rest of the thick disk in the receding half of the galaxy contains no lag in this model due to a sharp cut off in extra-planar gas signatures in the position-velocity diagram along the major axis (see arrow in second row, data column Figure 3). We note this lack of lag at large radii is not indicative of a sharp radially shallowing lag, but is mostly due to the lack of extra-planar gas at those radii in the receding half.
The approaching half of the galaxy has a uniform lag throughout in this model, just as in the previous model. Lastly, we include a modest radial inflow along the entirety of the thin disk of km s-1 in order to better match a kink in the position-velocity diagram along the minor axis. We note that inside a radius of 10 kpc, radially inflowing gas with this velocity would reach the center of the galaxy within a Gyr. This model is shown in the fifth column of Figure 3.
The uniform lag model captures much of the lagging gas component, as seen in the above described extra-planar gas signatures. However, that model requires different lag magnitudes between the approaching and receding halves. Differences between the uniform lag model and that same model with increased and decreased lags (columns two through four of Figure 3) are most seen in the diffuse signatures of extra-planar lagging gas contours in the position-velocity diagram along the major axis (columns one and two).
The fine-tuned model with its small scale variations in velocity dispersion and lag best represents both halves of the galaxy. From this analysis it is apparent that the lag magnitude does not change from one half of the galaxy to the other, but does cut off at large radii in the receding half, far from the star-forming disk. This result supports a Galactic Fountain model for extra-planar lagging gas, since the lag magnitude is uniform throughout the star-forming disk, and drops off at the edge. Note that no model adequately represents the forbidden gas. See Section 5.2 for a brief discussion on modelling the forbidden gas component. Also note that all asymmetries in the fine-tuned model that do not exist in other models arise from the specific treatment of lag, velocity dispersion, and the modest radial inflow that we include exclusively in that model.
The B05 model is quite comparable to the uniform lag model. We claim that a uniform lag can explain lagging gas just as adequately as two distinct rotation curves for the thin and thick disks in NGC 4559. A uniform lag is preferable in that it has been observationally shown to be more physically accurate (Kamphuis et al., 2007).
Zschaechner et al. (2015) discuss trends in lags among other galaxies and find that lags seem to reach their radially shallowest values near . In the fine-tuned model, we model the lag in the receding half of NGC 4559 to cut off sharply at a radius of kpc. At our assumed distance (D Mpc), is kpc, which makes this radial lag cutoff at . So, this result is consistent with what was found in Zschaechner et al. (2015). Tilted ring models were created from the HALOGAS data cube of NGC 4559 including radially varying lags, but no radially varying lag producing appreciable improvement to the fine-tuned model. As discussed in Zschaechner et al. (2015), the overall steepness of lags suggest that conservation of angular momentum is not a sufficient explanation. Also, Marinacci et al. (2011) create simulations of fountain gas clouds moving through a hot halo medium, and are better at reproducing the steepness of lags seen observationally. Alternatively, Benjamin (2002) propose that pressure gradients could explain the magnitude of morphology of lags, but this has been difficult to accomplish observationally. Deep radio continuum observations with the recently upgraded VLA, like Irwin et al. (2012), should make future measurements of non-thermal pressure gradients possible.
4.1 Uncertainties in Derived Parameters
In general, uncertainties in three-dimensional tilted ring parameters that describe the data are estimated by varying each individual parameter to the point where the model no longer adequately represents the data (Gentile et al., 2013). Certain projections or regions in the data cube are more sensitive to some parameters than others, so these intricacies are considered in estimating uncertainties. The decisions as to what constitutes improvements and acceptable models were based on visual inspection of the various plots, as in previous papers in this type of work. The subtle low column density features generally do not typically lend themselves easily to statistical measures but visual inspection shows clearly if a certain model feature is required to reproduce particular faint features in p-v diagrams and channel maps.
A comparison between total Hi maps is effective at determining the uncertainty in inclination and position angle. A change of in both inclination and position angle through the complete disk is enough to make the total Hi maps inconsistent with the data.
To constrain the uncertainty in global velocity dispersion, we analyze position-velocity diagrams. After testing this parameter, the high velocity contours in the position-velocity diagram along the major axis no longer represent the data when changed by more than km s-1 from their original value of km s-1. We note that the velocity dispersion in the extra-planar gas is degenerate with the thick disk scale height and the magnitude of the thick disk lag. We account for this degeneracy as well as possible in estimating this uncertainty.
Uncertainties in extra-planar gas related parameters are also estimated. We assume a thin disk scale height of pc, while varying values were used for the thick disk. The fitting done in B05 assumed a thin disk scale height of pc, so, for consistency, we retain that value, despite the resolution limits on constraining that number present in both studies. The central channels in the data cube are particularly sensitive to scale height changes. We find the thick disk must have a scale height of kpc. Since NGC 4559 is not seen edge on, the relative mass and amplitude of lag for the extra-planar gas is not easily constrained. We find between of the total Hi mass in extra-planar gas. We find the uncertainty in lag to be km s-1 kpc-1 in both halves of the galaxy. These uncertainties take the degeneracy between scale-height and lag magnitude into account. For instance, large scale height values can be compensated with small lag magnitudes and vice versa. However, small imperfections in models, such as location of extra-planar gas signatures in the position-velocity diagram along the major axis, and thickness of diffuse emission in channel maps were closely inspected to minimize this degeneracy.
5 Anomalous Gas Extraction
It is useful to separate the lagging extra-planar gas component from the total Hi data cube in an independent way. To that end, we follow the procedure by Fraternali et al. (2002) to extract the extra-planar gas component, and create two separate data cubes: one with emission attributed to regularly rotating gas, and another with only emission of extra-planar gas. This procedure was also done in B05, so we will focus on comparing our new results with star-formation tracers.
This procedure assumes that each Hi line profile contains a narrow Gaussian-shaped component whose peak is positioned close to the rotation velocity, and a broader component whose peak is closer to the systemic velocity. The latter is attributed to extra-planar lagging gas whose profile’s shape is unconstrained, but likely substantially fainter than the normally rotating component. We estimated the contribution of the normally rotating component by fitting a Gaussian profile to the upper portions of the total line profile. Modeling only the tops of the line profiles enables us to minimize contamination from potential abnormally rotating components. Experimentation using various percentages of line profiles was performed to decrease the occurrence of fitting artifacts. The procedure produced the least artifacts when only the upper of each line profile was fit. The amplitudes, central velocities, and widths of the Gaussian profiles were fit throughout the data cube. Based on experimenting with parameters, a dispersion maximum limit on each Gaussian profile of km s-1 was imparted on the fitting. The Gaussian profile fit to each line profile was then subtracted from the data line profiles, leaving only anomalously rotating extra-planar gas. In out of instances, Gaussian profiles were not able to be fit. In these instances, the profiles were excluded from the extra-planar cube.
The results of the extra-planar gas extraction can be seen in Figures 6 (right panels) and 7. The behavior of the extra-planar gas seen in velocity fields is somewhat more irregular than in the total data. As seen in the bottom right panel of Figure 6, the residual p-v diagram from the fit (i.e. the presumed extra-planar gas) includes some gas at extreme values of radial velocity, near km s-1 and km s-1, which is not lagging. This is due to the limitation imposed by the forcing the fit to only 60% of the peak of the profile and the maximum cap on the velocity width of the regularly rotating thin disk in the fit. This gas is also likely due to the assumption of Gaussian velocity profiles. If the gas is clumpy or moving peculiarly the Gaussian profile assumption is incorrect. However, most of the residual gas is indeed lagging, as we find of the total residual to reside in the extreme velocity regimes of the position-velocity diagram along the major axis.
Assuming the Hi emission is optically thin, we can estimate the total mass in Hi from its emission. The total Hi mass of the galaxy is M⊙. The mass of the extracted extra-planar Hi is M⊙, or of the total Hi mass. The mass in the thick Hi disk model derived from the tilted ring fitting analysis contains 20% of the total Hi mass. However, the two methods are not directly comparable since the portion of that thick disk at low z was superimposed over the thin disk in the ring models. Since the vertical profile used in the ring modeling was a model, one can integrate that function over the thin disk scale height, and exclude that amount of gas in the thick disk that spatially resides within the thin disk. The amount of thick disk mass outside times the thin disk scale height is of the total mass. This is still somewhat more than for the extracted emission in the Gaussian fitting. In reality, the line profile fitting method certainly misses some extra-planar gas which happens to be at the same velocity (in projection) as the disk gas (Fraternali, in prep.). This is particularly true for gas near the minor-axis, where the rotation signal is weak. We conclude that overall the mass estimates for the extra-planar gas derived from the two methods are in reasonable agreement, and we find of the total Hi mass to be extra-planar.
5.1 Relation of Extra-planar Gas to Star Formation
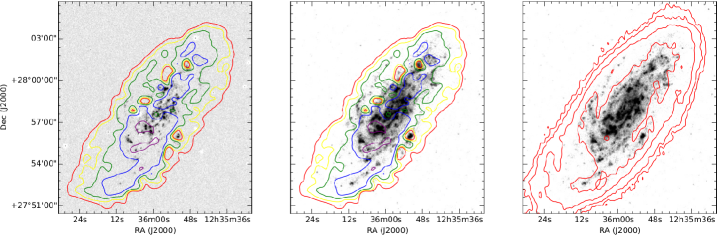
We incorporate two ancillary images – one H narrowband image, and one GALEX FUV image from Gil de Paz et al. (2007) – as tracers of star formation in NGC 4559. We show the extracted extra-planar gas overlaid as colored contours atop the H image and the GALEX FUV image in Figure 7. In Figure 7, we see the location of the highest densities of extra-planar Hi. The three highest density contours (violet, blue and green) trace the regions of active star formation. Additionally, a spiral arm feature seen extending to the south-east in both the H and FUV images is traced by the extra-planar gas. Note there are some small isolated depressions in the extracted extra-planar gas. These are not in all cases regions with lesser amounts of extra-planar gas, but could also be regions where the Gaussian profile fit did not converge.
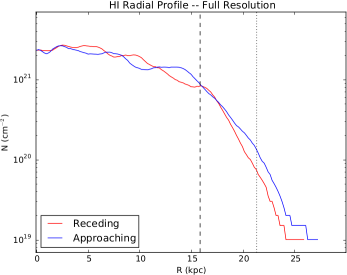
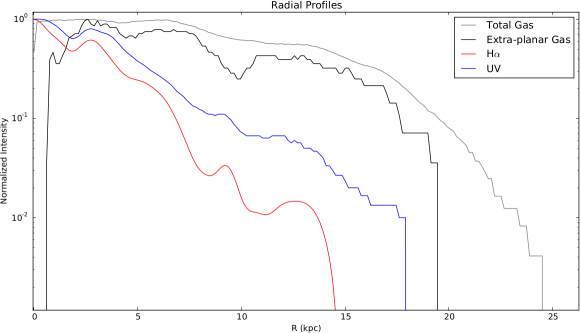
To better see the radial extent of the extra-planar gas and the star formation tracers, we computed azimuthally averaged radial profiles for the total Hi, Gaussian extracted extra-planar gas cube, the H image, and the GALEX FUV image. All profiles are corrected for the inclination of the galaxy. These radial profiles are shown in Figure 8. In this figure, the intensity of each component has been normalized to its peak so that differences in structure can be more easily seen. We find that the total Hi is more extended than the extra-planar gas. The extra-planar gas traces the extent of the UV profile well. Since UV emission, which is indicative of older star formation, and the extra-planar gas are coincident, it is likely that the extra-planar gas is related to past star formation processes (Kennicutt & Evans, 2012). Had the extra-planar gas been due to accretion, there would be a high likelihood of seeing more radially extended extra-planar gas that traces the extent of the total Hi. Thus, we conclude that the extra-planar gas is most likely due to star formation processes.
We also note that our modeling showed evidence that the thick disk lag value approached zero outside of R kpc in the receding half. The modeled thick disk still contained gas there, so this gas would be non-lagging extra-planar gas that would not be found by the Gaussian fitting algorithm. However, we cannot distinguish this gas from disk gas observationally, due to the inclination of the galaxy, so we cannot say whether or not the thick disk lag approaches zero outside of this radius.
It is interesting that the lagging gas is still closely associated with the spiral arms (see e.g. the southern spiral arm in Figure 7). Here, it is relevant to consider the fountain cycle timescale, which is the amount of time it takes for an ejected parcel of gas to fall back down on the disk. If the ejection occurs at km s-1 and is vertically stationary at its apex, then its average vertical velocity is km s-1. This vertical ejection velocity is consistent with the results of Fraternali & Binney (2006), where a vertical kick velocity of this magnitude was used in dynamical models matching observed extra-planar properties of NGC 891 and NGC2403. If the gas reaches a vertical height of kpc, then the gas will traverse the full vertical extent of kpc and fall back to the disk in Myr. When the gas is at a vertical height of kpc it experiences a lag of km s-1, and while it is at kpc it lags the disk by km s-1. Thus, the average magnitude of the lag is km s-1, which would produce an azimuthal offset of kpc over the course of the Myr fountain cycle timescale. This is slightly larger than the () smoothed beam, which is most sensitive to diffuse lagging gas features. Although the inclination of the galaxy would make this offset slightly smaller, we see no evidence for a systematic offset of beam. The time scales suggest that the extra-planar gas is likely to be recently ejected fountain gas, that has not had time to cool and begin its journey back down to the disk. So, we conclude that the most likely origin for the bulk of extra-planar Hi in NGC 4559 is the galactic fountain mechanism; i.e., Hi is transported above the disk as cold/warm gas in superbubbles following the explosion of supernovae.
Our results show roughly of the total Hi mass to be extra-planar. A similar amount of extra-planar gas () was found for NGC 2403 by Fraternali et al. (2002) using a similar Gaussian profile fitting and extraction to what is used in this study. Interestingly, both NGC 2403 and NGC 4559 also have similar star formation rates of M⊙ yr-1 and M⊙ yr-1, respectively (Sanders et al., 2003). Additionally, NGC 3198 was found to house of its total Hi mass as extra-planar gas, with a SFR of M⊙ yr-1 (Gentile et al., 2013). The amount of extra-planar gas in NGC 3198 comes from a tilted ring model analysis, in which of the total Hi mass is used in a thick disk component. Since some of that thick disk is superimposed on the thin disk, the amount of extra-planar gas in NGC 3198 is likely closer to , as we find in NGC 4559. Indeed, even when star formation rate density (SFR/D) is compared, both NGC 2403 and NGC 4559 are similar, with star formation rate densities of and M⊙ yr-1 kpc-2 (Sanders et al., 2003). NGC 3198 has a lower star formation rate density of M⊙ yr-1 kpc-2 (Sanders et al., 2003), yet still has a substantial amount of extra-planar gas (Gentile et al., 2013).
5.2 Forbidden Gas and Hi Holes
A striking amount of anomalous gas located in the ’forbidden’ region of the position-velocity diagram along the major-axis is present in the data cube of NGC 4559. This feature was also mentioned in B05, but the deeper HALOGAS data makes it possible to study this region in more detail. The existence of other Hi holes is noted in this galaxy. However, we focus on this particular one due to its proximity to the forbidden gas feature.
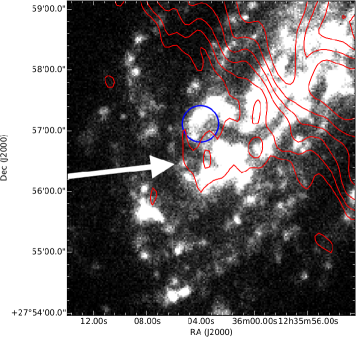
A study by Boomsma et al. (2008) found that most of the Hi holes in NGC 6946 are related to extra-planar material expelled by star formation. The previous study by B05 noted the potential relationship between the forbidden velocity gas feature in NGC 4559 and a nearby Hi hole. The same Hi hole is visible in the full-resolution HALOGAS cube, as well. In Figure 9, we show the sum of channels in the full resolution HALOGAS cube which showed the strongest forbidden emission, overlaid on the GALEX FUV image, and mark the locations of the Hi hole and forbidden velocity filament. We estimate the location of the center of this hole to be , which is in good agreement with B05. We estimate the center of the forbidden gas feature to be located at – this is ( kpc) away from the center of the hole on the sky. Assuming the hole and the forbidden gas feature lie in the same plane on the sky, the vertical distance from the forbidden gas to the point on the plane directly below it would be kpc kpc.
In order to explore the potential origins of this peculiar feature, we extracted it from each channel in which it is present in the smoothed cube. Emission was found in 13 channels between km s-1 and km s-1. The total mass of the feature is M⊙.
The proximity and orientation of the forbidden gas filament suggests it could contain gas that may have once filled the hole. Assuming the bulk motion of the gas in the forbidden gas filament can be characterized by the velocity of the central channel of its emission, we estimate the relative velocity of the filament to the gas in its spatial surroundings. The central channel of the filament’s emission is at km s-1, and the channel containing most of the gas spatially coincident with the feature is at km s-1, ie. the bulk velocity of the gas around the filament has a velocity of km s-1 relative to the hole. We estimate the amount of kinetic energy the forbidden feature would have moving directly vertically from the plane of the galaxy via . Using the relative velocity of the feature corrected for inclination, this energy would be erg.
We estimate the potential energy required to move a parcel of gas to the height of the feature assuming it is located directly above the plane of the disk ( kpc). We use Equation 4 of Howk & Savage (1997) for the potential energy of extra-planar clouds above a galaxy disk. We use the above tabulated cloud mass and height above the plane, assume the stellar disk scale height is the model thin disk scale height of pc, and assume the mid-plane mass density is that of the Solar Neighborhood: M⊙ pc-3 (Bahcall, 1984). We find the corresponding potential energy of the forbidden gas feature is erg s-1. The total energy, kinetic plus potential, required to move this gas is erg, or the energy of supernovae of energy erg, assuming efficiency. This efficiency and energy requirement is reasonable for a superbubble that arose from many supernovae. Fraternali et al. (2015) relate the Galactic HVC Complex C to ejection via star formation processes within the Milky Way. This complex has a hydrogen mass and relative velocity both roughly twice as large as seen in the forbidden gas feature of NGC 4559. Fraternali et al. (2015) estimate the number of supernovae required to eject the complex to be supernovae, corresponding to a typical star formation rate density of a star forming region in the Milky Way disk. Thus, it is plausible that this feature in NGC 4559 was once part of the disk, but was ejected through star formation processes.
If our assumptions about the vertical separation of the forbidden gas from the disk were incorrect, the energy calculation would change somewhat. The kinetic energy would be unchanged. However, the potential energy would decrease if the gas were actually closer to the disk, further bolstering our above conclusion. If the gas were actually located further from the disk, it would require more supernovae to potentially eject the forbidden gas feature. If the gas were located kpc above the disk, this would increase our potential energy calculation by a factor of , which would not be enough to change the above conclusion. Of course, beyond some height, the potential energy required would begin to become unreasonably high. But, the greater the height of the gas, the less likely it is to show the smooth kinematic connection to permitted velocity gas in the major axis p-v diagram.
We can explore whether or not the forbidden gas is an outflow feature or infalling from purely geometric arguments. Both the hole and the forbidden gas feature are located near the major axis in the approaching side of the galaxy and we assume that the spiral arms seen in the GALEX image are trailing arms (see Figure 9), indicative of counter-clockwise rotation. If the arms are indeed trailing arms, then the SW side is the near side. If we assume that the spatial separation between the hole and the forbidden gas feature is mostly along the -axis, then the feature must be located on the far side of the disk, and is therefore outflowing due to its positive heliocentric velocity. If it is inflowing and on the near side of the disk, then the feature cannot be located above the hole, but would instead be “ahead” of the hole in azimuth, which cannot be due to a lag. Therefore, if the feature is inflowing, it is either not related to the hole, or was launched from the hole at a large angle, which is not likely. Since we see this forbidden gas feature as a smooth connection to the extra-planar gas signatures at permitted velocities, which we attribute to a galactic fountain, we believe the forbidden gas feature to most likely be an outflow on the far side of the disk.
In an attempt to explain the presence of the forbidden gas feature, numerous tilted ring models containing both radial and vertical inflows and outflows were created with TiRiFiC. Models were created containing varying strengths of these flows in the inner regions of the thick and thin disks of the best-fitting thick disk model. However, no combination of these effects made models containing any distinct feature akin to the forbidden gas feature. Simple kinematic changes to the tilted ring model are insufficient to match the observed phenomenon. This may be due to the nature of tilted ring fitting – we attempted to model an isolated, non-axisymmetric structure, within rings that extend through half of the angular extent of the entire galaxy. We note that Fraternali & Binney (2006) show that a random fountain can produce similar, centrally-located, forbidden gas features that also exist in NGC 2403.
6 Hi Dwarf Galaxy
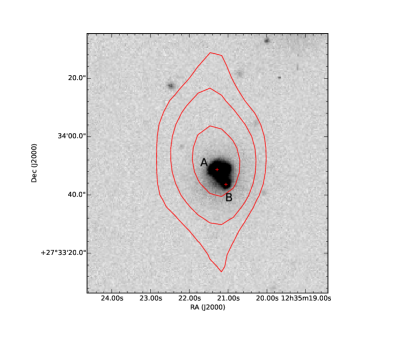
A previously Hi undetected dwarf galaxy was found in the widest field HALOGAS data cube of NGC 4559. The center of this dwarf is located at , , which puts it at least ( kpc) away from the center of NGC 4559, if the objects are spatially aligned in the same plane. The heliocentric velocity of the dwarf is km s-1 and emission from the dwarf spans 9 channels from km s-1, in total. This also makes the dwarf well outside the field of view of the H image. Velocities are computed in the optical definition. The total Hi flux of this feature was found to be mJy, corresponding to a total Hi mass of M⊙, assuming a distance to the dwarf of Mpc. We show the Hi dwarf in Figure 10, overlaid on an SDSS g band image.
We attempted to determine whether the dwarf is, in fact, a bound companion to NGC 4559. The circular velocity of NGC 4559 is km s-1, as seen in the Hi rotation curve modelled in this study. We assume a typical halo mass for a galaxy at the rotation velocity of NGC 4559 by inverting Equation 8 in Klypin et al. (2011). That study found an empirical relation between circular velocity and halo mass, assuming NFW dark matter density profiles using the Bolshoi simulation. The virial mass we find is M⊙, assuming also from the Bolshoi simulation (Klypin et al., 2011). We find the virial mass of a Milky Way-sized halo to be M⊙ using that same relation. Since R M, we estimate the virial radius of NGC 4559 to be kpc. Even if the dwarf is not in the same plane as NGC 4559, it is still likely well within the virial radius.
We estimate the escape velocity of the dwarf using Equation 2-192 in Binney & Tremaine (1987). We estimate kpc, the maximum radius where the circular velocity is constant. Since the halo extends further than the Hi emission, this value is a lower limit, and thus makes the escape velocity estimate also a lower limit. In this calculation, we also use the circular velocity estimate from the tilted ring modelling ( km s-1), and the assumed distance to the dwarf of kpc. This yields an escape velocity of km s-1. This value is much lower than the km s-1 difference in systemic velocity of NGC 4559 and the central velocity of the dwarf. Though we cannot measure the exact distance where the rotation curve ceases to be flat, this would have to occur at a radial distance of kpc for the escape velocity to match the velocity of the dwarf. Since it is unlikely that the rotation curve is flat to such an extreme distance, we conclude that the dwarf is unbound.
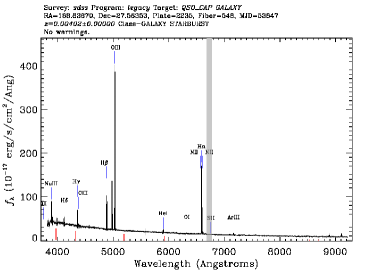
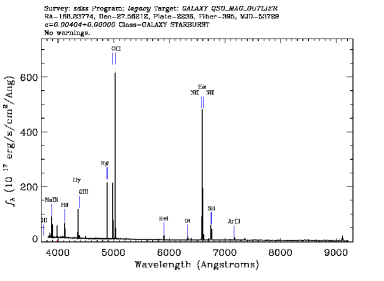
Two optical counterparts for this object were found in the Sloan Digital Sky Survey (SDSS, Eisenstein et al. 2011) data release 12 database. In Figure 10 we show a SDSS g Band image with the HALOGAS Hi contours overlaid in red, showing the locations of the SDSS counterparts and the source in Hi. These two objects are separated by and appear to be two merging objects. The SDSS spectra for these two regions show the objects to both reside at , which corresponds to a heliocentric velocity of km s-1, which is effectively identical to the velocity of the dwarf in Hi. The spectra of these objects can be seen in Figure 11. They both show large OIII/H ratios, implying the existence of high excitation HII regions, and the existence of young stars. We conclude that the dwarf is actually two merging Blue Compact Dwarf (BCD) galaxies.
The SDSS quoted u and g band magnitudes for the north-eastern object are and , and those of the south-western object are and . Using the assumed distance of Mpc, the corresponding absolute magnitudes are M and M for the north-eastern object, and M and M for the south-western object. We converted these magnitudes to an equivalent B band magnitude, then calculated the luminosity of the objects assuming they are at the same distance as NGC 4559. The dwarves have an Hi mass to blue light ratio of . The optical size of the companion is or pc, assuming the object is at the distance of the galaxy. This Hi mass to blue light ratio is low, but within the values obtained by Huchtmeier et al. (2007) – an Effelsberg Hi study of BCD galaxies. The combined Hi mass of these dwarves is also of the same order of magnitude to that of dwarf galaxies in the local group as described in McConnachie (2012). Of these 12, only 4 are within kpc of their parent galaxy. Also of these 12, 5 have MV between and .
7 Discussion and Conclusions
Our analysis of the extra-planar Hi in NGC 4559 can be compared to other moderately inclined spiral galaxies in the HALOGAS sample. In a similar study by Gentile et al. (2013) of NGC 3198, a lagging extra-planar Hi component was discovered, containing of the total Hi mass of that galaxy. The extra-planar Hi in NGC 3198 was found to be characterized by a thick disk scale-height of kpc with a vertical lag of km s-1 kpc-1. These values are very similar to what was found in NGC 4559.
NGC 2403 is a very similar galaxy to NGC 4559 in morphology and star formation characteristics, and was studied in Hi with the Very Large Array by Fraternali et al. (2002). NGC 2403 has a star formation rate of M⊙ yr-1 (Sanders et al., 2003) and a rotation velocity of km s-1. Fraternali et al. (2002) found NGC 2403 to contain an extra-planar Hi component containing of the total Hi mass of that galaxy. That study found the extra-planar Hi to be lagging the disk’s rotation velocity by km s-1.
A recent study by de Blok et al. (2014) of NGC 4414 found that only about of the total Hi mass is in extra-planar gas. However, due to the disturbed nature of that galaxy’s halo, that number is difficult to constrain. Analysis of the inner disk of NGC 4414 show that galaxy has likely experienced a recent interaction with a dwarf galaxy, which may account for its large star formation rate of M.
Although the characteristics of the extra-planar Hi in NGC 4559 seem to fit into the overall nearby moderately-inclined spiral galaxy picture, it is difficult to say whether or not lagging extra-planar Hi is ubiquitous or extraordinary throughout the nearby universe. Furthermore, is extra-planar lagging Hi always seen to be likely caused by the Galactic Fountain mechanism? Greater understanding of this problem can be obtained through further study of the entire HALOGAS sample, both edge-on and moderately inclined galaxies. The next generation of radio telescopes, including the Square Kilometre Array, will answer these questions in the future.
We used the deep 21 cm HALOGAS observations of NGC 4559 to expand upon the work done by Barbieri et al. (2005) in characterizing diffuse extra-planar and anomalous characteristics in the Hi distribution of that galaxy. We created detailed three dimensional, tilted ring models of that galaxy’s Hi. We confirm B05, in that a model containing only a pc thin disk cannot produce a fit to the faint extra-planar lagging gas signatures seen in this galaxy. We create an expanded model containing a thick disk comprised of 20% of the total Hi of the thin disk model, whose thick disk component extends vertically to a scale height of kpc. We constrain the magnitude of the gradient in rotation velocity with height in a simple thick disk model to be km s-1 kpc-1 in the approaching side and km s-1 kpc-1 in the receding side. In the fine-tuned model, we find that a lag of km s-1 kpc-1 in both halves, but with a cutoff in the receding half near is an improved match to the data. This measurement of the lag magnitude was not previously done in B05, where a separate rotation curve was used for the thick disk.
We use a Gaussian line profile fitting technique to extract the anomalously rotating extra-planar gas from the normally rotating disk. In this technique we find that of the total Hi mass is extra-planar. Also, the extra-planar gas is localized to the inner star-forming regions of the galaxy, again suggesting a bulk of this gas is of galactic fountain origin.
We analyze the spatial locations of total and extra-planar Hi in relation to H, emission seen from young stars as a tracer for active star formation. We find that extra-planar Hi traces regions of star formation, leading us to conclude that most of the extra-planar Hi seen is from in-situ star formation, ie. a galaxy-wide galactic fountain.
To further build on the work of B05, we extracted the emission from a filament of Hi located in the kinematically forbidden region of the position-velocity diagram along the major axis. We find that the feature contains M⊙ of Hi. Energy estimates of the feature require supernova to move the gas, which is consistent with a superbubble or other in-situ processes due to star formation. The remarkable proximity of this feature to a large Hi hole is difficult to ignore, but no irrefutable evidence tying the two together was found. Furthermore, the feature extends into the extra-planar gas signatures quite smoothly in the position-velocity diagram along the major axis, further pointing to the filament originating inside of the normally rotating disk, and was also expelled through star formation.
We analyze a merger of two BCD galaxies, previously unobserved in Hi, located from the center of NGC 4559. The BCD galaxies contain M⊙ of Hi and contain two spatially tight counterpart sources in SDSS. We conclude the objects are merging BCD galaxies due to a low Hi mass to blue light ratio of and spectra largely indicative of Hii regions.
References
- Bahcall (1984) Bahcall, J. N. 1984, ApJ, 276, 169
- Barbieri et al. (2005) Barbieri, C. V., Fraternali, F., Oosterloo, T., et al. 2005, A&A, 439, 947
- Benjamin (2002) Benjamin, R. A. 2002, in Astronomical Society of the Pacific Conference Series, Vol. 276, Seeing Through the Dust: The Detection of HI and the Exploration of the ISM in Galaxies, ed. A. R. Taylor, T. L. Landecker, & A. G. Willis, 201
- Binney & Tremaine (1987) Binney, J., & Tremaine, S. 1987, Galactic dynamics
- Boomsma et al. (2008) Boomsma, R., Oosterloo, T. A., Fraternali, F., van der Hulst, J. M., & Sancisi, R. 2008, A&A, 490, 555
- Bregman (1980) Bregman, J. N. 1980, ApJ, 236, 577
- Broeils (1992) Broeils, A. H. 1992, PhD thesis, PhD thesis, Univ. Groningen, (1992)
- Collins et al. (2002) Collins, J. A., Benjamin, R. A., & Rand, R. J. 2002, ApJ, 578, 98
- Corbelli & Salpeter (1993) Corbelli, E., & Salpeter, E. E. 1993, ApJ, 419, 104
- de Blok et al. (2014) de Blok, W. J. G., Józsa, G. I. G., Patterson, M., et al. 2014, ArXiv e-prints, arXiv:1405.2160
- Eisenstein et al. (2011) Eisenstein, D. J., Weinberg, D. H., Agol, E., et al. 2011, AJ, 142, 72
- Fraternali (in prep.) Fraternali, F., e. a. in prep., in prep, in prep
- Fraternali & Binney (2006) Fraternali, F., & Binney, J. J. 2006, MNRAS, 366, 449
- Fraternali et al. (2015) Fraternali, F., Marasco, A., Armillotta, L., & Marinacci, F. 2015, MNRAS, 447, L70
- Fraternali et al. (2002) Fraternali, F., van Moorsel, G., Sancisi, R., & Oosterloo, T. 2002, AJ, 123, 3124
- Gentile et al. (2013) Gentile, G., Józsa, G. I. G., Serra, P., et al. 2013, A&A, 554, A125
- Gil de Paz et al. (2007) Gil de Paz, A., Boissier, S., Madore, B. F., et al. 2007, ApJS, 173, 185
- Heald et al. (2011) Heald, G., Józsa, G., Serra, P., et al. 2011, A&A, 526, A118
- Heald et al. (2016) Heald, G., de Blok, W. J. G., Lucero, D., et al. 2016, MNRAS, 462, 1238
- Howk & Savage (1997) Howk, J. C., & Savage, B. D. 1997, AJ, 114, 2463
- Howk & Savage (1999) —. 1999, AJ, 117, 2077
- Huchtmeier et al. (2007) Huchtmeier, W. K., Petrosian, A., Gopal-Krishna, & Kunth, D. 2007, A&A, 462, 919
- Irwin et al. (2012) Irwin, J., Beck, R., Benjamin, R. A., et al. 2012, AJ, 144, 43
- Józsa et al. (2007) Józsa, G. I. G., Kenn, F., Klein, U., & Oosterloo, T. A. 2007, A&A, 468, 731
- Kamphuis et al. (2007) Kamphuis, P., Peletier, R. F., Dettmar, R.-J., et al. 2007, A&A, 468, 951
- Kennicutt & Evans (2012) Kennicutt, R. C., & Evans, N. J. 2012, ARA&A, 50, 531
- Klypin et al. (2011) Klypin, A. A., Trujillo-Gomez, S., & Primack, J. 2011, ApJ, 740, 102
- Maloney (1993) Maloney, P. 1993, ApJ, 414, 41
- Marinacci et al. (2011) Marinacci, F., Fraternali, F., Nipoti, C., et al. 2011, MNRAS, 415, 1534
- McConnachie (2012) McConnachie, A. W. 2012, AJ, 144, 4
- Oosterloo et al. (2007) Oosterloo, T., Fraternali, F., & Sancisi, R. 2007, AJ, 134, 1019
- Putman et al. (2012) Putman, M. E., Peek, J. E. G., & Joung, M. R. 2012, ARA&A, 50, 491
- Rossa & Dettmar (2003) Rossa, J., & Dettmar, R.-J. 2003, A&A, 406, 493
- Sanders et al. (2003) Sanders, D. B., Mazzarella, J. M., Kim, D.-C., Surace, J. A., & Soifer, B. T. 2003, AJ, 126, 1607
- Sault et al. (1995) Sault, R. J., Teuben, P. J., & Wright, M. C. H. 1995, in Astronomical Society of the Pacific Conference Series, Vol. 77, Astronomical Data Analysis Software and Systems IV, ed. R. A. Shaw, H. E. Payne, & J. J. E. Hayes, 433
- Shapiro & Field (1976) Shapiro, P. R., & Field, G. B. 1976, ApJ, 205, 762
- Shostak (1975) Shostak, G. S. 1975, ApJ, 198, 527
- Tüllmann et al. (2006) Tüllmann, R., Pietsch, W., Rossa, J., Breitschwerdt, D., & Dettmar, R.-J. 2006, A&A, 448, 43
- van der Hulst et al. (1992) van der Hulst, J. M., Terlouw, J. P., Begeman, K. G., Zwitser, W., & Roelfsema, P. R. 1992, in Astronomical Society of the Pacific Conference Series, Vol. 25, Astronomical Data Analysis Software and Systems I, ed. D. M. Worrall, C. Biemesderfer, & J. Barnes, 131
- Zschaechner et al. (2015) Zschaechner, L. K., Rand, R. J., & Walterbos, R. 2015, ApJ, 799, 61