A Herschel††thanks: Herschel is an ESA space observatory with science instruments provided by the European-led Principle Investigator and with important participation from NASA resolved debris disc around HD 105211
Abstract
Debris discs are the dusty aftermath of planet formation processes around main-sequence stars. Analysis of these discs is often hampered by the absence of any meaningful constraint on the location and spatial extent of the disc around its host star. Multi-wavelength, resolved imaging ameliorates the degeneracies inherent in the modelling process, making such data indispensable in the interpretation of these systems.
The Herschel Space Observatory observed HD 105211 ( Cru, HIP 59072) with its PACS instrument in three far-infrared wavebands (70, 100 and 160 m). Here we combine these data with ancillary photometry spanning optical to far-infrared wavelengths in order to determine the extent of the circumstellar disc. The spectral energy distribution and multi-wavelength resolved emission of the disc are simultaneously modelled using a radiative transfer and imaging codes. Analysis of the Herschel/PACS images reveals the presence of extended structure in all three PACS images. From a radiative transfer model we derive a disc extent of 87.0 2.5 au, with an inclination of 70.7 to the line of sight and a position angle of 30.1 . Deconvolution of the Herschel images reveal a potential asymmetry but this remains uncertain as a combined radiative transfer and image analysis replicate both the structure and the emission of the disc using a single axisymmetric annulus.
keywords:
stars: individual: HD 105211 – circumstellar matter – infrared: stars: planetary systems – disc-planet interactionsAccepted to appear in the Monthly Notices of the Royal Astronomical Society on 25th March, 2017
1 Introduction
In the early 1980s, the InfraRed Astronomical Satellite (IRAS; Neugebauer et al. 1984), announced the surprising discovery that several young, nearby stars were brighter at infrared wavelengths than was expected (e.g. Aumann et al. 1984; Harper et al. 1984). It was soon realised that this excess infrared emission was the signature of dusty debris in orbit around those stars; being analogous to, but far more massive than the Solar system’s Asteroid Belt (e.g. Aumann & Good 1990; Zuckerman 1993; Nesvorný et al. 2010). In the three decades since, the detection of such infrared excesses has become routine; with many main sequence stars being found to host significant amounts of circumstellar debris at mid- and far-infrared wavelengths (e.g. Su et al. 2006; Fujiwara et al. 2013; Eiroa et al. 2013; Kennedy & Wyatt 2013; Thureau et al. 2014; Ballering et al. 2014; Montesinos et al. 2016).
We now know that such debris discs are a normal result of the stellar and planetary formation process. Observations have shown that most of the youngest, low-mass stars are attended by massive gas- and dust-rich circumstellar discs (Williams & Cieza 2011). It is within these discs that the formation of planetary systems like our own occurs, assembling planetesimals and planets (Lissauer 1993) from dust grains over the first 1 to 100 Myr of the star’s life (Meyer et al. 2002; Carpenter et al. 2009; Oliveira et al. 2011). These protoplanetary discs undergo significant evolution over the first 10 Myr of the star’s life, which can be traced through the decay of excess emission at near- and mid-infrared wavelengths (e.g. Ribas et al. 2014), and a corresponding drop in emission at sub-millimetre wavelengths (Wyatt 2008; Panić et al. 2013; Wyatt et al. 2015). Around older stars the tenuous, dusty remnants of these protoplanetary discs remain observable through the presence of excess emission above that of the stellar photosphere at infrared wavelengths (Habing et al. 2001; Decin et al. 2003; Wyatt et al. 2007; Kains et al. 2011). These faint, gas-poor discs are replenished by the mutual collision of unseen planetesimals – hence these systems are called “debris discs” (Backman & Paresce 1993; Matthews et al. 2014a). To date, the vast majority of known debris discs remain unresolved.
Most of our current knowledge of the evolution of debris discs has been derived from the analysis of multi-wavelength photometry (i.e. their spectral energy distributions, or SEDs; e.g. Wyatt et al. 2007; Kains et al. 2011) and mid-infrared spectroscopy (Chen et al. 2006; Beichman et al. 2006a; Chen et al. 2014; Mittal et al. 2015).
At the most basic level, the observational properties of debris discs are limited to their temperature and brightness (fractional luminosity, ), derived from fitting simple (modified) blackbody models to their SEDs (Wyatt 2008). By definition, debris discs have fractional luminosities lower than 10-2 (Lagrange et al. 2000; Wyatt et al. 2015).
Drawing parallels to the Solar system, the debris discs are most commonly divided into warm and cool discs, analogous to the Solar system’s Asteroid Belt (Nesvorný et al. 2010) and Edgeworth-Kuiper Belt (Vitense et al. 2012), repsectively. Recent surveys of nearby stars reveal an incidence of cool dust around Sun-like stars (FGK spectral types) of 20 2 per cent (Eiroa et al. 2013; Montesinos et al. 2016). Observational constraints place the faintest known debris discs at fractional luminosities () of a few (Eiroa et al. 2013), around five to ten times brighter than the predicted brightness of the Edgeworth-Kuiper Belt (Vitense et al. 2012). It is therefore worth noting that, with current technology, we would so far have failed to detect the Solar system’s debris components; we might therefore assume that the Solar system is dust free.
The SED of an unresolved debris disc system can be used to broadly infer the structure of the underlying planetary system. Assuming thermal equilibrium between the dust and incident stellar radiation means that the radial location of dust derived from a disc’s blackbody temperature is the minimum separation at which the dust could lie from the star. Studies of resolved debris discs revealed that the disc extent is often much greater than that predicted from the dust temperature (e.g. Marshall et al. 2011; Wyatt et al. 2012; Rodriguez & Zuckerman 2012). A trend between host star luminosity and dust temperature for A- to G-type stars has been noted (Booth et al. 2013; Morales et al. 2013) with larger discs, relative to the blackbody radius, observed around later type stars. Modelling of a sample of 34 extended debris discs parameterised this relationship, allowing more plausible estimates of the true extent of unresolved discs to be made (Pawellek et al. 2014; Pawellek & Krivov 2015).
For many debris discs, modelling their excesses using a single component often fails to accurately reproduce the observed SEDs. For this reason, a growing number of studies have modelled systems using two (or more) components. Such systems are often inferred to have multiple dust-producing planetesimal belts; however, the migration of dust and planetesimals within a system could also explain such observations (Morales et al. 2011; Duchêne et al. 2014; Kennedy & Wyatt 2014). A more detailed understanding of the architectures of these systems is limited by the fundamental degeneracies between the assumed disc radial location, minimum dust grain size and dust composition (e.g. Löhne et al. 2008; Krivov 2010). Such knowledge is particularly important in placing circumstellar debris in context as a component of the planetary systems, alongside planets, around their host stars (Wyatt et al. 2012; Maldonado et al. 2012, 2015; Marshall et al. 2014a; Moro-Martín et al. 2015; Wittenmyer & Marshall 2015).
The Herschel Space Observatory (Pilbratt et al. 2010), with its large, 3.5-m primary mirror, offered an unprecedented opportunity to spatially resolve circumstellar emission at far-infrared and sub-millimetre wavelengths. The Herschel Photodetector Array Camera and Spectrometer (PACS; Poglitsch et al. 2010) had imaging capabilities in three wavebands centred on 70, 100 and 160 .
The analysis of resolved images of debris discs in the far-infrared, made possible by the high angular resolution of PACS (58 FWHM at 70 ), in conjunction with more densely sampled source SEDs greatly refined models of nearby debris disc systems. As a result, Herschel/PACS led to the detection of many new debris disc systems. In addition, thanks to the excellent spatial resolution by Herschel, it was able to resolve approximately half of the discs imaged by PACS (e.g. Liseau et al. 2010; Marshall et al. 2011; Löhne et al. 2012; Eiroa et al. 2013; Booth et al. 2013; Ertel et al. 2014; Matthews et al. 2014b; Marshall et al. 2014b). These results made possible, for the first time, the quantification of the relationship between the presence of debris and the presence of planets (Bryden et al. 2013). It also allowed the architectures of a number of planetary systems to be more precisely determined, as a direct result of the measurement of the orientation of the debris in those systems (Greaves et al. 2014; Kennedy et al. 2014).
HD 105211 ( Cru, HIP 59072) was identified as a debris disc host star through observations at 70 by the Spitzer Space Telescope’s (Werner et al. 2004) Multiband Imaging Photometer for Spitzer instrument (MIPS; Rieke et al. 2004). The detection image revealed a bright disc with extended emission (Beichman et al. 2006b). Here we analyse the higher angular resolution Herschel/PACS images of this target in combination with available data from the literature, seeking to better determine the architecture of this nearby, bright debris disc.
In Section 2 we describe the observations obtained and the associated analysis for HD 105211. In Section 3, the results of the analysis of the SED, disc images and radial profiles at PACS 70/100/160 are presented along with measurements of the disc observational properties: temperature , radial extent (both from the blackbody assumption and resolved/deconvolved images), and fractional luminosity . In Section 4, we discuss the state of the disc in comparison with other studied systems and the potential asymmetry present. In Section 5, we summarise our conclusions and discuss our plans for future work in studying this system.
2 Observations and analysis
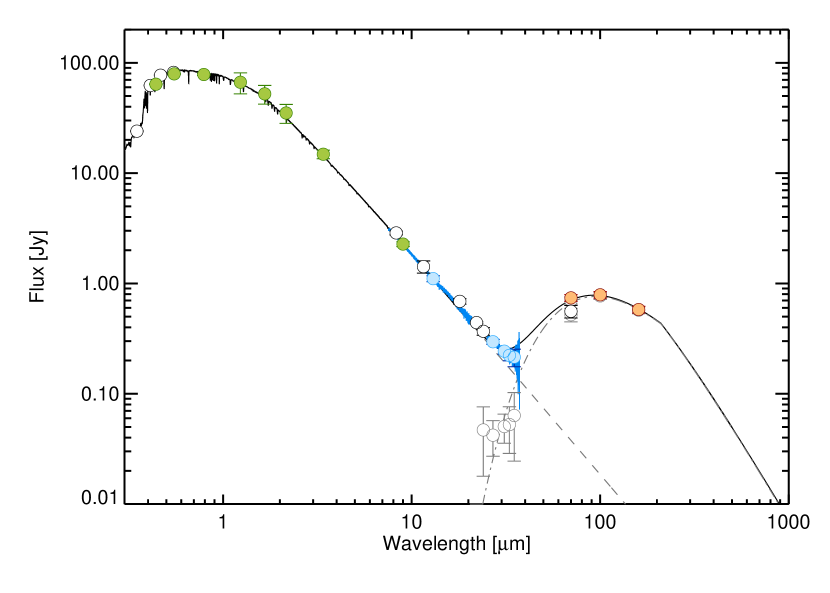
In this section, we present the observational data for the HD 105211 system. This includes the characterisation of the host star with the fitting of a stellar photosphere model, a summary of the ancilliary photometry compiled for the SED, and a description of the Herschel observations, their reduction and analysis. The compiled SED for HD 105211, a scaled photospheric model, and a blackbody fit to the dust excess are presented in Figure 1.
2.1 Stellar parameters
HD 105211 ( Crucis, HIP 50972) is a nearby (d = 19.76 0.05 pc, van Leeuwen 2007), main-sequence star. Currently, HD 105211 is defined as both a spectroscopic binary (The Washington Visual Double Star Catalog, Mason et al. 2001) and a main sequence star with a spectral type of F2 V (Gray et al. 2006) and it was originally classified as a yellow-white giant (F2 III, Joergensen et al. 1971). HD 105211 has been estimated to have an age between 1.30 to 3.99 Gyr with an effective temperature of 6950 K (Gray et al. 2006) and a sub-solar metallicity [Fe/H] of -0.37. A summary of the stellar physical properties are given in Table 1.
| Parameter | Value | Ref. |
|---|---|---|
| Distance [pc] | 19.76 0.05 | 1 |
| Right Ascension [h:m:s] | 1 | |
| Declination [d:m:s] | 1 | |
| Proper Motions (RA,Dec) [mas/yr] | 33.88 0.12 | 1 |
| -37.02 0.10 | 1 | |
| Spectral & Luminosity Class | F2 V | 2 |
| , B.C. [mag] | 4.142 0.004, -0.05 | 3 |
| - [mag] | 0.353 0.007 | 3 |
| Bolometric Luminosity [L⊙] | 6.6 0.2 | 4 |
| Radius [] | 1.66 0.04 | 4 |
| Mass [] | 1.63 0.04 | 4 |
| Temperature [K] | 7244 50 | 4 |
| Surface Gravity, [cm/s2] | 4.21 0.03 | 4 |
| Metallicity [Fe/H] | -0.37 0.18 | 5, 6, 9 & 10 |
| sin [km/s] | 46.1 2.3 | 7 |
| Age [Gyr] | 1.30-3.99 | 8, 9 & 10 |
References. (1) van Leeuwen (2007); (2) Gray et al. (2006); (3) Turon et al. (1993); (4) Allende Prieto & Lambert (1999); (5) Beichman et al. (2006b); (6) (Marsakov & Shevelev 1995); (7) Ammler-von Eiff & Reiners (2012); (8) Feltzing et al. (2001); (9) Ibukiyama & Arimoto (2002); (10) Nordstrom et al. (2004).
The stellar photospheric contribution to the SED was modelled using an appropriate model taken from the Castelli-Kurcz atlas111Castelli-Kurcz models can be obtained from: http://www.stsci.edu/hst/observatory/crds/castelli_kurucz_atlas.html (Castelli & Kurucz 2004). The chosen photospheric model was scaled to the observations at optical and near-infrared wavelengths between 0.5 and 10 , weighted by their uncertainties, using a least squares fit.
2.2 Ancillary data
| Wavelength | Flux | Reference |
|---|---|---|
| [Jy] | ||
| 0.349 | 24.020 0.240 | 1 |
| 0.411 | 62.400 0.620 | 1 |
| 0.440 | 69.910 6.450 | 2 |
| 0.466 | 72.700 0.770 | 1 |
| 0.546 | 69.910 6.450 | 1 |
| 0.550 | 79.990 7.380 | 2 |
| 0.64 | 92.200 0.460 | 3 |
| 0.79 | 88.400 0.400 | 3 |
| 1.26 | 59.160 7.650 | 4 |
| 1.60 | 45.850 5.930 | 4 |
| 2.22 | 29.790 1.920 | 4 |
| 3.40 | 14.840 1.340 | 5 |
| 8.28 | 2.870 0.118 | 6 |
| 9 | 2.270 0.070 | 7 |
| 12 | 1.420 0.180 | 5 |
| 13 | 1.105 0.039 | 8 |
| 18 | 0.690 0.030 | 7 |
| 22 | 0.434 0.007 | 5 |
| 24 | 0.368 0.025 | 9 |
| 27 | 0.296 0.015 | 10 |
| 31 | 0.228 0.011 | 8 |
| 33 | 0.222 0.022 | 10 |
| 35 | 0.214 0.038 | 10 |
| 70 | 0.559 0.073 | 9 |
| 70 | 0.733 0.063 | 11 |
| 100 | 0.728 0.096 | 11 |
| 160 | 0.564 0.095 | 11 |
References. (1) Hauck &
Mermilliod (1998); (2) Hipparcos catalogue, ESA (1997); (3) Morel &
Magnenat (1978); (4) Epchtein
et al. (1985); (5) WISE all-sky survey, Wright
et al. (2010); (6) AKARI IRC all-sky survey, Ishihara
et al. (2010); (7) MSX catalogue (Egan
et al. 2003); (8) Spitzer/IRS, (Mittal et al. 2015); (9) Spitzer/MIPS, Chen et al. (2014); (10) Spitzer/IRS, this work; (11) Herschel/PACS, this work.
For the purposes of modelling HD 105211’s SED, the Herschel PACS photometry were supplemented with a broad range of observations from the literature spanning optical to far-infrared wavelengths. A summary of the compiled photometry is given in Table 2.
The optical Johnson BV photometry were taken from the Hipparcos & Tycho Catalogues (ESA 1997), whilst the near-infrared RI and JHK photometry were taken from the catalogues of Morel & Magnenat (Morel & Magnenat 1978) and Epchtein (Epchtein et al. 1985), respectively. These measurements were supplemented by Strömgren photometry from Hauck & Mermilliod (1998).
Mid-infrared photometry included in the SED were taken from the Midcourse Space eXperiment (MSX; Egan et al. 2003), AKARI IRC all-sky survey at 9 and 18 (Ishihara et al. 2010), the WISE survey at 3.4, 12, and 22 (the 4.6 band measurement was saturated Wright et al. 2010), and a Spitzer MIPS measurement at 24 (Chen et al. 2014). Colour corrections were applied to the AKARI IRC measurements assuming a blackbody temperature of 7000 K (factors of 1.184 at 9 and 0.990 at 18 ), and also applied to the WISE data assuming a Rayleigh-Jeans slope (factors of 1.0088 at 12 and 1.0013 at 22 ).
A Spitzer InfraRed Spectrograph (IRS; Houck et al. 2004) low-resolution spectrum spanning 7.5 to 38 (PID 2324, PI Beichman, AOR 16605440) was taken from the CASSIS222The Cornell Atlas of Spitzer/IRS Sources (CASSIS) is a product of the Infrared Science Center at Cornell University, supported by NASA and JPL. archive (Lebouteiller et al. 2011). The IRS spectrum was scaled to match the model photosphere at wavelengths 10 , where no excess emission from the disc was expected, by a least-squares fitting process. The rescaling factor for the IRS spectrum was 0.94, in line with other works (e.g. Chen et al. 2009; Marshall et al. 2014b). For inclusion in the SED modelling process, the IRS spectrum was binned with a weighted average mean (with associated uncertainty) at 27, 30, 33 and 36 in order to trace the rise in the excess emission from the dust above the photosphere at mid-infrared wavelengths (see section 3.2 for details).
2.3 Herschel data
At far-infrared wavelengths, the previous Spitzer/MIPS 70 measurement (Beichman et al. 2006b) was supplemented by the new Herschel/PACS observations. HD 105211 was observed as part of the Herschel Open Time 1 programme ot1_sdodson_1 (PI: S. Dodson-Robinson; ‘A study into the conditions for giant planet formation’), the results of which were presented in Dodson-Robinson et al. (2016). The log of Herschel observations is given in Table 3.
| Observation ID | OD | Wavelengths [] | Duration [s] |
|---|---|---|---|
| 1342262373/74 | 1355 | 70/160 | 465 |
| 1342262371/72 | 1355 | 100/160 | 445 |
PACS scan map observations of HD 105211 were taken in both 70/160 and 100/160 channel combinations. A summary of the PACS observations is presented in Table 3. Each scan map was conducted at a slew rate of per second (medium scan speed) and is composed of eight scan legs of long, each separated by . The target was observed twice, at instrument orientation angles of 70°and 110°, for each channel combination. This resulted in a total of two scan maps each for 70 and 100 and a total of four scan maps for 160 .
Reduction of the Herschel/PACS data was carried out in the Herschel Interactive Processing Environment333hipe is a joint development by the Herschel Science Ground Segment Consortium, consisting of ESA, the NASA Herschel Science Center, and the HIFI, PACS and SPIRE consortia.
http://www.cosmos.esa.int/web/herschel/hipe-download (hipe; Ott 2010) user release 13.0.0 and PACS calibration version 69 (the latest available public release at the time), using the standard reduction script starting from the level 0 products. All available images (i.e. two each at 70 and 100 , and four at 160 ) were combined to produce a final mosaic for each waveband. The image scales for the mosaiced images were 12 per pixel for the 70 and 100 images, and 24 per pixel for the 160 image. To remove large scale background emission, the images were high-pass filtered with widths of 15 (70/100 ) and 25 (160 ) frames, corresponding to spatial scales of and , respectively.
Fluxes were measured using an aperture photometry task implemented in Matlab. In the 70 and 100 images we adopted aperture radii of , in order to encompass the whole disc within the measurement aperture. At 160 the disc is contaminated by the presence of bright, nearby background structure to the west. We therefore use a smaller aperture radius of at 160 , despite the larger beam size (118 FWHM at 160 compared to 58 FWHM at 70 ), to reduce the contribution of this background to the measurement. These values were scaled by appropriate aperture correction factors of 0.877, 0.867 and 0.758 at 70, 100 and 160 photometry, respectively (Balog et al. 2014). We note that whilst applying aperture corrections derived for point sources may be contentious when dealing with extended sources, this method has been widely used in the literature (e.g. Liseau et al. 2010; Marshall et al. 2011; Booth et al. 2013; Roberge et al. 2013; Ertel et al. 2014; Marshall et al. 2016).
The Herschel flux measurements in each waveband were also colour corrected, treating the stellar and dust contributions separately. Appropriate factors were taken from the PACS Photometer colour correction release note444http://herschel.esac.esa.int/twiki/pub/Public/PacsCalibrationWeb/ cc_report_v1.pdf corresponding to their temperature values of 6,950 K for the star (interpolating between tabulate values) and 50 K for the dust. At 70, 100, and 160 we used values of 1.016 (0.982), 1.033 (0.985) and 1.074 (1.010) for the stellar (dust) contributions, respectively. The final fluxes used in the modelling were further corrected for losses (1 to 2 per cent) induced by the high-pass filtering process, as detailed in Popesso et al. (2012). The PACS fluxes and associated uncertainties are shown in Table 2.
The sky background in each mosaic was estimated from the median values of ten randomly placed 1010 pixel sub-regions of each mosaic. These regions were masked to avoid HD 105211, any bright background objects (e.g. CL Cru – see Section 3.3), and the borders of the mosaics (where noise increases due to lower coverage). The median value was scaled to the revelant aperture size corresponding to the target radius to yield the sky background contribution, which was then subtracted from the measured flux (before correction, as detailed above). The sky noise was estimated from the standard deviation of the ten sub-regions.
3 Results
Here we present the results of our analysis of HD 105211’s disc. We examine the PACS images for evidence of extended emission, before applying a deconvolution routine to better determine the disc extent and geometry. The additional photometric points are combined with ancillary data and the disc architecture measured from the images to model the disc, fitting the excess emission with both modified blackbody and power law disc models from which we deduce the dust grain properties.
3.1 Images
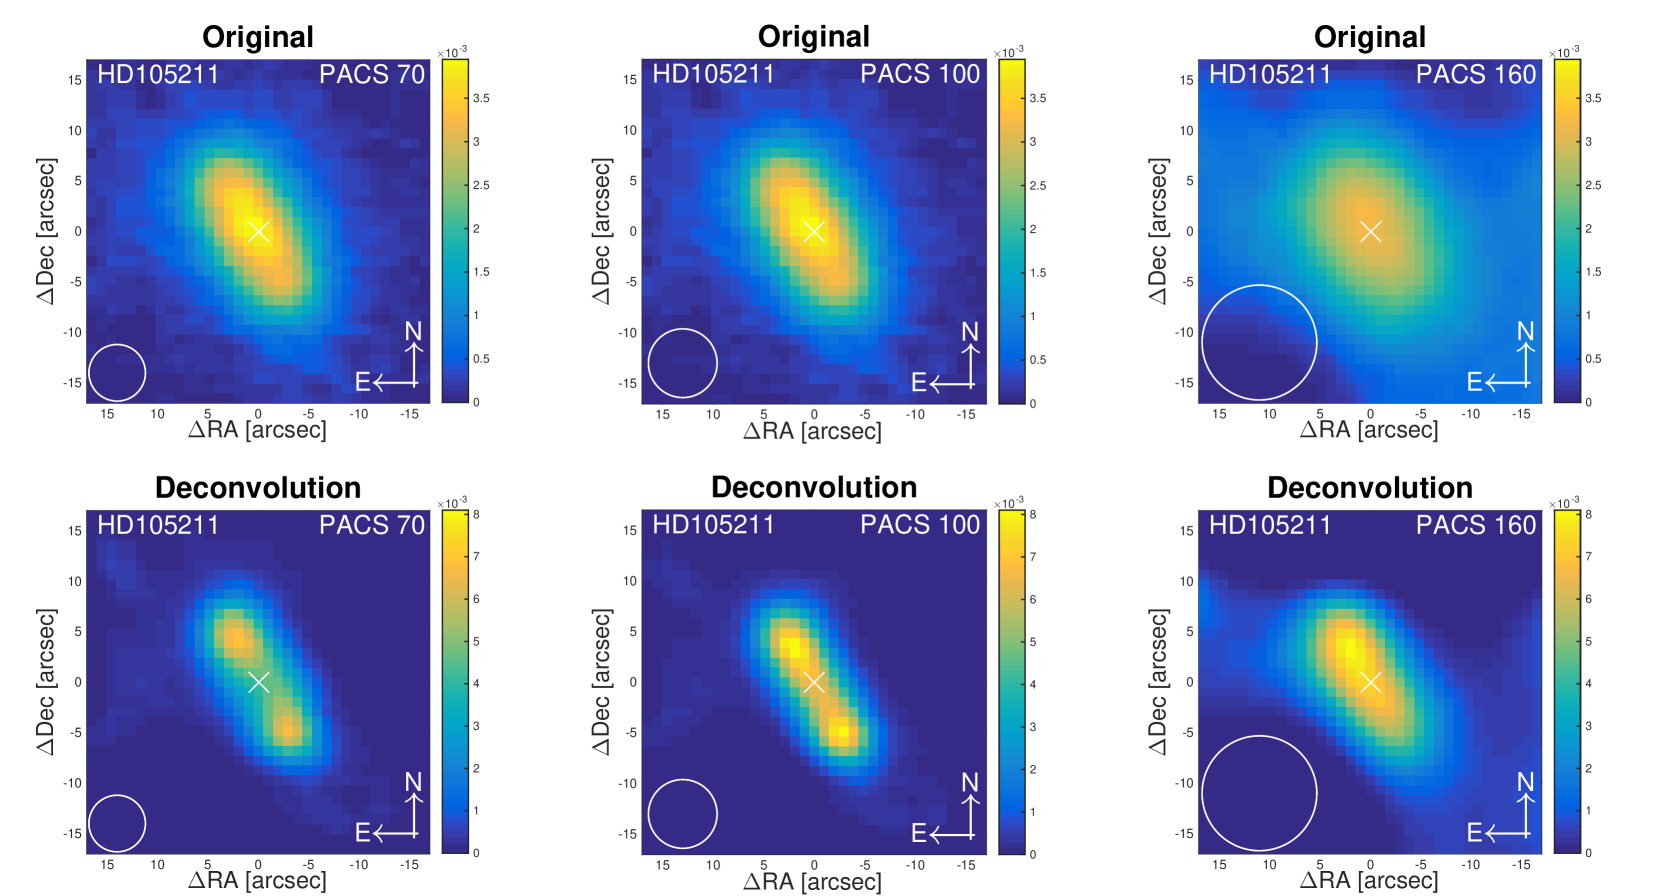
HD 105211 was resolved by the Herschel/PACS instrument (Poglitsch et al. 2010) showing the extent of the disc for wavelengths 70, 100 and 160 (see top row in Figure 2). The 70 and 100 maps were originally 1 pixel to 12, whilst the 160 map was 1 pixel to 24. All maps were scaled to 1 pixel to for subsequent analysis.
3.1.1 Stellar position
The optical position of HD 105211, at the epoch of the Herschel observations, is ; utilising the proper motions from the re-reduction of Hipparcos data (van Leeuwen 2007). Two methods were used to estimate the star’s position in the maps: finding the position of the peak pixel brightness in all maps and calculating the centre of a fitted 2D Gaussian profile, allowing for rotation and ellipticity, of the 70 and 100 maps. Fitting a 2D Gaussian to the 160 PACS map was not feasible due to background contamination surrounding HD 105211. The peak pixel and the centre of the disc profile are both within from the optical position, which is just outside the Herschel absolute pointing accuracy of at the 1- level (Sánchez-Portal et al. 2014). In the deconvolution presented here, we have assumed that the star’s position for the 70 and 100 maps is the corresponding centre of 2D Gaussian disc profile fit.
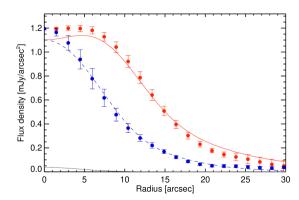
3.1.2 Radial profiles and deconvolution
In the original maps, the extent of the semi-major and -minor axes were derived from the FWHM of model 2D Gaussian profiles along the major and minor axes. In the 70 and 100 maps the extents were found to be similar, with values of 160.4 1.7 au and 91.0 0.8 au, respectively. However, the 160 map yielded a larger estimate of the disc extent along both axes of 192 32 au and 141 14 au. The disc inclination angle was determined from the inverse cosine of the ratio of the semi-minor axis to the semi-major axis. The inclination was consistent in the 70 and 100 maps at 55.4 . The inclination angle for 160 map, 42.7 , is just within the uncertainty limits when compared with the values derived in the shorter wavelength maps. This could be attributed to both the rising level of background contamination to the west of the source, and the larger PACS beam FWHM of 118 at 160 (cf 58 at 70 ), comparable to the disc extent, such that the disc is poorly resolved in the 160 image.
A reference point spread function (PSF) was used to estimate the stellar contribution to the images, and to deconvolve the original maps. Here, we have adopted a similar technique to that used in Liseau et al. (2010) and Marshall et al. (2011). Observations of the chosen reference PSF, Böotis (HD 124897, Arcturus) were reduced in the same way as the HD 105211 images and rotated to the same telescope pointing angle. The stellar photosphere contribution was modelled separately by scaling the PSF to the flux estimate corresponding to 70, 100 and 160 wavelengths of the photosphere model respectively. The stellar contribution was centred on the previously determined stellar position in each image and subtracted from the three original maps. After stellar subtraction the Lucy-Richardson method (Richardson 1972; Lucy 1974) was then used to deconvolve the original maps with the corresponding instrument PSFs (see bottom row in Figure 2).
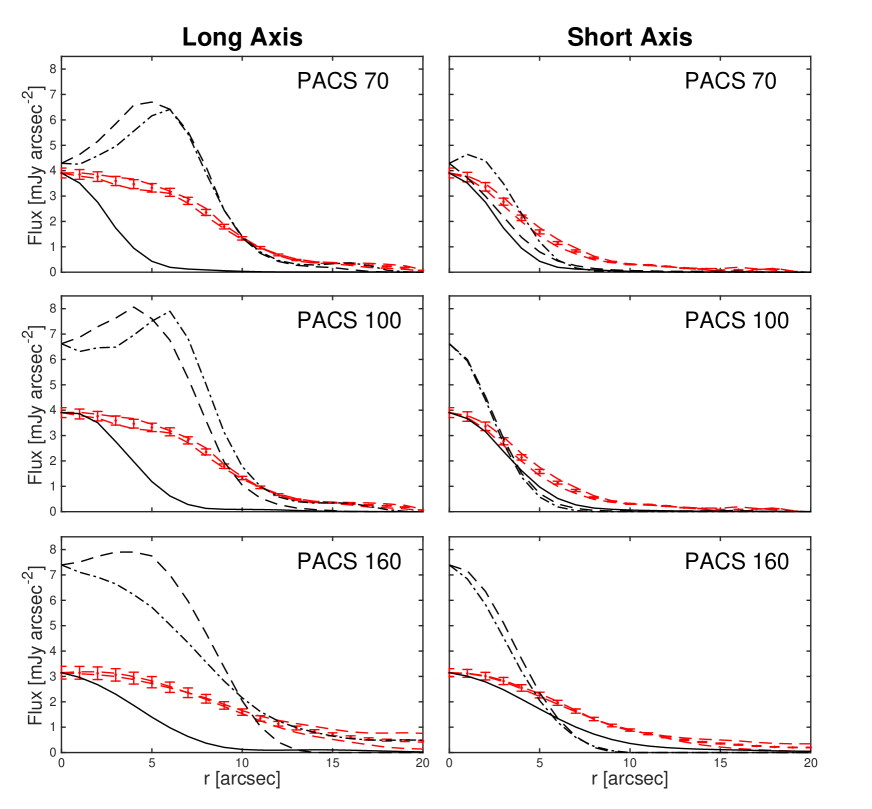
After deconvolution, the semi-major and -minor axes of the disc were determined by fitting an ellipse to the region of the map, centred on HD 105211, which exceeded a 3- threshold. These measured values are larger than the original PACS images due to the difference between the 2D Gaussian and ellipse fits. The semi-major and -minor axes were used to estimate the inclination angle, as before. The inclination angles measured in the deconvolved images are consistent with values of at 70 and at 100 . The increased size of the inclination angle from the original PACS maps can be attributed to the deconvolution resolving the axis of the disc more precisely. However, the inclination angle for 160 of is not consistent due to the poorer resolution of the original image. Radial profiles are shown in Figure 3 and a summary of associated measurements is shown in Table 4.
| 70 | 100 | 160 | |
|---|---|---|---|
| Original PACS Maps | |||
| Semi-major [″] | 8.11 0.81 | 8.12 0.81 | 9.74 1.62 |
| Semi-major [au] | 160.3 16.0 | 160.5 16.0 | 192 32 |
| Semi-minor [″] | 4.61 0.35 | 4.60 0.35 | 7.14 0.69 |
| Semi-minor [au] | 91.1 6.9 | 90.9 6.9 | 141 14 |
| Inclination Angle [°] | 55.4 5.2 | 55.5 5.1 | 42.7 8.3 |
| Position Angle [°] | 30.1 0.5 | 30.1 0.5 | – |
| Deconvolved Images | |||
| Semi-major [″] | 9.92 0.50 | 9.93 0.50 | 9.82 0.98 |
| Semi-major [au] | 196.0 9.9 | 196.2 9.9 | 194.0 19.4 |
| Semi-minor [″] | 3.38 0.17 | 3.29 0.16 | 4.90 0.49 |
| Semi-minor [au] | 66.8 3.4 | 65.0 3.2 | 96.8 9.7 |
| Inclination Angle [°] | 70.1 2.3 | 70.7 2.2 | 60.1 7.7 |
| Peak-to-Peak [″] | 10.5 0.5 | 9.9 0.5 | – |
| Peak-to-Peak [au] | 207.5 9.8 | 195.6 9.8 | – |
| NE Arm [″] | 4.70 0.2 | 4.0 0.2 | 3.4 0.3 |
| NE Arm [au] | 93 4.0 | 79 4.0 | 67 6.0 |
| SW Arm [″] | 5.8 0.3 | 5.9 0.3 | – |
| SW Arm [au] | 115 5.8 | 117 5.8 | – |
3.1.3 Asymmetry
The deconvolved images at 70 and 100 reveal distinct peaks along the NE and SW arms. The disc extent along the major-axis of the 70 and 100 deconvolutions were measured from peak-to-peak. The peak-to-peak extent was not observed in the 160 deconvolution, as there is only a peak emission along the NE arm. The NE and SW arms were measured from the star centre position to peak emission of the disc. The NW and SE extents are the half of the FWHMs of the deconvolved disc profile from star centre position. Examining the 70 and 100 deconvolutions, the NE clump is larger and closer to the star’s centre position (86.0 5.7 au) in contrast to its SW counterpart (116.0 8.2 au) but both comparable in brightness, clearly showing an asymmetry in the disc. However, the disc at 160 has no peak emission on either side of disc centre but still shows asymmetry, with a smoothly decreasing brightness profile from the NE arm to the SW arm. A summary of disc profile measurements is shown in Table 4.
3.2 Spectral energy distribution
3.2.1 Modified blackbody
The SED reveals no significant emission at mid-infrared wavelengths , as shown in Fig. 1. We therefore determine the disc observational properties of temperature, (blackbody) radial extent, and fractional luminosity (, , ) through fitting a single component, modified blackbody model to the photometry at wavelengths where a significant ( 3-) excess was measured. Due to the absence of any photometry at wavelengths beyond 160 , the break wavelength () and sub-millimetre slope () of the modified blackbody model are unconstrained and for the purposes of plotting the best-fit model we assume a break wavelength of 210 , and a of 1, as typical values for this purpose (Wyatt 2008).
A least-squares fit to the photometry weighted by the uncertainties produces a fractional luminosity of , in line with previous estimates of the disc brightness (Beichman et al. 2006b), and a best-fit temperature of K. The temperature is equivalent to a blackbody radius of au. A comparison with the resolved extent from the images (80 or 120 au) reveals that the ratio of the actual to blackbody radii, 1 to 1.5. This is surprisingly low for a star of 6.6 , as we expect a value of in the region 2.65 by following the models of Pawellek & Krivov (2015). The radiation blow-out radius for dust grains (Burns et al. 1979) around HD 105211 is 3.5 m. The small value of leads us to infer that the disc emission is therefore dominated by large, cool dust grains and that any population of smaller grains, that would be warmer at a given stellocentric distance (Krivov et al. 2008), is thus low. The HD 105211 system has not been imaged in scattered light; however, aperture polarisation observations in the optical (SDSS g′ and r′ measurements) have been made and the analysis of this data is ongoing (Cotton D. priv. comm).
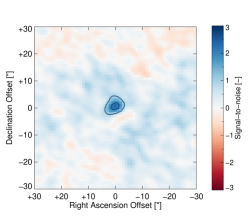
Compact residual emission centred on the star is visible in the 70 disc-subtracted image (see top right panel of Figure 4). This emission is weak, constituting a 2- detection at 70 . However, it could represent the marginal detection of a warm inner belt to the HD 105211 system. We therefore estimate the properties of this inner belt based on the available mid-infrared photometry between 24 and 37 , along the with the 70 measurement. Using an error-weighted least squares fit to these measurements, we obtain a temperature of 215 43 K (equivalent to radial distance of 4.3 1.9 au, assuming the same properties as the cold disc) with a fractional luminosity of approximately .
3.2.2 Radiative transfer
Combining the SED and resolved imaging, we now apply a more physically complex model to the available data. Here we simultaneously fit the extended emission and SED with a radiative transfer model using a power law size distribution of dust grains assuming a dust composition of astronomical silicate (Draine 2003). The debris disc is assumed to lie at some distance from the star in an annulus between and , where was constrained to lie between 50 and 150 au, and was a free parameter. The exponent of the surface density of the disc was allowed to vary between 2.0 and -5.0. As noted in the previous section there was some evidence for an asymmetry in the disc from the deconvolved images; here we assumed an axisymmetric model in the first instance. The constituent grains are represented by a power law size distribution between , a free parameter, and , which is fixed at 1 mm, with an exponent . Due to the lack of sub-millimetre photometry, we assumed the value of lies in the range 3 to 4, typical of the theoretically expected (Dohnanyi 1969; Pan & Sari 2005; Gáspár et al. 2012; Pan & Schlichting 2012) and observed (Ricci et al. 2015; MacGregor et al. 2016) values for debris disc systems.
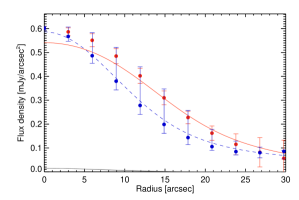
The brightness profiles of the disc along its major and minor axes for all three PACS images were used to represent the resolved emission in the fitting process. The profiles were measured as described in Section 3.1.2. For the weighting of the fit, each image was given equal weighting to the SED in determining the best-fit (i.e. the SED and each image each contribute 25 per cent of the best-fit).
We found a simultaneous best fit model to the images and SED with a reduced of 1.61 (six free parameters). The inner edge of the disc lies at au, close to the blackbody radius inferred for the disc. The disc was found to be broad, au, with an outwardly decreasing radial surface density exponent . The minimum dust grain size was calculated to be , mostly dictated by the fit to the rising Spitzer IRS spectrum; this is perhaps surprising given how close the disc inner edge lies to the blackbody radius. The exponent of the size distribution , lies within the assumed range, and is consistent with theoretical expectations assuming a velocity dependent dispersion of collision fragments (Pan & Schlichting 2012). A dust mass of is inferred from the model, but the validity of this model-derived value is highly uncertain in the absence of sub-millimetre photometry. The results of the modelling are summarised in Table 5.
| Parameter | Range | Distribution | Fit |
|---|---|---|---|
| (au) | 50 – 150 | Linear | |
| (au) | 10 – 100 | Linear | 100 |
| 2.0 – -5.0 | Linear | ||
| () | 1.0 – 30.0 | Logarithmic | |
| () | Fixed | n/a | 1000 |
| 3.0 – 4.0 | Linear | ||
| Composition | astron. sil. | Fixed | — |
| () | Free | n/a | |
| Free | n/a | 1.61 |
In Figure 4, we present the residual emission after subtraction of the disc model from the observations. Overall the model replicates the observations well, with no significant residual flux at the disc position in any of the three images. This is interesting given the potential asymmetry inferred from the deconvolved images. In this instance, the evidence lies with an axisymmetric disc capable of replicating both the structure and thermal emission of the disc, such that we cannot confirm the presence of asymmetry in the disc with the data to hand.
However, at 70 µm, a 2- peak is present at the stellar position. The model brightness profile has a deficit of flux compared to the observations close to the stellar position (see top left panel of Figure 4), this could be used to infer the presence of an additional, unresolved warm component to the disc. A two component model was previously used to fit the Spitzer IRS spectrum in Mittal et al. (2015), but the SED shows no significant remaining excess emission that would require the presence of an additional disc component (see Figure 1), so we opted not to include one in our analysis. Radial drift of material from the outer belt toward the star could account for the presence of this faint emission.
3.3 CL Cru
| Wavelength | Flux |
|---|---|
| [Jy] | |
| 70 | 0.558 0.040 |
| 100 | 0.297 0.023 |
| 160 | 0.155 0.024 |
The Mira variable star CL Cru (IRAS 12043-6417) is clearly visible in the 70 and 100 PACS mosaics, lying in the northwest corner, but is barely detected in the 160 mosaic. Note, this object is not visible in in Figure 2 as it lies outside the cropped region presented there. Its flux measurements are included here as they may be of interest to those involved in research on evolved stars. Circular apertures of 4, 5, and radius were used to measure the fluxes at 70, 100 and 160 , respectively. The background contribution and uncertainty was estimated from a annulus spanning 15 to from the source. CL Cru has no evidence of extended emission, based on a 2D Gaussian fit to the source, and we therefore extract the fluxes with radii for optimal signal-to-noise. The measurements were aperture corrected, with correction factors of 0.487, 0.521 and 0.527 (Balog et al. 2014) for the 70, 100 and 160 measurements, respectively. At 70 and 100 the noise is dominated by the calibration uncertainty, whereas at 160 the sky noise is the dominant contribution. The aperture corrected (but not colour corrected) flux density measurements are given in Table 6.
4 Discussion
Here we place the results of our analysis into context, and examine the origins and implications for a potential asymmetry of the disc around HD 105211.
4.1 State of the disc
The radiative transfer model determined that the minimum grain size for the disc (assuming a composition of pure astronomical silicate) was . This result is only marginally larger than the blowout size for grains in the disc. This is unexpected due to the extent of the disc determined from the resolved images and SED fitting being au, close to the blackbody radius of 80 au, such that we would perhaps expect a larger minimum grain size to account for such a low ratio in measured to blackbody radii.
Additionally, the ratio of observed radius to the blackbody radius of the disc () is smaller than the expected ratio of 2.5 when correlated with stellar luminosity (Pawellek & Krivov 2015). HD 105211’s debris disc has been previously noted as being bright in thermal emission for its age ( Gyr, Kains et al. 2011) when compared to the expected trends for Sun-like stars (e.g. Spangler et al. 2001; Decin et al. 2003). We therefore have a sketch of the disc around HD 105211 as being both bright (albeit not anomalously so) with large dust grains similar in size found in HD 207129 (Marshall et al. 2011; Löhne et al. 2012). The inner edge of the disc is close to the minimum (blackbody) extent with a broad disc component of about 100 au. The inferred disc extent (down to the blackbody radius) requires a minimum grain size above the blow-out radius for the star’s luminosity. The large dust grains will likely be broken down into smaller, warmer fragments that could persist around HD 105211. These fragments would then migrate inward by radiation transport processes, which could account for the marginal excess seen in the 70 image.
4.2 Potential asymmetry
The deconvolved images revealed an asymmetry in the separation of the two ansae from the stellar position, but the structure and emission from the disc around HD 105211 can be effecitvely replicated with a single, axisymmetric annulus. We do not therefore propose that the disc is asymmetric, but here investigate the possibilities of such an asymmetry, and discuss future directions to refine our understanding of the disc architecture.
Asymmetries are often cited as the result of perturbation by an unseen planetary companion influencing the dynamics of the dust-producing planetesimals (e.g. Chiang et al. 2009; Faramaz et al. 2014; Thilliez & Maddison 2016). The disc asymmetry is observed to be brighter at longer wavelengths on the side closer to the star, which suggests the dust there is colder, perhaps due to trapping of larger grains by a perturbing body. Additional observations at higher angular resolution in the far-infrared to fill in the SED between the Spitzer and Herschel photometry would be invaluable in pinning down the location of the star relative to the disc, and determining if a second warm component is present in the inner regions of the disc.
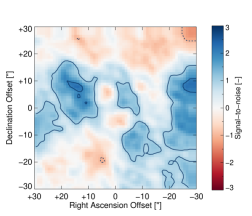
There are other possible scenarios to explain the presence of an asymmetry. Given HD 105211’s location, lying close to the galactic plane (), background contamination along the line of sight could offer an explanation. Bright, extended emission is present across the images, particularly at 160 , but there is little at either 70 or 100 where the asymmetry is most obvious. Additionally, a background point source would need to have a flux 50 mJy, lying at a separation of (along the semi-major axis) from the star to replicate the observed asymmetry. Considering extragalactic contamination (Sibthorpe et al. 2013), the binomial probability of such an occurence is low () and should therefore give us confidence in the real presence of the asymmetry. However, HD 105211 lies close to the galactic plane and such estimates, based on galaxy counts, should be considered a lower limit in such a scenario.
Alternatively, interaction between the disc and interstellar medium might also induce an asymmetry, as has been seen for a number of systems resolved in scattered light (e.g. HD 15115, HD 61005; Rodigas et al. 2012; Maness et al. 2009; Schneider et al. 2014).
Obtaining more observations at sub-millimetre wavelengths of HD 105211 would enable the size distribution of grains and their mass to be precisely determined; and these derived values used in combination would confirm the disc’s asymmetry. This would also clarify if it is exclusive to smaller grains that are susceptible to radiation pressure and stellar winds or if it persists for larger grains that more accurately trace the parent planetesimal belts of the disc.
4.3 Comparison with Dodson-Robinson et al.
Our analysis of HD 105211 is generally consistent with the results of Dodson-Robinson et al. (2016). However, we differ in several of the particulars. We note that our single component model, while broad, matches the detected excesses measured from Spitzer IRS through Herschel wavebands, as shown in Figure 4. Most importantly, we find no evidence for significant warm excess emission from the system at 24 m. This is likely due to the different photometry used to scale the stellar photosphere models in each work; as Dodson-Robinson et al. (2016) used 2MASS (which are of poor quality) and AllWISE data (which suffered saturation not present in the all-sky survey). The lack of significant warm excess in our analysis led us to adopt a single component disc model, leading to the result that we require a broad disc to replicate both the SED and radial profiles. Dodson-Robinson et al. (2016), with the freedom of an additional dust component, found the outer disc to be more narrowly confined at a larger radial distance (175 20 au). The validity of both models can be tested by observations at high spatial resolution by ALMA (which will resolve the width of the outer cool component) and JWST (searching for a distinct warm component).
Dodson-Robinson et al. (2016) also determined a smaller flux density for HD 105211 at 160 m (440 146 mJy) than in this work. There is significant contamination from bright extended structure within the image at 160 m, so the determination of the correct flux is fraught with difficulty. We note that our values are consistent within uncertainties and that obtaining longer wavelength observations, either from SOFIA/HAWC+ at 210 m, or ALMA in the sub-millimetre would better determine the shape of the SED and confirm whether or not the disc emission had deviated from a blackbody at 160 m.
5 Conclusion
HD 105211 is nearby star (d = 19.76 0.05 pc) and slightly more massive and more luminous than the Sun. It was reported to exhibit significant infrared excess by Spitzer. In this work, we have presented new Herschel/PACS far-infrared observations of the debris disc around HD 105211 at 70, 100 and 160 . These images revealed extended emission from the disc along both its semi-major and semi-minor axes in all three wavebands, from which we determine the disc to have an inclination of 71 and a position angle of 30 .
Of particular interest is the presence of an intriguing asymmetry between the two sides of the disc after deconvolution, interpreted as ansae lying at 86 5.7 au and 116 8.2 au, from which we infer a disc eccentricity of 0.20 0.03. However, the asymmetry could not be considered significant when we modelled the structure and thermal emission of the disc and found that the disc was broad, 100 20 au, starting at an inner edge of 87 2.5 au. The star’s location close to the galactic plane makes contamination a possibility, requiring further observation at higher angular resolution and longer wavelengths to better determine the architecture of this disc.
Combining the disc SED with the multi-wavelength resolved images we fitted a power law disc model and derived a minimum grain size of , assuming the disc lies in a single annulus around the star. The lack of any constraint on the sub-millimetre emission from the disc leaves the grain size distribution unconstrained in our model, again pointing the way to further observations to determine the dust properties for this system.
Acknowledgements
The authors wish to thank the anonymous referee for their feedback, which improved the clarity of this paper. They would also like to thank S. Dodson-Robinson for the use of her Herschel observing programme that included HD 105211. This research has made use of the SIMBAD database, operated at CDS, Strasbourg, France. This research has made use of the VizieR catalogue access tool, CDS, Strasbourg, France. The research has made use of NASA’s Astrophysics Data System. JPM is supported by a UNSW Vice-Chancellor’s Postdoctoral Fellowship.
References
- Allende Prieto & Lambert (1999) Allende Prieto C., Lambert D. L., 1999, A&A, 352, 555
- Ammler-von Eiff & Reiners (2012) Ammler-von Eiff M., Reiners A., 2012, A&A, 542, A116
- Aumann & Good (1990) Aumann H. H., Good J. C., 1990, ApJ, 350, 408
- Aumann et al. (1984) Aumann H. H., et al., 1984, ApJ, 278, L23
- Backman & Paresce (1993) Backman D. E., Paresce F., 1993, in Levy E. H., Lunine J. I., eds, Protostars and Planets III. pp 1253–1304
- Ballering et al. (2014) Ballering N. P., Rieke G. H., Gáspár A., 2014, ApJ, 793, 57
- Balog et al. (2014) Balog Z., et al., 2014, Experimental Astronomy, 37, 129
- Beichman et al. (2006a) Beichman C. A., et al., 2006a, ApJ, 639, 1166
- Beichman et al. (2006b) Beichman C. A., et al., 2006b, ApJ, 652, 1674
- Booth et al. (2013) Booth M., et al., 2013, MNRAS, 428, 1263
- Bryden et al. (2013) Bryden G., et al., 2013, in American Astronomical Society Meeting Abstracts #221. p. 144.24
- Burns et al. (1979) Burns J. A., Lamy P. L., Soter S., 1979, Icarus, 40, 1
- Carpenter et al. (2009) Carpenter J. M., et al., 2009, ApJS, 181, 197
- Castelli & Kurucz (2004) Castelli F., Kurucz R. L., 2004, ArXiv Astrophysics e-prints,
- Chen et al. (2006) Chen C. H., et al., 2006, ApJS, 166, 351
- Chen et al. (2009) Chen C. H., Sheehan P., Watson D. M., Manoj P., Najita J. R., 2009, ApJ, 701, 1367
- Chen et al. (2014) Chen C. H., Mittal T., Kuchner M., Forrest W. J., Lisse C. M., Manoj P., Sargent B. A., Watson D. M., 2014, ApJS, 211, 25
- Chiang et al. (2009) Chiang E., Kite E., Kalas P., Graham J. R., Clampin M., 2009, ApJ, 693, 734
- Decin et al. (2003) Decin G., Dominik C., Waters L. B. F. M., Waelkens C., 2003, ApJ, 598, 636
- Dodson-Robinson et al. (2016) Dodson-Robinson S. E., Su K. Y. L., Bryden G., Harvey P. M., Green J. D., 2016, preprint, (arXiv:1610.01173)
- Dohnanyi (1969) Dohnanyi J. S., 1969, J. Geophys. Res., 74, 2531
- Draine (2003) Draine B. T., 2003, ApJ, 598, 1017
- Duchêne et al. (2014) Duchêne G., et al., 2014, ApJ, 784, 148
- ESA (1997) ESA 1997, VizieR Online Data Catalog, 1239, 0
- Egan et al. (2003) Egan M., et al., 2003, Air Force Research Laboratory Technical Report AFRL-VS-TR-2003-1589, pp 1–83
- Eiroa et al. (2013) Eiroa C., et al., 2013, A&A, 555, A11
- Epchtein et al. (1985) Epchtein N., et al., 1985, A&AS, 61, 203
- Ertel et al. (2014) Ertel S., et al., 2014, A&A, 561, A114
- Faramaz et al. (2014) Faramaz V., et al., 2014, A&A, 563, A72
- Feltzing et al. (2001) Feltzing S., Holmberg J., Hurley J. R., 2001, VizieR Online Data Catalog, 337
- Fujiwara et al. (2013) Fujiwara H., et al., 2013, A&A, 550, A45
- Gáspár et al. (2012) Gáspár A., Psaltis D., Rieke G. H., Özel F., 2012, ApJ, 754, 74
- Gray et al. (2006) Gray R. O., Corbally C. J., Garrison R. F., McFadden M. T., Bubar E. J., McGahee C. E., O’Donoghue A. A., Knox E. R., 2006, AJ, 132, 161
- Greaves et al. (2014) Greaves J. S., et al., 2014, ApJ, 791, L11
- Habing et al. (2001) Habing H. J., et al., 2001, A&A, 365, 545
- Harper et al. (1984) Harper D. A., Loewenstein R. F., Davidson J. A., 1984, ApJ, 285, 808
- Hauck & Mermilliod (1998) Hauck B., Mermilliod M., 1998, A&AS, 129, 431
- Houck et al. (2004) Houck J. R., et al., 2004, ApJS, 154, 18
- Ibukiyama & Arimoto (2002) Ibukiyama A., Arimoto N., 2002, VizieR Online Data Catalog, 339
- Ishihara et al. (2010) Ishihara D., et al., 2010, A&A, 514, A1
- Joergensen et al. (1971) Joergensen H. E., Johansen K. T., Olsen E. H., 1971, A&A, 12, 223
- Kains et al. (2011) Kains N., Wyatt M. C., Greaves J. S., 2011, preprint, (arXiv:1102.4341)
- Kennedy & Wyatt (2013) Kennedy G. M., Wyatt M. C., 2013, MNRAS, 433, 2334
- Kennedy & Wyatt (2014) Kennedy G. M., Wyatt M. C., 2014, MNRAS, 444, 3164
- Kennedy et al. (2014) Kennedy G. M., et al., 2014, MNRAS, 438, 3299
- Krivov (2010) Krivov A. V., 2010, Research in Astronomy and Astrophysics, 10, 383
- Krivov et al. (2008) Krivov A. V., Müller S., Löhne T., Mutschke H., 2008, ApJ, 687, 608
- Lagrange et al. (2000) Lagrange A.-M., Backman D. E., Artymowicz P., 2000, Protostars and Planets IV, p. 639
- Lebouteiller et al. (2011) Lebouteiller V., Barry D. J., Spoon H. W. W., Bernard-Salas J., Sloan G. C., Houck J. R., Weedman D. W., 2011, ApJS, 196, 8
- Liseau et al. (2010) Liseau R., et al., 2010, A&A, 518, L132
- Lissauer (1993) Lissauer J. J., 1993, ARA&A, 31, 129
- Löhne et al. (2008) Löhne T., Krivov A. V., Rodmann J., 2008, ApJ, 673, 1123
- Löhne et al. (2012) Löhne T., et al., 2012, A&A, 537, A110
- Lucy (1974) Lucy L. B., 1974, AJ, 79, 745
- MacGregor et al. (2016) MacGregor M. A., et al., 2016, ApJ, 823, 79
- Maldonado et al. (2012) Maldonado J., Eiroa C., Villaver E., Montesinos B., Mora A., 2012, A&A, 541, A40
- Maldonado et al. (2015) Maldonado J., Eiroa C., Villaver E., Montesinos B., Mora A., 2015, A&A, 579, A20
- Maness et al. (2009) Maness H. L., et al., 2009, ApJ, 707, 1098
- Marsakov & Shevelev (1995) Marsakov V. A., Shevelev Y. G., 1995, VizieR Online Data Catalog, 5089
- Marshall et al. (2011) Marshall J. P., et al., 2011, A&A, 529, A117
- Marshall et al. (2014a) Marshall J. P., et al., 2014a, A&A, 565, A15
- Marshall et al. (2014b) Marshall J. P., et al., 2014b, A&A, 570, A114
- Marshall et al. (2016) Marshall J. P., Booth M., Holland W., Matthews B. C., Greaves J. S., Zuckerman B., 2016, MNRAS, 459, 2893
- Mason et al. (2001) Mason B. D., Wycoff G. L., Hartkopf W. I., Douglass G. G., Worley C. E., 2001, AJ, 122, 3466
- Matthews et al. (2014a) Matthews B. C., Krivov A. V., Wyatt M. C., Bryden G., Eiroa C., 2014a, Protostars and Planets VI, pp 521–544
- Matthews et al. (2014b) Matthews B., Kennedy G., Sibthorpe B., Booth M., Wyatt M., Broekhoven-Fiene H., Macintosh B., Marois C., 2014b, ApJ, 780, 97
- Meyer et al. (2002) Meyer M. R., et al., 2002, in Alves J. F., McCaughrean M. J., eds, The Origin of Stars and Planets: The VLT View. p. 463 (arXiv:astro-ph/0109038), doi:10.1007/10856518˙60
- Mittal et al. (2015) Mittal T., Chen C. H., Jang-Condell H., Manoj P., Sargent B. A., Watson D. M., Lisse C. M., 2015, ApJ, 798, 87
- Montesinos et al. (2016) Montesinos B., et al., 2016, A&A, 593, A51
- Morales et al. (2011) Morales F. Y., Rieke G. H., Werner M. W., Bryden G., Stapelfeldt K. R., Su K. Y. L., 2011, ApJ, 730, L29
- Morales et al. (2013) Morales F. Y., Bryden G., Werner M. W., Stapelfeldt K. R., 2013, ApJ, 776, 111
- Morel & Magnenat (1978) Morel M., Magnenat P., 1978, A&AS, 34, 477
- Moro-Martín et al. (2015) Moro-Martín A., et al., 2015, ApJ, 801, 143
- Nesvorný et al. (2010) Nesvorný D., Jenniskens P., Levison H. F., Bottke W. F., Vokrouhlický D., Gounelle M., 2010, ApJ, 713, 816
- Neugebauer et al. (1984) Neugebauer G., et al., 1984, ApJ, 278, L1
- Nordstrom et al. (2004) Nordstrom B., et al., 2004, VizieR Online Data Catalog, 5117
- Oliveira et al. (2011) Oliveira I., Olofsson J., Pontoppidan K. M., van Dishoeck E. F., Augereau J.-C., Merín B., 2011, ApJ, 734, 51
- Ott (2010) Ott S., 2010, in Mizumoto Y., Morita K.-I., Ohishi M., eds, Astronomical Society of the Pacific Conference Series Vol. 434, Astronomical Data Analysis Software and Systems XIX. p. 139 (arXiv:1011.1209)
- Pan & Sari (2005) Pan M., Sari R., 2005, Icarus, 173, 342
- Pan & Schlichting (2012) Pan M., Schlichting H. E., 2012, ApJ, 747, 113
- Panić et al. (2013) Panić O., et al., 2013, MNRAS, 435, 1037
- Pawellek & Krivov (2015) Pawellek N., Krivov A. V., 2015, MNRAS, 454, 3207
- Pawellek et al. (2014) Pawellek N., Krivov A. V., Marshall J. P., Montesinos B., Ábrahám P., Moór A., Bryden G., Eiroa C., 2014, ApJ, 792, 65
- Pilbratt et al. (2010) Pilbratt G. L., et al., 2010, A&A, 518, L1
- Poglitsch et al. (2010) Poglitsch A., et al., 2010, A&A, 518, L2
- Popesso et al. (2012) Popesso P., et al., 2012, preprint, (arXiv:1211.4257)
- Ribas et al. (2014) Ribas Á., Merín B., Bouy H., Maud L. T., 2014, A&A, 561, A54
- Ricci et al. (2015) Ricci L., Maddison S. T., Wilner D., MacGregor M. A., Ubach C., Carpenter J. M., Testi L., 2015, ApJ, 813, 138
- Richardson (1972) Richardson W. H., 1972, Journal of the Optical Society of America, 63, 55
- Rieke et al. (2004) Rieke G. H., et al., 2004, ApJS, 154, 25
- Roberge et al. (2013) Roberge A., et al., 2013, ApJ, 771, 69
- Rodigas et al. (2012) Rodigas T. J., et al., 2012, ApJ, 752, 57
- Rodriguez & Zuckerman (2012) Rodriguez D. R., Zuckerman B., 2012, ApJ, 745, 147
- Sánchez-Portal et al. (2014) Sánchez-Portal M., et al., 2014, Experimental Astronomy, 37, 453
- Schneider et al. (2014) Schneider G., et al., 2014, AJ, 148, 59
- Sibthorpe et al. (2013) Sibthorpe B., Ivison R. J., Massey R. J., Roseboom I. G., van der Werf P. P., Matthews B. C., Greaves J. S., 2013, MNRAS, 428, L6
- Spangler et al. (2001) Spangler C., Sargent A. I., Silverstone M. D., Becklin E. E., Zuckerman B., 2001, ApJ, 555, 932
- Su et al. (2006) Su K. Y. L., et al., 2006, ApJ, 653, 675
- Thilliez & Maddison (2016) Thilliez E., Maddison S. T., 2016, MNRAS, 457, 1690
- Thureau et al. (2014) Thureau N. D., et al., 2014, MNRAS, 445, 2558
- Turon et al. (1993) Turon C., et al., 1993, Bulletin d’Information du Centre de Donnees Stellaires, 43
- Vitense et al. (2012) Vitense C., Krivov A. V., Kobayashi H., Löhne T., 2012, A&A, 540, A30
- Werner et al. (2004) Werner M. W., et al., 2004, ApJS, 154, 1
- Williams & Cieza (2011) Williams J. P., Cieza L. A., 2011, ARA&A, 49, 67
- Wittenmyer & Marshall (2015) Wittenmyer R. A., Marshall J. P., 2015, AJ, 149, 86
- Wright et al. (2010) Wright E. L., et al., 2010, AJ, 140, 1868
- Wyatt (2008) Wyatt M. C., 2008, ARA&A, 46, 339
- Wyatt et al. (2007) Wyatt M. C., Smith R., Greaves J. S., Beichman C. A., Bryden G., Lisse C. M., 2007, ApJ, 658, 569
- Wyatt et al. (2012) Wyatt M. C., et al., 2012, MNRAS, 424, 1206
- Wyatt et al. (2015) Wyatt M. C., Panić O., Kennedy G. M., Matrà L., 2015, Ap&SS, 357, 103
- Zuckerman (1993) Zuckerman B., 1993, in Phillips J. A., Thorsett S. E., Kulkarni S. R., eds, Astronomical Society of the Pacific Conference Series Vol. 36, Planets Around Pulsars. pp 303–315
- van Leeuwen (2007) van Leeuwen F., 2007, A&A, 474, 653