Continuum limit of the vibrational properties of amorphous solids
Abstract
The low-frequency vibrational and low-temperature thermal properties of amorphous solids are markedly different from those of crystalline solids. This situation is counter-intuitive because any solid material is expected to behave as a homogeneous elastic body in the continuum limit, in which vibrational modes are phonons following the Debye law. A number of phenomenological explanations have been proposed, which assume elastic heterogeneities, soft localized vibrations, and so on. Recently, the microscopic mean-field theories have been developed to predict the universal non-Debye scaling law. Considering these theoretical arguments, it is absolutely necessary to directly observe the nature of the low-frequency vibrations of amorphous solids and determine the laws that such vibrations obey. Here, we perform an extremely large-scale vibrational mode analysis of a model amorphous solid. We find that the scaling law predicted by the mean-field theory is violated at low frequency, and in the continuum limit, the vibrational modes converge to a mixture of phonon modes following the Debye law and soft localized modes following another universal non-Debye scaling law.
I Introduction
The low-frequency vibrational and low-temperature thermal properties of amorphous solids have been a long-standing mystery in condensed matter physics. Crystals follow universal laws, which are explained in terms of phonons Kittel (1996); Leibfried and Breuer (1978). Debye theory and phonon-gas theory predict that the vibrational density of states (vDOS) follows , the heat capacity follows , and the thermal conductivity follows in three-dimensional systems, which indeed agree with experimental results ( is frequency, and is temperature). Similarly, amorphous solids are characterized by universal laws; however, these laws are anomalous with respect to those of crystalline solids Phillips (1981). At K, the heat capacity of amorphous solids becomes larger than the value for crystalline solids Zeller and Pohl (1971), which directly reflects the excess vibrational modes around THz Buchenau et al. (1984), often referred to as the boson peak (BP). At K, the thermal conductivity increases as rather than Zeller and Pohl (1971), indicating that the vibrational modes are not phonons even at very low frequency THz (one order of magnitude lower than ). These behaviours are highly counter-intuitive because any solid material, not only crystalline but also amorphous, is expected to behave as a homogeneous elastic medium in the continuum limit, and its vibrational modes are expected to converge to phonons Tanguy et al. (2002); Monaco and Mossa (2009).
A number of theoretical explanations for these anomalies have been proposed, and these explanations substantially differ. One approach Marruzzo et al. (2013a, b); Mizuno et al. (2013a, 2014); Gelin et al. (2016) assumes that an inhomogeneity in the mechanical response at the nanoscale Yoshimoto et al. (2004); Tsamados et al. (2009); Mizuno et al. (2013b) plays the central role. In this approach, the heterogeneous elasticity equation is solved using the effective medium technique to predict the boson peak and anomalous acoustic excitations Marruzzo et al. (2013a, b).
Another approach is the so-called soft potential model Karpov et al. (1983); Buchenau et al. (1991, 1992); Gurevich et al. (2003), which is an extension of the famous tunnelling two-level systems model Anderson et al. (1972). This theory assumes soft localized vibrations to explain the anomalous thermal conductivity and the emergence of the boson peak. Soft localized vibrations have been numerically observed in a wide variety of model amorphous solids Mazzacurati et al. (1996); Taraskin and Elliott (1999); Schober and Ruocco (2004); Xu et al. (2010); Lerner et al. (2016) and in the Heisenberg spin-glass Baity-Jesi et al. (2015). Interestingly, these localized modes are also argued to affect the dynamics of supercooled liquids Widmer-Cooper et al. (2008) and the yielding of glasses Maloney and Lemaître (2006).
Recently, a quite different scenario has been emerging. This scenario is based on studies of the simplest model of amorphous solids O’Hern et al. (2003), which is randomly jammed particles at zero temperature interacting through the pairwise potential,
| (1) |
where is the Heaviside step function and is the diameter of the particles. When the packing pressure is lowered, the particles lose their contacts at zero pressure , which is called the (un)jamming transition O’Hern et al. (2003).
Importantly, the mean-field theory analysis of this model is now advancing considerably, providing a new way to understand the anomalies of amorphous solids Wyart et al. (2005a, b); Parisi and Zamponi (2010); Wyart (2010); Berthier et al. (2011); Wyart (2012); DeGiuli et al. (2014); Charbonneau et al. (2014a, b); Franz et al. (2015); Biroli and Urbani (2016). Previous theoretical Wyart et al. (2005a, b) and numerical Silbert et al. (2005, 2009) works have clearly established that the vDOS of this model exhibits a characteristic plateau at , where is the onset frequency of this plateau. The relevant region for the low-frequency anomalies of amorphous solids is below this plateau, . First, the effective medium theory assuming marginal stability, i.e., that the system is close to the elastic instability, predicts the characteristic behaviour of the vDOS at Wyart (2010); DeGiuli et al. (2014). This prediction differs from the prediction of Debye theory because the prefactor is considerably larger than the Debye level . Thus, this prediction provides a new explanation of the boson peak in terms of marginal stability Wyart (2010); DeGiuli et al. (2014). Second, the model is analysed using the replica theory Parisi and Zamponi (2010); Berthier et al. (2011); Charbonneau et al. (2014a, b); Franz et al. (2015); Biroli and Urbani (2016). This theory becomes exact in infinite dimensions Charbonneau et al. (2014a); thus, it can be a firm starting point for considering the problem. The theory predicts that the transition from the normal glass to the marginally stable glass occurs at a finite pressure , which is called the Gardner transition Biroli and Urbani (2016). Near the Gardner transition, the theory predicts non-Debye scaling of the vDOS at Franz et al. (2015), which perfectly coincides with the prediction from the effective medium theory. Remarkably, in the marginally stable glass phase, the region of this scaling law extends down to , which means no Debye regime even in the continuum limit (the limit of ) Franz et al. (2015). This non-Debye scaling law was recently shown to work at least near Charbonneau et al. (2016).
Considering these different theoretical arguments, it is absolutely necessary to numerically observe the nature of the low-frequency vibrations of amorphous solids and determine the laws that such vibrations obey. This task is not as easy as it sounds because the lower the frequency that we require, the larger the system that we need to simulate. Here, we perform a vibrational mode analysis of the model amorphous solid defined by Eq. (1), composed of up to millions of particles (), which enables us to access extremely low-frequency modes even far below . Then, we investigate the nature of the modes in detail by calculating several different parameters. Notably, we find that the non-Debye scaling is violated at low frequency, and in the continuum limit, the vibrational modes converge to a mixture of phonon modes following the Debye law and soft localized modes following another universal non-Debye scaling law, the scaling law, which was recently first observed in Refs. Lerner et al. (2016); Baity-Jesi et al. (2015) by suppressing the effects of phonons.
II Methods
II.1 System description
We study three-dimensional (3D, ) and two-dimensional (2D, ) model amorphous solids, which are composed of randomly jammed particles O’Hern et al. (2003). Particles interact via a finite-range, purely repulsive, harmonic potential [Eq. (1)], where is the distance between the two particles. The 3D system is mono-disperse with a diameter of , whereas the 2D system is a - binary mixture with a size ratio of (the diameter of the smaller species is denoted by ). The particle mass is . Length, mass, and time are measured in units of , , and , respectively. To access low-frequency vibrational modes, we consider several different system sizes (number of particles), ranging from relatively small to extremely large . We always remove the rattler particles that have less than contacting particles.
Mechanically stable amorphous packings are generated for a range of packing pressures from to . We first place particles at random in a cubic (3D) or a square (2D) box with periodic boundary conditions in all directions. The system is then quenched to a minimum energy state. Finally, the packing fraction is adjusted by compressive deformation (CO) until a target pressure is reached. We also study the shear-stabilized (SS) system Dagois-Bohy et al. (2012) by minimizing the energy with respect to the shear degrees of freedom. No differences between the CO and the SS systems have been confirmed for our systems of . In this paper we present the results obtained from the CO system.
In the packings obtained using the above protocol, the inter-particle forces are always positive . For this reason, we refer to this original state as the stressed system. In addition to the stressed system, we also studied the unstressed system, where we retain the stiffness but drop the force in the analysis. Since the positive forces make the system mechanically unstable, dropping the forces makes the original stressed system more stable Wyart et al. (2005b); DeGiuli et al. (2014); Lerner et al. (2014).
II.2 Vibrational mode analysis
We have performed the standard vibrational mode analysis Kittel (1996); Leibfried and Breuer (1978); we have solved the eigen-value problem of the dynamical matrix ( matrix) to obtain the eigen value and the eigen vector for the modes ( zero-, translational modes are removed). Here the eigen vectors are orthonormalized as , where is the Kronecker delta function.
From the dataset of eigen frequencies, (), we calculate the vDOS as
| (2) |
where is the Dirac delta function.
In this work we analysed several different system sizes of to . We first calculated all the vibrational modes in the system of . We then calculated only the low-frequency modes in the larger systems of . Finally the modes obtained from different system sizes were put together as a function of the frequency . We found that the results from different system sizes smoothly connect with each other, which provide the modes information in a wide frequency regime. The vDOS was calculated from these dataset, and also the results of these different system sizes are presented altogether in the figures.
The present system exhibits a characteristic plateau in at ; is defined as the onset frequency of this plateau (see the Supplemental Information, Fig. S1) Silbert et al. (2005, 2009). Practically, we determined the value of as the boson peak position of the unstressed system Wyart et al. (2005b); Mizuno et al. (2016).
II.3 Phonon and Debye vDOS
In an isotropic elastic medium, phonons are described as Kittel (1996); Leibfried and Breuer (1978),
| (3) |
is the wave vector, and . Due to the periodic boundary condition of the finite dimension , is discretized as for 3D and as for 2D ( are integers). The value of denotes one longitudinal () and two transverse () modes for 3D, and it denotes one longitudinal () and one transverse () modes for 2D. is a unit vector representing the direction of polarization, which is determined as (longitudinal) and (transverse). Note that the vectors are orthonormal as . Here, strictly speaking, for and for , which becomes exactly as (the thermodynamic limit).
In the low- limit, the continuum mechanics determine the dispersion relation as . is the phonon speed; and for 3D, and and for 2D. Here, is the mass density, and and are the bulk and shear elastic moduli, respectively. In this study, we calculate and using the harmonic formulation Mizuno et al. (2016). Debye theory counts the number of phonons to yield the vDOS as
| (4) |
where is the Debye level and is the Debye frequency; for 3D, and for 2D, where is the number density. Close to the unjamming transition, O’Hern et al. (2003); Silbert et al. (2005, 2009); Mizuno et al. (2016), and (see also the Supplemental Information, Figs. S6 and S7).
II.4 Phonon order parameter
We evaluate the extent to which the mode is close to phonons by introducing the phonon order parameter as follows. The eigen vector can be expanded in a series of phonons (Fourier-series expansion) as . Then, we can calculate the projection onto one particular phonon as
| (5) |
Here, note that since .
If the mode is a phonon, then is described as the summation of a finite number of large overlapped phonons; . Here, we define “large overlapped” by , i.e., overlapped by the extent of more than modes. Considering the above, we define the phonon order parameter as
| (6) |
for a phonon, whereas for a mode that is considerably different from phonons. In the present study, was employed; however, we confirmed that our results and conclusions do not depend on the choice of the value of .
In addition, we calculate the (normalized) spatial correlation function of projected to as
| (7) |
where denotes the average over all pairs of particles . If the vibrational mode is a phonon, then exhibits a sinusoidal curve.
II.5 Participation ratio
We measure the extent of vibrational localization by the participation ratio Mazzacurati et al. (1996); Taraskin and Elliott (1999); Schober and Ruocco (2004); Xu et al. (2010),
| (8) |
As extreme cases, for an ideal mode where all the particles vibrate equivalently, and for a mode involving only one particle. In the present study, we determine localized modes using the criterion of , i.e., modes involving less than of the total particles.
II.6 Vibrational energy
Finally, we calculate the vibrational energy . The vector represents the vibrational motion at the contact of particles , which can be decomposed to the normal and the tangential vibrations with respect to the bond vector Mizuno et al. (2016); and . Accordingly, the vibrational energy can be decomposed as
| (9) | ||||
For the present repulsive system, is always positive. If the mode is a phonon, then and are both proportional to . On the other hand, for the floppy mode, the tangential exhibits -independent behaviour, Mizuno et al. (2016).
III Result
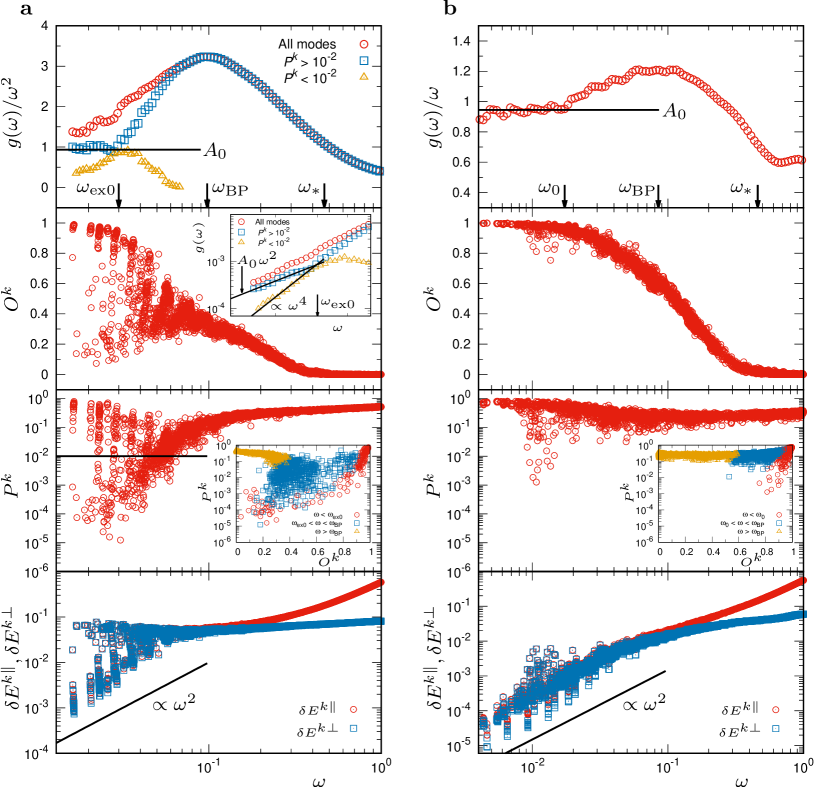
We first study the vibrational modes of the three-dimensional (3D) model system at a pressure (density) above the unjamming transition (see the Methods section). Figure 1a (top panel, red circles) presents the reduced vDOS at (packing fraction ) together with the Debye level . The value of is independently determined from the macroscopic mechanical moduli [Eq. (4)]. The reduced vDOS clearly exhibits a maximum, i.e., the boson peak, which has not yet been observed for this model Silbert et al. (2005, 2009). We place arrows indicating the position of the boson peak and of (the onset frequency of the plateau). Please refer to the Supplementary Information, Fig. S1, for the plateau and its onset frequency in . The value of is approximately five times smaller than , which is why the boson peak is technically difficult to detect for this model. Further decreasing the frequency below , decreases towards but does not reach in the frequency region that we studied. We will carefully discuss this point after characterizing the nature of the vibrational modes.
To characterize the modes, we calculate three different parameters (see the Methods section). First, the second panel from the top in Fig. 1a presents the phonon order parameter , defined as the projection onto phonons [Eq. (6)], for each mode . measures the extent to which the mode is close to phonons, taking values from (phonon) to (non-phonon). At , is nearly zero, which confirms that these modes, called floppy modes (disordered extended modes) Wyart et al. (2005a, b), are largely different from phonons. As the frequency is decreased from to , smoothly increases to . This result indicates that the modes around the boson peak have a hybrid character of phonons and floppy modes. Quite remarkably, as the frequency is further decreased below , the modes are divided into two groups: increases with decreasing frequency in one group, whereas decreases in the other group. In the former group, converges to almost at (we provide the precise definition of later); namely, these modes are phonons 111 of these phonon modes are close to but not exactly , indicating that they are very weakly perturbed. Exact may be realized only in the limit of .. Second, the third panel plots the participation ratio that evaluates the extent of spatial localization of the mode [Eq. (8)]. takes values from 1 (extended over all particles equally) to (localized in one particle) Mazzacurati et al. (1996); Taraskin and Elliott (1999); Schober and Ruocco (2004); Xu et al. (2010). As shown in the panel, also exhibits the division of modes into two groups: one approaches with decreasing , and the other approaches . The inset in this panel shows that the non-phonon modes (small ) are localized (small ), whereas the phonon modes (large ) are extended (large ) at . Third, the bottom panel presents the normal and tangential vibrational energies, [Eq. (9)] Mizuno et al. (2016). Again, the modes are split into two groups. The phonon modes follow the scaling behaviour as in the case of crystalline solids, whereas the non-phonon localized modes are characterized by the -independent behaviour of as in the case of the floppy modes at . These three coherent results demonstrate that the phonon modes and the non-phonon localized modes coexist at .
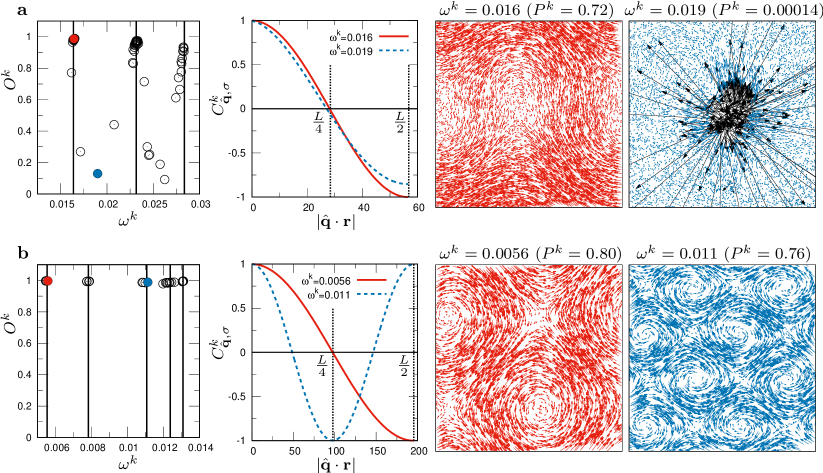
We now perform more stringent tests of the nature of these two types of modes. In Fig. 2a (left panel), the phonon order parameter is plotted against the frequency for each mode in the system of . Because the system is in a finite box, phonons should have discrete energy levels. We calculate these energy levels from the macroscopic elastic moduli and the linear dimension of the box (see the Methods section), and we display them as vertical lines in the figure. Indeed, the phonon modes (modes with large ) sit on these levels. Conversely, the soft localized modes (modes with small ) are in the gaps between the different levels. Furthermore, the right panels show the eigen-vector field of the representative modes (highlighted as filled circles in the left panel), which demonstrates that the mode on the level has a phonon structure, whereas the other mode is localized. These results unambiguously establish the distinction between phonon modes and soft localized modes.
However, note that the soft localized modes are not truly localized. This is best observed in the spatial correlation function [Eq. (7)], as shown in the middle panel of Fig. 2a. Here, we calculate the spatial correlation of the eigen-vector field along the transverse wave (see the Methods section). This function exhibits a nice sinusoidal shape not only for the phonon mode but also for the localized mode. This result indicates that the localized mode has disordered vibrational motions in the localized region; however, these motions are accompanied by extended phonon vibrations in the background. Consistent with this result, we observe that the participation ratios of these modes do not scale as with increasing system size at a fixed . Therefore, these modes are quasi-localized Mazzacurati et al. (1996); Schober and Ruocco (2004). This feature is very similar to the modes in defect crystals, where the quasi-localized modes are produced by hybridization of the extended phonon and the localized defect modes Leibfried and Breuer (1978); Schober and Ruocco (2004).
A clear distinction between phonon modes and soft localized modes enables us to consider the vDOSs of these two types of modes separately. We define as the vDOS of modes with and as the vDOS of those with , and we plot them in Fig. 1a (the top panel and the inset that is the second from the top). As shown, converges exactly to the Debye behaviour at a finite , which we define as . However, follows a different scaling law . Thus, we now conclude that the phonon modes following the Debye law and the soft localized modes following the other law coexist at . This result then suggests that the full vDOS eventually converges to the Debye vDOS in the limit of because decays faster than . Here we note that the scaling is the same law proposed in the soft-potential model Karpov et al. (1983); Buchenau et al. (1991, 1992); Gurevich et al. (2003). Also, it was recently reported that the law can be observed in the Heisenberg spin-glass and structural glasses if the effects of phonons are suppressed by introducing a random potential Baity-Jesi et al. (2015), tuning the system size to be sufficiently small Lerner et al. (2016), or focusing on the low-frequency regime below the lowest phonon mode Gartner and Lerner (2016). In the present work, for the first time to our knowledge, we found that the vibrational modes are spontaneously divided into the phonon modes and the soft localized modes at and observed that these soft localized modes exactly follow the law.
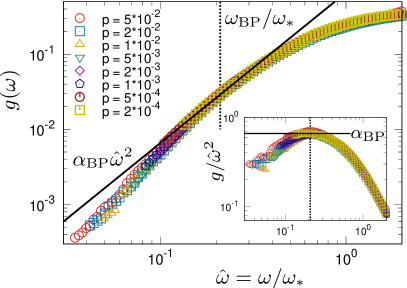
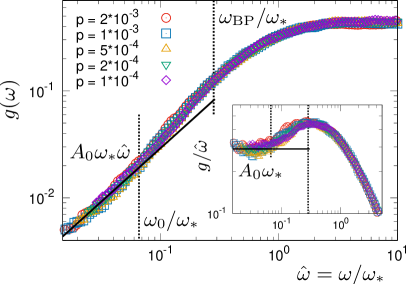
We repeated this analysis with different packing pressures (densities). We observe that the basic features are unchanged (see the Supplementary Information, Fig. S2a). Furthermore, we find that the vDOSs at different pressures can be summarized by the scaling laws. To illustrate this result, we determined for each pressure and introduced the scaled frequency . Here, we confirmed the well-established property of Silbert et al. (2005, 2009); Wyart et al. (2005a, b). Then, we plot and against at various pressures in Fig. 3. All the data perfectly collapse around and above the boson peak. We emphasize that there are no adjustable parameters for this collapse. At , i.e., , exhibits a constant plateau (see the Supplementary Information, Fig. S1a). The boson peak is located at ; thus, at all pressures. The vDOS around the boson peak can be fitted to the non-Debye scaling with , as predicted by the mean-field theory DeGiuli et al. (2014); Franz et al. (2015) and observed in simulations Charbonneau et al. (2016). However, the data systematically deviate from this scaling law around at all pressures. This result can be contrasted with the results of replica theory, which predicts that the present system has a marginally stable glass phase in some finite region of the density above the unjamming point Biroli and Urbani (2016), and the region of the non-Debye scaling law extends down to in this phase Franz et al. (2015). Our result is more consistent with the results in Refs. DeGiuli et al. (2014); Lerner et al. (2014).
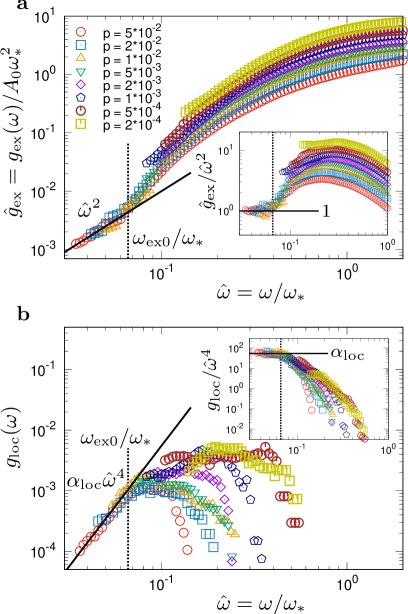
Instead, at lower frequency , we find that another scaling law works. In Fig. 4a, we plot against . We note that the Debye level is related to as with . When decreasing , all the data at different pressures collapse and converge to , which is exactly the Debye behaviour . This convergence occurs at ; thus, at all pressures. Next, in Fig. 4b, we plot against . Remarkably, all the data converge to another universal scaling law with . This convergence occurs at as in . These two results demonstrate that the full vDOS can be expressed as at .
Therefore, by collecting the results in all the frequency regions, we can write the functional form of the vDOS that covers the continuum limit as follows:
| (10) |
with , , , , , and with . Strikingly, except for the phonon part , the vDOS takes the form of a universal function of the reduced frequency only. In other words, the non-phonon contribution to the vDOS can be expressed as , where for , for , and for . This result implies that all the non-phonon vibrations, including the soft localized modes, are controlled by the physics of , namely, the isostaticity and the marginal stability. We note that the soft potential model predicts Gurevich et al. (2003); the exponent of is consistent with our result, but the coefficient is not.
To further discuss the origin of the non-phonon behaviours, we perform a vibrational mode analysis of the “unstressed” system. The unstressed system is defined as the system in which the particle-particle contacts of the original system are replaced with relaxed springs (see the Methods section). In the present model, the unstressed system is known to be far from the marginally stable state Wyart et al. (2005b); DeGiuli et al. (2014); Lerner et al. (2014). Thus, by observing whether a mode disappears in the unstressed system, one can evaluate whether the mode originated from the marginal stability. We observe that the scaling region for is suppressed in the unstressed system, which confirms that these modes originated from the marginal stability DeGiuli et al. (2014); Franz et al. (2015). Furthermore, the soft localized modes are strongly quelled (see the Supplementary Information, Figs. S2b and S4) 222 We observe that the unstressed system begins to show soft localized modes when the system is very close to the unjamming transition. This may be because even the unstressed system is brought near the elastic instability when approaching the unjamming transition. . This result suggests that the soft localized modes also originated from the marginal stability, although they are not captured by the current mean-field framework.
Finally, we focus on the vibrational modes of the two-dimensional (2D) model system, where we encounter a surprisingly different situation. Figure 1b shows that converges smoothly and exactly to the Debye vDOS at a finite frequency that we define as . Below , the modes are characterized by ; namely, these modes are phonons. Therefore, no group of soft localized modes appears in 2D. This result is more evident in Fig. 2b; all the vibrational modes at sit on the energy levels of phonons, and they also have the spatial structures of phonons. Another interesting feature is that the full vDOSs at various pressures are expressed as a universal function of over the entire regime, as demonstrated in Fig. 5. This result can be rationalized by observing that the Debye (phonon) vDOS is with ; thus, it also becomes a universal function of in 2D, as does the non-phonon contribution . Similar convergence to phonons and collapses of the vDOSs were reported for 2D Lennard-Jones systems by previous works Tanguy et al. (2002); Shintani and Tanaka (2008). The collapse also indicates that the boson peak amplitude scaled by the Debye level, Shintani and Tanaka (2008), does not depend on the packing pressure in 2D. In contrast, in 3D, this quantity diverges as at the unjamming transition, as shown in Eq. (10) and in Fig. 4a (see also the Supplementary Information, Eq. (S3), Figs. S6 and S7). We also note that the recent work Lerner et al. (2016) indicated the law of non-phonon modes can be observed even in 2D amorphous systems if the effects of phonons are suppressed.
IV Conclusion
In conclusion, we have used a large-scale numerical simulation to observe the continuum limit of the vibrational modes in a model amorphous solid. In 3D, we have found that the vDOS follows the non-Debye scaling only around and above the boson peak, and below the boson peak, the vibrational modes are divided into two groups: the modes in one group converge to the phonon modes following the Debye law , and those in the other group converge to the soft localized modes following another universal non-Debye scaling . Strikingly, all the non-phonon contributions to the vDOSs at different pressures can be expressed as a universal function of the reduced frequency . In contrast, completely different behaviours are observed in 2D: vibrational modes smoothly converge to phonons without the appearance of the group of soft localized modes.
Our results, on the one hand, provide a direct verification of the basic assumption of the soft potential model. We showed the coexistence of phonon modes and soft localized modes, which is the central idea for explaining the low- anomalies of thermal conduction in this phenomenological model Anderson et al. (1972); Karpov et al. (1983); Buchenau et al. (1991, 1992); Gurevich et al. (2003). On the other hand, the violation of the non-Debye scaling at the boson peak, the emergence of soft localized modes with another non-Debye scaling, and the crucial difference between 2D and 3D appear to be beyond the reach of the current mean-field theory. However, the fact that the non-phonon contributions to the vDOS are expressed as a universal function of suggests that these features are linked to the isostaticity and the marginal stability, which are captured by the mean-field theory Wyart et al. (2005a, b); Parisi and Zamponi (2010); Wyart (2010); Berthier et al. (2011); Wyart (2012); DeGiuli et al. (2014); Charbonneau et al. (2014a, b); Franz et al. (2015); Biroli and Urbani (2016).
Acknowledgments
We thank H. Ikeda, Y. Jin, L.E. Silbert, P. Charbonneau, F. Zamponi, L. Berthier, E. Lerner, E. Bouchbinder, and K. Miyazaki for useful discussions and suggestions. The numerical calculations were partly carried out on SGI Altix ICE XA at Institute for Solid State Physics, The University of Tokyo, Japan.
Author contributions
H.M. and A.I. conceived the project. H.M., H.S., and A.I. carried out numerical simulations. H.M. and A.I. wrote the paper.
Additional information
Supplementary information is available. Correspondence and requests for materials should be addressed to H.M. (hideyuki.mizuno@phys.c.u-tokyo.ac.jp) or A.I. (atsushi.ikeda@phys.c.u-tokyo.ac.jp).
References
- Kittel (1996) C. Kittel, Introduction to Solid State Physics, 7th ed. (John Wiley and Sons, New York, 1996).
- Leibfried and Breuer (1978) G. Leibfried and N. Breuer, Point Defects in Metals I, Introduction to the Theory, Springer Tracts in Modern Physics, Vol. 81 (Springer, Berlin, 1978).
- Phillips (1981) W. A. Phillips, Amorphous Solids: Low Temperature Properties, 3rd ed. (Springer, Berlin, 1981).
- Zeller and Pohl (1971) R. C. Zeller and R. O. Pohl, Phys. Rev. B 4, 2029 (1971).
- Buchenau et al. (1984) U. Buchenau, N. Ncker, and A. J. Dianoux, Phys. Rev. Lett. 53, 2316 (1984).
- Tanguy et al. (2002) A. Tanguy, J. P. Wittmer, F. Leonforte, and J.-L. Barrat, Phys. Rev. B 66, 174205 (2002).
- Monaco and Mossa (2009) G. Monaco and S. Mossa, Proc. Natl. Acad. Sci. USA 106, 16907 (2009).
- Marruzzo et al. (2013a) A. Marruzzo, W. Schirmacher, A. Fratalocchi, and G. Ruocco, Scientific Reports 3, 1407 (2013a).
- Marruzzo et al. (2013b) A. Marruzzo, S. Khler, A. Fratalocchi, G. Ruocco, and W. Schirmacher, The European Physical Journal Special Topics 216, 83 (2013b).
- Mizuno et al. (2013a) H. Mizuno, S. Mossa, and J.-L. Barrat, EPL (Europhysics Letters) 104, 56001 (2013a).
- Mizuno et al. (2014) H. Mizuno, S. Mossa, and J.-L. Barrat, Proceedings of the National Academy of Sciences 111, 11949 (2014).
- Gelin et al. (2016) S. Gelin, H. Tanaka, and A. Lemaitre, Nat Mater 15, 1177 (2016).
- Yoshimoto et al. (2004) K. Yoshimoto, T. S. Jain, K. VanWorkum, P. F. Nealey, and J. J. dePablo, Phys. Rev. Lett. 93, 175501 (2004).
- Tsamados et al. (2009) M. Tsamados, A. Tanguy, C. Goldenberg, and J.-L. Barrat, Phys. Rev. E 80, 026112 (2009).
- Mizuno et al. (2013b) H. Mizuno, S. Mossa, and J.-L. Barrat, Phys. Rev. E 87, 042306 (2013b).
- Karpov et al. (1983) V. G. Karpov, M. I. Klinger, and F. N. Ignat’ev, Sov. Phys. JETP 57, 439 (1983).
- Buchenau et al. (1991) U. Buchenau, Y. M. Galperin, V. L. Gurevich, and H. R. Schober, Phys. Rev. B 43, 5039 (1991).
- Buchenau et al. (1992) U. Buchenau, Y. M. Galperin, V. L. Gurevich, D. A. Parshin, M. A. Ramos, and H. R. Schober, Phys. Rev. B 46, 2798 (1992).
- Gurevich et al. (2003) V. L. Gurevich, D. A. Parshin, and H. R. Schober, Phys. Rev. B 67, 094203 (2003).
- Anderson et al. (1972) P. W. Anderson, B. I. Halperin, and C. M. Varma, Philosophical Magazine 25, 1 (1972).
- Mazzacurati et al. (1996) V. Mazzacurati, G. Ruocco, and M. Sampoli, Europhys. Lett. 34, 681 (1996).
- Taraskin and Elliott (1999) S. N. Taraskin and S. R. Elliott, Phys. Rev. B 59, 8572 (1999).
- Schober and Ruocco (2004) H. R. Schober and G. Ruocco, Philos. Mag. 84, 1361 (2004).
- Xu et al. (2010) N. Xu, V. Vitelli, A. J. Liu, and S. R. Nagel, EPL (Europhysics Letters) 90, 56001 (2010).
- Lerner et al. (2016) E. Lerner, G. Düring, and E. Bouchbinder, Phys. Rev. Lett. 117, 035501 (2016).
- Baity-Jesi et al. (2015) M. Baity-Jesi, V. Martín-Mayor, G. Parisi, and S. Perez-Gaviro, Phys. Rev. Lett. 115, 267205 (2015).
- Widmer-Cooper et al. (2008) A. Widmer-Cooper, H. Perry, P. Harrowell, and D. R. Reichman, Nature phys. 4, 711 (2008).
- Maloney and Lemaître (2006) C. E. Maloney and A. Lemaître, Phys. Rev. E 74, 016118 (2006).
- O’Hern et al. (2003) C. S. O’Hern, L. E. Silbert, A. J. Liu, and S. R. Nagel, Phys. Rev. E 68, 011306 (2003).
- Wyart et al. (2005a) M. Wyart, S. R. Nagel, and T. A. Witten, EPL 72, 486 (2005a).
- Wyart et al. (2005b) M. Wyart, L. E. Silbert, S. R. Nagel, and T. A. Witten, Phys. Rev. E 72, 051306 (2005b).
- Parisi and Zamponi (2010) G. Parisi and F. Zamponi, Rev. Mod. Phys. 82, 789 (2010).
- Wyart (2010) M. Wyart, EPL (Europhysics Letters) 89, 64001 (2010).
- Berthier et al. (2011) L. Berthier, H. Jacquin, and F. Zamponi, Phys. Rev. E 84, 051103 (2011).
- Wyart (2012) M. Wyart, Phys. Rev. Lett. 109, 125502 (2012).
- DeGiuli et al. (2014) E. DeGiuli, A. Laversanne-Finot, G. During, E. Lerner, and M. Wyart, Soft Matter 10, 5628 (2014).
- Charbonneau et al. (2014a) P. Charbonneau, J. Kurchan, G. Parisi, P. Urbani, and F. Zamponi, Journal of Statistical Mechanics: Theory and Experiment 2014, P10009 (2014a).
- Charbonneau et al. (2014b) P. Charbonneau, J. Kurchan, G. Parisi, P. Urbani, and F. Zamponi, Nat Commun 5, (2014b).
- Franz et al. (2015) S. Franz, G. Parisi, P. Urbani, and F. Zamponi, Proceedings of the National Academy of Sciences 112, 14539 (2015).
- Biroli and Urbani (2016) G. Biroli and P. Urbani, Nature Phys. 12, 1130 (2016).
- Silbert et al. (2005) L. E. Silbert, A. J. Liu, and S. R. Nagel, Phys. Rev. Lett. 95, 098301 (2005).
- Silbert et al. (2009) L. E. Silbert, A. J. Liu, and S. R. Nagel, Phys. Rev. E 79, 021308 (2009).
- Charbonneau et al. (2016) P. Charbonneau, E. I. Corwin, G. Parisi, A. Poncet, and F. Zamponi, Phys. Rev. Lett. 117, 045503 (2016).
- Dagois-Bohy et al. (2012) S. Dagois-Bohy, B. P. Tighe, J. Simon, S. Henkes, and M. van Hecke, Phys. Rev. Lett. 109, 095703 (2012).
- Lerner et al. (2014) E. Lerner, E. DeGiuli, G. During, and M. Wyart, Soft Matter 10, 5085 (2014).
- Mizuno et al. (2016) H. Mizuno, K. Saitoh, and L. E. Silbert, Phys. Rev. E 93, 062905 (2016).
- Note (1) of these phonon modes are close to but not exactly , indicating that they are very weakly perturbed. Exact may be realized only in the limit of .
- Gartner and Lerner (2016) L. Gartner and E. Lerner, SciPost Phys. 1, 016 (2016).
- Note (2) We observe that the unstressed system begins to show soft localized modes when the system is very close to the unjamming transition. This may be because even the unstressed system is brought near the elastic instability when approaching the unjamming transition.
- Shintani and Tanaka (2008) H. Shintani and H. Tanaka, Nature Mater. 7, 870 (2008).