Determination of the nature of fluctuations using 8Li and 9Li -nmr and spin-lattice relaxation.
Abstract
We report a comparison of the spin lattice relaxation rates (slr) for 9Li and 8Li in Pt and SrTiO3, in order to differentiate between magnetic and electric quadrupolar relaxation mechanisms. In Pt, the ratio of the spin relaxation rates was found to be 6.82(29), which is close to but less than the theoretical limit of for pure magnetic relaxation. In SrTiO3 this ratio was found to be 2.7(3), which is close but larger than the theoretical limit of expected for pure electric quadrupolar relaxation. These results bring new insight into the nature of the fluctuations in the local environment of implanted 8Li observed by -nmr.
I Introduction
8Li -detected nmr (-nmr) has been established as a powerful tool for material science due to its inherent sensitivity to magnetic and electronic properties MacFarlane (2015). The principal success of triumf’s low-energy incarnation of -nmr Levy et al. (2014); Morris (2014) is the ability to study thin films, surfaces, and interfaces — where conventional nmr is difficult or impossible. This stems from -nmr’s high sensitivity relative to conventional nmr; for -nmr typically only nuclei (instead of ) are required for a signal. The only other real-space technique with equivalent sensitivity over a comparable material length scale (viz. ) Lee (2015) is low-energy sr (LE-SR) Bakulé and Morenzoni (2004) ; however, it operates in a complementary time-window due to the different probe lifetimes ( for 8Li+ vs. for ). Thus, both techniques have leveraged the nuclear physics of beta decay to investigate topical problems in condensed matter physics including magnetic surfaces, thin film heterostructures, topological insulators, superconductors etc.
A key issue in any 8Li -nmr experiment is to identify the source of spin-lattice relaxation (slr) and in particular whether the fluctuations driving the slr are magnetic or electric in origin. Unlike the positive muon, (), 8Li () is not a pure magnetic probe and its relaxation is sensitive to both fluctuating magnetic fields and electric field gradients (efg’s). In some cases, the primary source of relaxation may be inferred. For example, in simple metals the observed relaxation is linear in temperature Hossain et al. (2009) as expected from the Korringa relaxation Korringa (1950), which originates from a magnetic hyperfine interaction between the nuclear spin and the spin of the conduction electrons. However, in more complicated instances, such as heterostructures comprised of magnetic and non-magnetic layers, it becomes difficult to determine the contribution of each type of relaxation. LaAlO3/SrTiO3 multilayers are particularly illustrative of this point; the bulk layers are non-magnetic insulators, while there is evidence of magnetism at their interfaces Salman et al. (2012).
In conventional nmr it is possible to differentiate between relaxation mechanisms by isotopic variation of the nuclear probe, since the absolute relaxation rates for each isotope scale according to their nuclear moments. For two isotopes with significantly different nuclear moments (e.g., 6Li and 7Li Tomeno and Oguchi (1998)) the ratio of the relaxation rates should be distinctly different in the limits of either pure magnetic or pure electric quadrupolar relaxation. In this study we test the feasibility of isotope comparison applied to -nmr — using 8Li and 9Li, two -radioactive isotopes. The stopping sites of 8Li and 9Li are often interstitial rather than substitutional as in the case of conventional NMR. However, we expect that both implanted 8Li and 9Li will probe the same sites. Measurements on 9Li are more time consuming than those for 8Li. This is related to the fact that 9Li lies one neutron further away from the valley of stability, consequently the beam intensity in this experiment was about 10 times lower for 9Li than 8Li, and has a more complicated -decay scheme, which results into a beta-decay asymmetry for 9Li about 3 times smaller than for 8Li, as will be discussed below.
Measurements reported here were made in Pt metal, where the spin relaxation rate of 8Li (9Li) is dominated by Korringa scattering Ofer et al. (2012a), which is magnetic, and in strontium titanate (SrTiO3), which is a non-magnetic insulator with a large static electric quadrupolar interaction for implanted 8Li. SrTiO3 is a common substrate material but also has interesting properties on its own which have been studied extensively with a wide variety of methods including -nmr. Although we expect the quadrupolar fluctuations in efg causing spin relaxation to dominate, there are also potential magnetic sources of relaxation that could contribute as explained below.
In the following sections we first summarize the theoretical considerations behind -nmr, as well as the isotopic variation method. This is then followed by a description of the experiment and finally we present the experimental results along with a discussion.
II Theory
The basis of -nmr is the parity-violating weak interaction, whereby the direction of the emitted electron (positron) from the decaying nucleus is correlated with the nuclear spin polarization at the time of decay:
| (1) |
where is the velocity of the high energy electron (positron) normalized to the speed of light, is the magnitude of the nuclear polarization vector, is the angle between the nuclear polarization and the electron (positron) velocity and is the asymmetry parameter depending on the properties of nuclear -decay. The theory of nuclear beta-decay predicts that is about 1/3 for 8Li and considerably smaller () for 9Li Firestone and Shirley (1996), if averaged over all the decay modes.
The reduction in asymmetry for 9Li compared to 8Li is attributed to 9Li’s more complicated -decay scheme. In particular, 9Li has three main decay channels, two of which have opposite asymmetries that nearly cancel after weighting by the branching probabilities. Thus, most of the observed asymmetry is from the weakest decay mode which has a branching probability of only but a large theoretical asymmetry parameter . The relevant branching probabilities and asymmetries of each decay mode are reported in Fig. 1. We note in passing that it should be possible to enhance the -nmr signal from 9Li by tagging events according to whether an is emitted or not, which will allow us to distinguish between the different decay channels and isolate their contributions. This is currently being explored as a way to optimize the -nmr of 9Li.
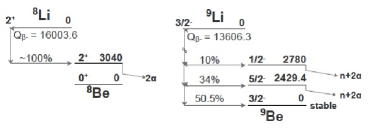
| 9Be state | Probability | Decay mode | ||
|---|---|---|---|---|
| ground state | 50.5 | -2/5 | stable | |
| 2429.4 MeV | 34 | 3/5 | n+2 | |
| 2780 MeV | 10 | -1 | n+2 |
The resulting anisotropic decay pattern for the high energy electron (positron) allows one to monitor the nuclear polarization from highly polarized 8Li+ or 9Li+ beams implanted in the sample. In particular, the asymmetry in the count rate at time between two opposing beta detectors is proportional to the component of nuclear polarization along the direction defined by the two detectors:
| (2) |
where and are the counts measured in the backward and forward detectors, is the component of nuclear polarization along the -axis defined by the detectors, and is the time of decay after implantation. The detectors are generally positioned so that is along the direction of initial polarization. Note that the asymmetry in the count rate has a maximum value of at which is reduced relative to the theoretical asymmetry , as calculated from the nuclear properties, owing to instrumental effects such as the finite solid angle subtended by the detectors and scattering of the betas before reaching the detectors. Note also that and thus , are time dependent, reflecting the fact that the nuclear polarization is subject to spin relaxation processes in the sample, which in fact is the quantity of interest in this experiment.
Information on the fluctuations of the electromagnetic fields in a material of interest is obtained through measurements of the spin-lattice relaxation (slr) rate in the absence of a rf magnetic field. The slr may be studied by implanting a series of beam pulses into the sample and then monitoring , which is the convolution of with the beam pulse where is the time of arrival for given probe and is the time spent in the sample before its beta decay:
| (3) |
In general the slr rate, usually denoted as (with being the longitudinal spin-lattice relaxation time), originates from fluctuations in the local environment arising from fundamental processes such as phonon scattering, magnon scattering, conduction electron scattering, diffusion, etc. The total observed rate can be decomposed into a sum of individual contributions, which may be grouped into magnetic () and electric quadrupolar () terms:
| (4) |
Most often one of the relaxation mechanisms will dominate. For instance, we expect Korringa relaxation to be dominant in simple metals.
The magnitudes of each contribution for a given probe nucleus scale according to their nuclear properties; namely, their spin, , magnetic moment, , and electric quadrupole moment, . Measurements of slr rates for two different isotopes under identical experimental conditions (i.e., magnetic field, temperature, etc.) can be compared through their ratio, :
| (5) |
where and denote the spin quantum number of each isotope. Two limits are of interest here: when the relaxation is solely due to either magnetic or quadrupolar interactions within the host-sample. In the former case, Eq. (5) reduces to the ratio of pure magnetic relaxation, , which in the limit of fast fluctuations (i.e., , where is the nmr correlation time and is the Larmor resonance frequency) is:
| (6) |
where and are the magnetic moment and gyromagnetic ratio of each isotope. Note that the fast fluctuation limit ensures that is independent of .
In the other case, Eq. (5) yields the ratio of relaxation rates in the pure quadrupolar limit, :
| (7) |
where are the nuclear quadrupole moments, and Abragam (1983)
| (8) |
Thus, given the nuclear moments of each isotope, one can calculate the ratio of relaxation rates when either mechanism is dominant. Using Eqs. (6) and (7), along with the nuclear spins and moments for 8Li and 9Li (see Table 1), we find the limiting cases for : and for and , respectively. The difference between these limits is not as pronounced as for 6Li and 7Li Tomeno and Oguchi (1998), where and differ by a factor of Stone (2005). Nevertheless, 8Li and 9Li are sufficiently different that the nature of fluctuations and resulting spin relaxation (magnetic versus electric quadrupolar) may be differentiated by such a comparison.
| (s) | ()111The magnetic moments have been corrected for diamagnetic shielding. | (mb)222The quadrupole moments were determined from their ratios, starting with the well-known value for 7Li Stone (2005). | |||
|---|---|---|---|---|---|
| 8Li | 1.2096(5) Fléchard et al. (2010) | +1.653560(18) Borremans et al. (2005) | +32.6(5) Voss et al. (2011) | ||
| 9Li | 0.2572(6) Alburger and Wilkinson (1976) | +3.43678(6) Borremans et al. (2005) | -31.5(5) Voss et al. (2011) |
III Experimental
The experiment was performed using beams of 8Li+ and 9Li+ at triumf’s Isotope Separator and Accelerator Facility (ISAC) in Vancouver, Canada. isac is capable of providing an intense beam for a large number of isotopes of various elements isa , including 8Li and 9Li. For this experiment, triumf’s dedicated -nmr and -nqr spectrometers were used. A detailed discussion on the characteristics of the spectrometers can be found elsewhere Morris (2014); Morris et al. (2004).
Before reaching the spectrometer, the Li+ ion beam first passes through the ISAC polarizer Levy et al. (2014). The first stage of the polarizer is to neutralize the beam by passing it through a Rb vapor cell. The neutral beam then drifts m during which time the optical transition is pumped with circularly polarized laser light. The last stage is to re-ionize the beam in a He gas so that the polarized beam can be delivered alternately to the spectrometers. Previous work shows that the nuclear polarization of the beam after stopping in the sample is MacFarlane et al. (2014).
It is important to note that unlike conventional nmr, where the Boltzman factor determines the polarization, the nuclear polarization in -nmr is close to unity and independent of the sample temperature and magnetic field. Consequently, measurements can be made under conditions where conventional nmr is difficult or impossible e.g. at high temperatures, low magnetic fields or in thin films. The intensity of the implanted beam (typically ), is such that the concentration of the nuclear probes is so small that there is no interaction between probes and thus no homonuclear spin-coupling.
IV Results and Discussion
To demonstrate the comparison of 8Li and 9Li in -nmr, two very different materials were selected. The first is Pt which is a d-band metal in which the 8Li resides at a site with little or no quadrupolar interaction. In this test case we expect the relaxation to be predominantly magnetic, originating from Korringa scattering. SrTiO3 on the other hand is a non-magnetic insulator with few nuclear moments. Previous work in SrTiO3 shows that 8Li experiences a large quasistatic quadrupolar interaction MacFarlane et al. (2003a). Thus in this case we expect quadrupole fluctuations to play a more important role. Nevertheless, it is still unclear to what extent magnetic effects can be neglected in SrTiO3. For example, it is well known that the implantation of 8Li generates vacancy-interstitial pairs as well as electron-hole pairs. Such defects are often magnetic. For example O vacancies in SrTiO3 result in two Ti3+ ions which are typically paramagnetic. In principle, the resulting paramagnetic defects would have low frequency magnetic fluctuations which will contribute to the slr of the implanted Li nucleus in SrTiO3.
IV.1 Platinum
8Li+ resonance measurements in Pt have shown a single narrow line below , indicating that 8Li+ occupies a single site with a vanishing (static) efg Fan et al. (2009); Ofer et al. (2012b). The spectrum is also simpler than in other metals, where multiple Li+ sites are found below MacFarlane et al. (2003b); Parolin et al. (2007); Salman et al. (2007); Parolin et al. (2008); Wang et al. (2009); Parolin et al. (2009); Chow et al. (2012).
Given the simplicity of the resonance spectrum we expect slr in Pt to follow a single exponential form with:
| (9) |
Substituting this into Eq. (3) and assuming a square beam pulse during the time interval [0,], one obtains a form for the asymmetry during and after the pulse given by:
| (10) |
where is the radioactive lifetime, and is the initial asymmetry at the time of implantation. Note that the slr spectrum has two distinct regions (see Fig. 2): during the beam pulse () the asymmetry relaxes towards a dynamic equilibrium value Hossain et al. (2009):
| (11) |
whereas after the beam pulse () decays towards the Boltzman equilibrium value, which is essentially zero on our scale. Note the pronounced kink in at when the beam pulse ends. This is also the time with the highest event rate and smallest statistical uncertainty in . For both isotopes the length of the beam pulse () and the total observation time () were chosen to minimize the statistical uncertainties.
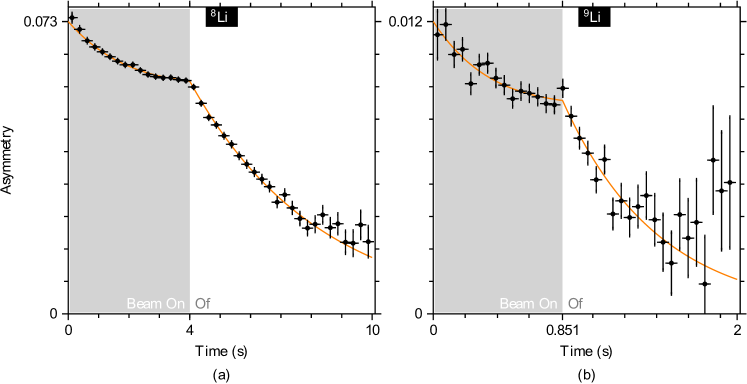
The slr rates for 8Li+ and 9Li+ implanted at an energy of at were measured in magnetic fields of and — the latter shown in Fig. 2. Several general distinctions should be pointed out between slr spectra for 8Li+ and 9Li+ in Pt: The initial asymmetry (i.e., ) for 8Li+ is times greater than for 9Li+; is times larger for 9Li+ than for 8Li+; and the relative uncertainty of the slr rate measurements for 9Li+ is greater by a factor of than for 8Li+. The latter can be understood as follows: The statistical figure of merit for any -nmr measurement is , where is the observable asymmetry and is the total number of decay events — both factors for 9Li are significantly reduced relative to 8Li. Since 9Li lies further away from the valley of nuclear stability, it has a shorter half-life and fewer ions are extracted from the ion source and delivered to the spectrometer (here vs for 8Li+). This in turn reduces the factor for 9Li. Also, as explained above, the asymmetry for 9Li is much smaller than for 8Li. As a result, about 90% of the data acquisition was spent on 9Li, since these results dominated our uncertainty in the ratio of the relaxation rates.
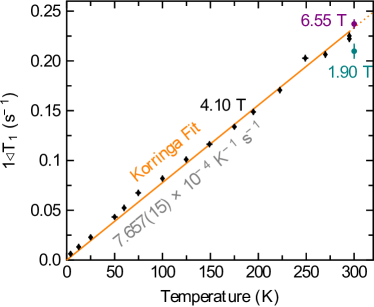
Temperature dependent slr of 8Li+ in Pt has been studied previously by Ofer et al. between at , where the slr rate was found to increase linearly with temperature, implying Korringa relaxation Korringa (1950). This relation holds for high magnetic fields and different implantation energies. The temperature-dependent 8Li+ slr rates at various magnetic fields are shown in Fig. 3, including our measurements, as well as results on Pt foil by Ofer et al.. The 8Li slr rate at is in good agreement with the Korringa fit by Ofer et al., extrapolated to , whereas the measured slr rate at is lower by about 10%. It is unlikely that this is a real effect since any additional source of relaxation would increase the relaxation at the lower magnetic field which is opposite to what is observed. The slight reduction in measured at 1.9 T suggests there may be a small systematic error related to the fact that the beam spot is a bit larger and the ratio between the beta rates in the two detectors is different compared to the higher field. However, it should be noted that the measured 8Li slr rates in Pt foil appear to increase linearly with temperature, independent of implantation energy and applied magnetic field.
The ratios of at and are in good agreement with each other and we find a relaxation rate ratio, , of nd t and , respectively.
IV.2 Strontium Titanate
SrTiO3 was chosen as a second example, since it is a non-magnetic insulator and representative of a material where the relaxation in 8Li -nmr is expected to be dominated by quadrupolar fluctuations. It has been studied extensively with low-energy 8Li -nmr Smadella et al. (2009); Salman et al. (2011). Implanted 8Li occupies a single non-cubic site, which is unambiguously evidenced by the observation of a pure nuclear quadrupole resonance (nqr) in zero magnetic field Salman et al. (2004, 2006a, 2006b); Voss et al. (2014).
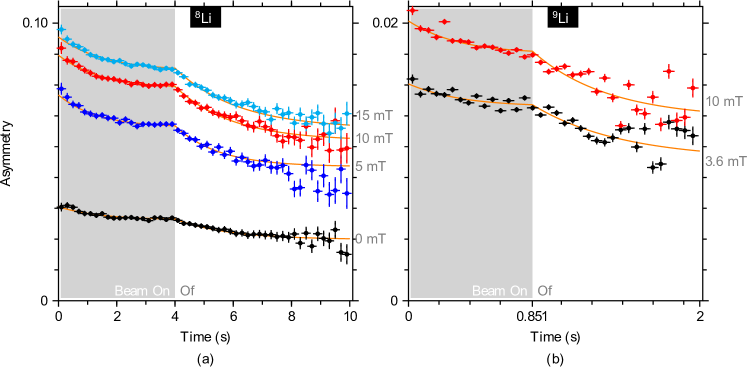
Figure 4 shows the slr spectra for 8Li and 9Li at at various magnetic fields between applied along a (1 0 0) cubic crystallographic axis. It is evident from the data that the relaxation is more complex than in Pt since a single exponential fails to describe the decay of spin polarization. One might expect this since a magnetic field applied along the (1 0 0) direction breaks the local symmetry between the 3 otherwise equivalent sites. More specifically the efg tensor is axially symmetric about one of the three orthogonal cubic axes. Thus the applied magnetic field is either along efg axis or perpendicular to it. However the relaxing fraction, , was approximately field-independent, within our range of fields including the spectrum at zero field. Given the two 90 degree sites don’t contribute to the ZF signal and that is about the same at ZF, the more complex relaxation function observed in SrTiO3 must be unrelated to the angle between the magnetic field and the symmetry axis of the efg. Consequently there must be an additional source of fluctuations affecting the slr for all 3 sites in the same way but in an inhomogeneous manner either in time or space. This could be due to the dynamics associated with defects close to some of the implanted Li. In any event, given one of the relaxation rates is found to be nearly zero, a phenomenological relaxation function of the following form Smadella et al. (2009) was used:
| (12) |
where is the fraction of the relaxing asymmetry () and .
Regarding the relaxation function, note that this is an unfamiliar regime, where the Zeeman interaction is smaller than over the full range of fields, since even for our highest field measurement at , . At high fields (several Tesla), previous work suggests that MacFarlane et al. (2003a), so there is likely some change that will happen around the area of , where the Zeeman interaction really starts to take over.
Since is approximately field-independent, the slr spectra for 8Li and 9Li were fit globally, sharing a common , which turned out to be . The relaxation rates are plotted as a function of applied field in Fig. 5.
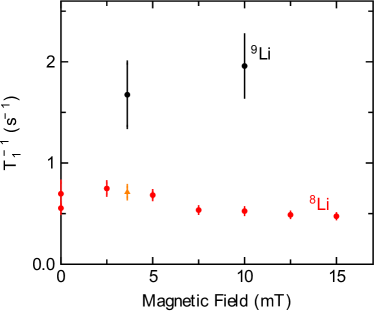
The slr rate for 8Li is found to vary weakly with applied magnetic field below , reaching a plateau below (see Fig. 5). It is likely, but unclear due to the limited statistics, that a similar behavior occurs for 9Li. At , the ratio of the 9Li/8Li slr rates for SrTiO3, , was found to be at and at .
For comparison, the slr rate of 8Li and 9Li was also measured in a second SrTiO3 sample 111This sample was with capping layer. Bulk is a prototypical Mott insulator and is antiferromagnetic below . Like , is non-magnetic at , though transport measurements have shown the existence of a metallic and superconducting heterointerface; however, at an implantation energy of , only a negligible fraction of the probing ions stops in the film, or near the interface. This was confirmed for both and by using the Monte Carlo-based simulation package SRIM 2008. For this reason, this can be considered to be effectively an SLR measurement in the substrate of the film.. These spectra were fitted globally with the same fitting function as in the first SrTiO3 sample. The shared relaxing fraction in this case was , very close to the value calculated independently from the other SrTiO3 sample. The ratio of relaxation rates in this sample at was found to be .
IV.3 Ratio of relaxation rates
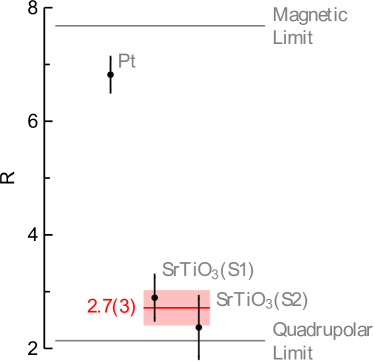
The ratio of relaxation rates in platinum , which is the weighted average of the measurements at and . Note that this value is somewhat less than expected from the pure magnetic limit (Fig. 6).
The reason for this discrepancy is puzzling. All measurements were taken at where the lithium ions could have some quadrupolar contribution due to local vibrations and scattering of phonons which leads to a fluctuating EFG. However is very linear in temperature, whereas any such contributions would have a stronger temperature dependence. It would be interesting to repeat the measurements at a lower temperature to check if is closer to the magnetic limit or not. In principle the scattering of electrons at the Fermi surface, which is responsible for Korringa relaxation (see Fig. 3), could also produce a fluctuating EFG and a linear temperature dependence , which is electric quadrupolar in origin. However, we could not find any calculations of this effect. In any case, an electric quadrupolar contribution to cannot be very large in Pt at .
We also reported a value of in two samples of SrTiO3. In the first sample, the weighted average of the measurements at and yielded . This value is close, but not within experimental error of the quadrupolar limit of . After taking into account the measurement on the second SrTiO3 sample, which was at , the weighted ratio of relaxation rates in SrTiO3 is found to be , closer to the quadrupolar limit. Still there is a small disagreement which suggests some small magnetic contribution to . This may be related to the observed non-exponential relaxation function. If it is due to fluctuations which are inhomogeneous in time or space then nearby defects are likely playing some small role. A small portion of these fluctuations could be magnetic in origin. For example any O vacancies a few lattice sites away would give rise to paramagnetic Ti3+ ions. Similarly electron-hole pairs in a triplet state would also be magnetic.
V Conclusions
We have measured the ratio between of 9Li and 8Li in Pt and SrTiO3 in order to help identify the nature of the fluctuations responsible for the spin relaxation (i.e., if they are magnetic or electric quadrupolar). In Pt, the relaxation is single exponential and the ratio was found to be very close to but slightly less than the pure magnetic limit. This is consistent with Korringa relaxation being dominant as suggested by the linear temperature dependence in reported previously. Nevertheless the small reduction in relative to the pure magnetic limit means that excitations causing a fluctuating EFG may provide a small contribution to the observed spin relaxation. Further measurements at lower temperatures would be needed to verify this.
In SrTiO3 at the results confirm that the dominant source of relaxation is electric quadrupolar. However, the relaxation function is more complicated involving a relaxing part and a non-relaxing part. This suggests there is some inhomogeneous source of fluctuations/spin relaxation, possibly due to nearby defects. The ratio is close to but slightly larger than the pure quadrupolar limit, indicating that there may be some small magnetic contribution. However, the main source of spin relaxation is quadrupolar. This is consistent with expectations given the large quasi-static nuclear quadrupole interaction.
Most importantly, we have demonstrated that the method of isotope comparison can be used in -nmr to distinguish the nature of the fluctuations responsible for . This represents an important new tool for -nmr, since in many systems there is uncertainty in the source of relaxation that cannot be removed simply by varying experimental parameters.
Acknowledgements.
We thank triumf’s cmms for their technical support. This work was supported by: NSERC Discovery Grants to R.F.K. and W.A.M.; and IsoSiM fellowships to A.C. and R.M.L.M. triumf receives federal funding via a contribution agreement with the National Research Council of Canada.References
- MacFarlane (2015) W. A. MacFarlane, Solid State Nucl. Magn. Reson. 68–69, 1 (2015).
- Levy et al. (2014) C. D. P. Levy, M. R. Pearson, R. F. Kiefl, E. Mané, G. D. Morris, and A. Voss, Hyperfine Interact. 225, 165 (2014).
- Morris (2014) G. D. Morris, Hyperfine Interact. 225, 173 (2014).
- Lee (2015) S. Lee, Solid State Nuclear Magnetic Resonance 71, 1 (2015).
- Bakulé and Morenzoni (2004) P. Bakulé and E. Morenzoni, Contemp. Phys. 45, 203 (2004).
- Hossain et al. (2009) M. D. Hossain, H. Saadaoui, T. J. Parolin, Q. Song, D. Wang, M. Smadella, K. H. Chow, M. Egilmez, I. Fan, R. F. Kiefl, S. R. Kreitzman, C. D. P. Levy, G. D. Morris, M. R. Pearson, Z. Salman, and W. A. MacFarlane, Physica B 404, 914 (2009).
- Korringa (1950) J. Korringa, Physica 16, 601 (1950).
- Salman et al. (2012) Z. Salman, O. Ofer, M. Radovic, H. Hao, M. Ben Shalom, K. H. Chow, Y. Dagan, M. D. Hossain, C. D. P. Levy, W. A. MacFarlane, G. M. Morris, L. Patthey, M. R. Pearson, H. Saadaoui, T. Schmitt, D. Wang, and R. F. Kiefl, Phys. Rev. Lett. 109, 257207 (2012).
- Tomeno and Oguchi (1998) I. Tomeno and M. Oguchi, J. Phys. Soc. Jpn. 67, 318 (1998).
- Ofer et al. (2012a) O. Ofer, K. H. Chow, I. Fan, M. Egilmez, T. J. Parolin, M. D. Hossain, J. Jung, Z. Salman, R. F. Kiefl, C. D. P. Levy, G. D. Morris, M. R. Pearson, H. Saadaoui, Q. Song, D. Wang, and W. A. MacFarlane, Phys. Rev. B 86, 064419 (2012a).
- Firestone and Shirley (1996) R. B. Firestone and V. S. Shirley, Table of isotopes, 8th ed. (J. Wiley, New York, 1996).
- Abragam (1983) A. Abragam, Principles of Nuclear Magnetism (Oxford University Press, 1983).
- Stone (2005) N. J. Stone, At. Data Nucl. Data Tables 90, 75 (2005).
- Fléchard et al. (2010) X. Fléchard, E. Liénard, O. Naviliat-Cuncic, D. Rodríguez, M. A. G. Alvarez, G. Ban, B. Carniol, D. Etasse, J. M. Fontbonne, A. M. Lallena, and J. Praena, Phys. Rev. C 82, 027309 (2010).
- Borremans et al. (2005) D. Borremans, D. L. Balabanski, K. Blaum, W. Geithner, S. Gheysen, P. Himpe, M. Kowalska, J. Lassen, P. Lievens, S. Mallion, R. Neugart, G. Neyens, N. Vermeulen, and D. Yordanov, Phys. Rev. C 72, 044309 (2005).
- Voss et al. (2011) A. Voss, M. R. Pearson, J. Billowes, F. Buchinger, K. H. Chow, J. E. Crawford, M. D. Hossein, R. F. Kiefl, C. D. P. Levy, W. A. MacFarlane, E. Mané, G. D. Morris, T. J. Parolin, H. Saadaoui, Z. Salman, M. Smadella, Q. Song, and D. Wang, J. Phys. G: Nucl. Part. Phys. 38, 075102 (2011).
- Alburger and Wilkinson (1976) D. E. Alburger and D. H. Wilkinson, Phys. Rev. C 13, 835 (1976).
- (18) “Isac yield database,” .
- Morris et al. (2004) G. D. Morris, W. A. MacFarlane, K. H. Chow, Z. Salman, D. J. Arseneau, S. Daviel, A. Hatakeyama, S. R. Kreitzman, C. D. P. Levy, R. Poutissou, R. H. Heffner, J. E. Elenewski, L. H. Greene, and R. F. Kiefl, Phys. Rev. Lett. 93, 157601 (2004).
- MacFarlane et al. (2014) W. A. MacFarlane, C. D. P. Levy, M. R. Pearson, T. Buck, K. H. Chow, A. N. Hariwal, R. F. Kiefl, F. H. McGee, G. D. Morris, and D. Wang, J. Phys.: Conf. Ser. 551, 012059 (2014).
- MacFarlane et al. (2003a) W. A. MacFarlane, G. D. Morris, K. H. Chow, R. A. Baartman, S. Daviel, S. R. Dunsiger, A. Hatakeyama, S. R. Kreitzman, C. D. P. Levy, R. I. Miller, K. M. Nichol, R. Poutissou, E. Dumont, L. H. Greene, and R. F. Kiefl, Physica B 326, 209 (2003a).
- Fan et al. (2009) I. Fan, K. H. Chow, T. J. Parolin, M. Egilmez, M. D. Hossain, J. Jung, T. A. Keeler, R. F. Kiefl, S. R. Kreitzman, C. D. P. Levy, R. Ma, G. D. Morris, M. R. Pearson, H. Saadaoui, Z. Salman, M. Smadella, Q. Song, D. Wang, M. Xu, and W. A. MacFarlane, Physica B 404, 906 (2009).
- Ofer et al. (2012b) O. Ofer, K. H. Chow, I. Fan, M. Egilmez, T. J. Parolin, M. D. Hossain, J. Jung, Z. Salman, R. F. Kiefl, C. D. P. Levy, G. D. Morris, M. R. Pearson, H. Saadaoui, Q. Song, D. Wang, and W. A. MacFarlane, Phys. Proc. 30, 156 (2012b).
- MacFarlane et al. (2003b) W. A. MacFarlane, G. D. Morris, T. R. Beals, K. H. Chow, R. A. Baartman, S. Daviel, S. R. Dunsiger, A. Hatakeyama, S. R. Kreitzman, C. D. P. Levy, R. I. Miller, K. M. Nichol, R. Poutissou, and R. F. Kiefl, Physica B 326, 213 (2003b).
- Parolin et al. (2007) T. J. Parolin, Z. Salman, J. Chakhalian, Q. Song, K. H. Chow, M. D. Hossain, T. A. Keeler, R. F. Kiefl, S. R. Kreitzman, C. D. P. Levy, R. I. Miller, G. D. Morris, M. R. Pearson, H. Saadaoui, D. Wang, and W. A. MacFarlane, Phys. Rev. Lett. 98, 047601 (2007).
- Salman et al. (2007) Z. Salman, A. I. Mansour, K. H. Chow, M. Beaudoin, I. Fan, J. Jung, T. A. Keeler, R. F. Kiefl, C. D. P. Levy, R. C. Ma, G. D. Morris, T. J. Parolin, D. Wang, and W. A. MacFarlane, Phys. Rev. B 75, 073405 (2007).
- Parolin et al. (2008) T. J. Parolin, Z. Salman, K. H. Chow, Q. Song, J. Valiani, H. Saadaoui, A. O’Halloran, M. D. Hossain, T. A. Keeler, R. F. Kiefl, S. R. Kreitzman, C. D. P. Levy, R. I. Miller, G. D. Morris, M. R. Pearson, M. Smadella, D. Wang, M. Xu, and W. A. MacFarlane, Phys. Rev. B 77, 214107 (2008).
- Wang et al. (2009) D. Wang, Z. Salman, K. H. Chow, I. Fan, M. D. Hossain, T. A. Keeler, R. F. Kiefl, C. D. P. Levy, A. I. Mansour, G. D. Morris, M. R. Pearson, T. J. Parolin, H. Saadaoui, M. Smadella, Q. Song, and W. A. MacFarlane, Physica B 404, 920 (2009).
- Parolin et al. (2009) T. J. Parolin, J. Shi, Z. Salman, K. H. Chow, P. Dosanjh, H. Saadaoui, Q. Song, M. D. Hossain, R. F. Kiefl, C. D. P. Levy, M. R. Pearson, and W. A. MacFarlane, Phys. Rev. B 80, 174109 (2009).
- Chow et al. (2012) K. H. Chow, A. I. Mansour, I. Fan, R. F. Kiefl, G. D. Morris, Z. Salman, T. Dunlop, W. A. MacFarlane, H. Saadaoui, O. Mosendz, B. Kardasz, B. Heinrich, J. Jung, C. D. P. Levy, M. R. Pearson, T. J. Parolin, D. Wang, M. D. Hossain, Q. Song, and M. Smadella, Phys. Rev. B 85, 092103 (2012).
- Smadella et al. (2009) M. Smadella, Z. Salman, K. H. Chow, M. Egilmez, I. Fan, M. D. Hossain, R. F. Kiefl, S. Kreitzman, C. Levy, W. MacFarlane, A. I. Mansour, G. D. Morris, T. J. Parolin, M. Pearson, H. Saadaoui, Q. Song, and D. Wang, Physica B 404, 924 (2009).
- Salman et al. (2011) Z. Salman, M. Smadella, W. A. MacFarlane, B. D. Patterson, P. R. Willmott, K. H. Chow, M. D. Hossain, H. Saadaoui, D. Wang, and R. F. Kiefl, Phys. Rev. B 83, 224112 (2011).
- Salman et al. (2004) Z. Salman, E. P. Reynard, W. A. MacFarlane, K. H. Chow, J. Chakhalian, S. R. Kreitzman, S. Daviel, C. D. P. Levy, R. Poutissou, and R. F. Kiefl, Phys. Rev. B 70, 104404 (2004).
- Salman et al. (2006a) Z. Salman, R. F. Kiefl, K. H. Chow, W. A. MacFarlane, S. R. Kreitzman, D. J. Arseneau, S. Daviel, C. D. P. Levy, Y. Maeno, and R. Poutissou, Physica B 374–375, 468 (2006a).
- Salman et al. (2006b) Z. Salman, R. F. Kiefl, K. H. Chow, M. D. Hossain, T. A. Keeler, S. R. Kreitzman, C. D. P. Levy, R. I. Miller, T. J. Parolin, M. R. Pearson, H. Saadaoui, J. D. Schultz, M. Smadella, D. Wang, and W. A. MacFarlane, Phys. Rev. Lett. 96, 147601 (2006b).
- Voss et al. (2014) A. Voss, M. R. Pearson, F. Buchinger, J. E. Crawford, R. F. Kiefl, C. D. P. Levy, W. A. MacFarlane, E. Mané, G. D. Morris, O. T. J. Shelbaya, Q. Song, and D. Wang, J. Phys. G: Nucl. Part. Phys. 41, 015104 (2014).
- Note (1) This sample was with capping layer. Bulk is a prototypical Mott insulator and is antiferromagnetic below . Like , is non-magnetic at , though transport measurements have shown the existence of a metallic and superconducting heterointerface; however, at an implantation energy of , only a negligible fraction of the probing ions stops in the film, or near the interface. This was confirmed for both and by using the Monte Carlo-based simulation package SRIM 2008. For this reason, this can be considered to be effectively an SLR measurement in the substrate of the film.