Experimental measurement of binding energy, selectivity and allostery using fluctuation theorems
Abstract
Thermodynamic bulk measurements of binding reactions rely on the validity of the law of mass action and the assumption of a dilute solution. Yet important biological systems such as allosteric ligand-receptor binding, macromolecular crowding, or misfolded molecules may not follow these assumptions and require a particular reaction model. Here we introduce a fluctuation theorem for ligand binding and an experimental approach using single-molecule force-spectroscopy to determine binding energies, selectivity and allostery of nucleic acids and peptides in a model-independent fashion. A similar approach could be used for proteins. This work extends the use of fluctuation theorems beyond unimolecular folding reactions, bridging the thermodynamics of small systems and the basic laws of chemical equilibrium.
Binding energies are key quantities determining the fate of intermolecular reactions stormo2010determining . Bulk experimental approaches such as surface plasmon resonance, isothermal titration calorimetry and fluorescent ligand binding assays, allow the extraction of binding energies () from measurements of the dissociation constant () with accuracy 1 kcal/mol through the expression:
| (1) |
where is the Boltzmann constant, and the temperature leavitt2001direct ; mcdonnell2001surface . However, many ligands such as DNA-binding proteins display different binding modes with varying affinities, or require the concerted action of several subunits, making quantitative measurements challenging kalodimos2004structure ; kim2013probing .
Force techniques such as optical tweezers can be used to pull on individual ligand-DNA complexes allowing detection of binding events one-at-a-time (Figure 1a, inset) bustamante2003ten ; junker2005influence ; cao2007functional ; koirala2011single ; ainavarapu2005ligand ; hann2007effect . However, force-induced ligand unbinding usually takes place in non-equilibrium conditions, and binding energies cannot be directly inferred from the measured work values. The Crooks fluctuation theorem and the Jarzynski equality jarzynski1997nonequilibrium ; crooks2000path are tools to extract equilibrium free energy differences from work distributions obtained far from equilibrium, allowing the measurement of folding free energies of nucleic acids and proteins, both from fully equilibrated liphardt2002equilibrium ; collin2005verification ; shank2010folding and kinetic states maragakis2008differential ; junier2009recovery ; alemany2012experimental . However, to date the use of fluctuation theorems remains restricted to unimolecular reactions (e.g. folding).
Here we introduce a fluctuation theorem for ligand binding (FTLB) that allows us to directly extract binding energies of bimolecular or higher-order reactions from irreversible work measurements in pulling experiments (see S1.1 in suppmaterials ). We first show how cyclic protocols allow an unambiguous classification of experimental pathways in relation to the initial and final state, which is an essential step in the application of these theorems. We then apply the FTLB to directly verify the validity of the law of mass action for dilute ligand solutions. Next we use the FTLB to accurately measure specific and nonspecific binding energies, as well as allosteric effects due to the cooperative binding of ligand pairs. Finally, we show how the FTLB is also applicable to extract binding energies to non-native structures (e.g. misfolded states, prions, chaperones), a measurement inaccesible to most bulk techniques orte2008direct ; fierz2012stability ; yu2012direct .
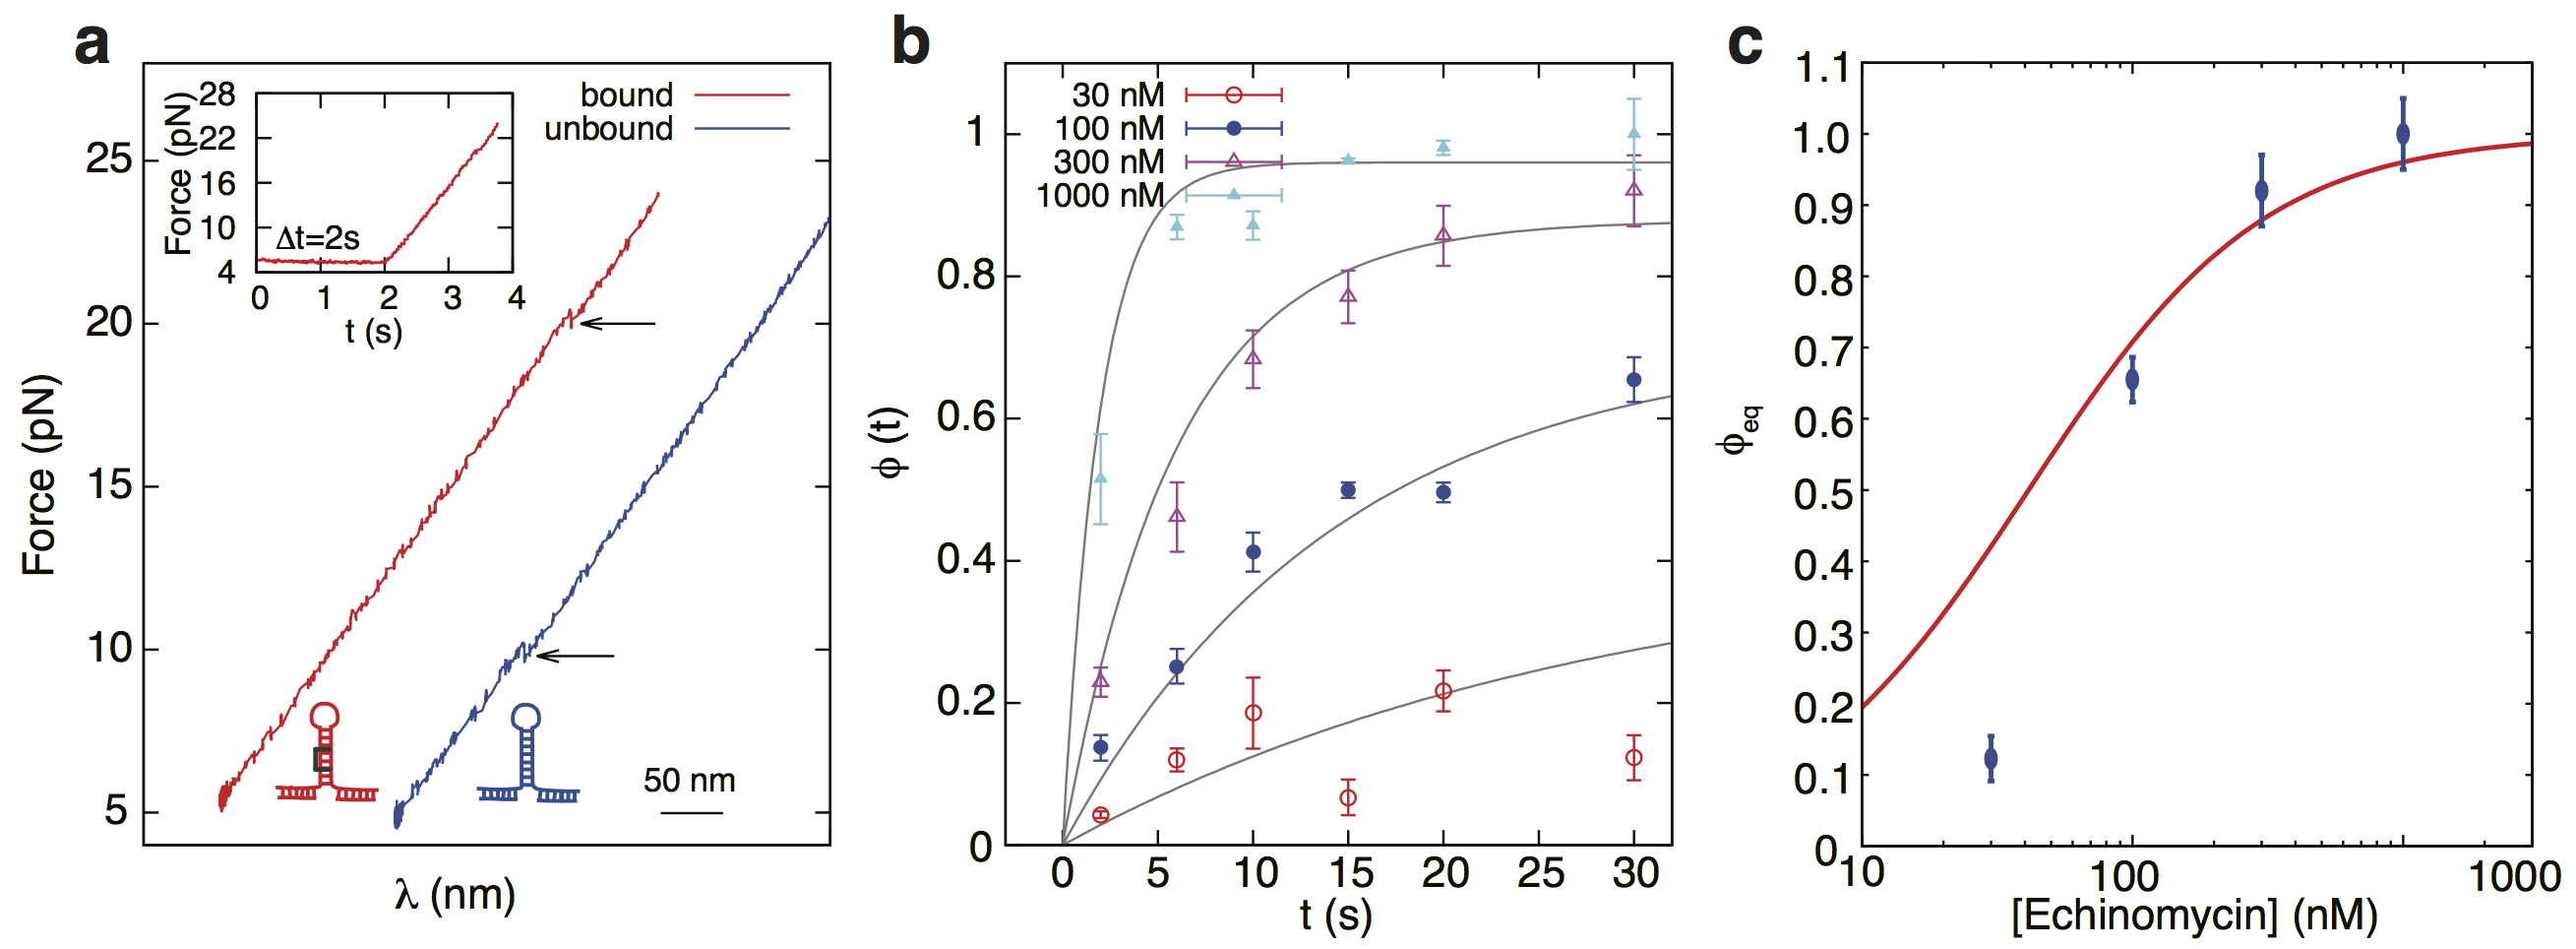
As a proof of principle we investigated the binding of the restriction endonuclease EcoRI to a 30-bp DNA hairpin that contains its recognition site (GAATTC) (see S1.2,S1.3 in suppmaterials ). Restriction endonucleases, which bind their cognate sequences with high affinity, are a paradigm of protein-DNA interactions lesser1990energetic ; jen1997protein . In a typical experiment, the hairpin is unfolded (refolded) by increasing (decreasing) the distance () between the optical trap and the micropipette (Figure 1a). In the absence of ligand, the hairpin folds and unfolds in the force range pN. The binding of EcoRI increases the stability of the hairpin leading to higher unfolding forces (23 pN). During a pulling experiment, EcoRI binds DNA when the hairpin is folded. However, since there is no net change in molecular extension upon binding/unbinding, the native () and bound () states cannot be distinguished at low forces. In contrast, at forces above pN the bound state () can be unambiguously distinguished from the unfolded state (), as the hairpin remains folded when the protein is bound but unfolds when it is unbound (Figure 1a, empty, blue and cyan dots respectively).
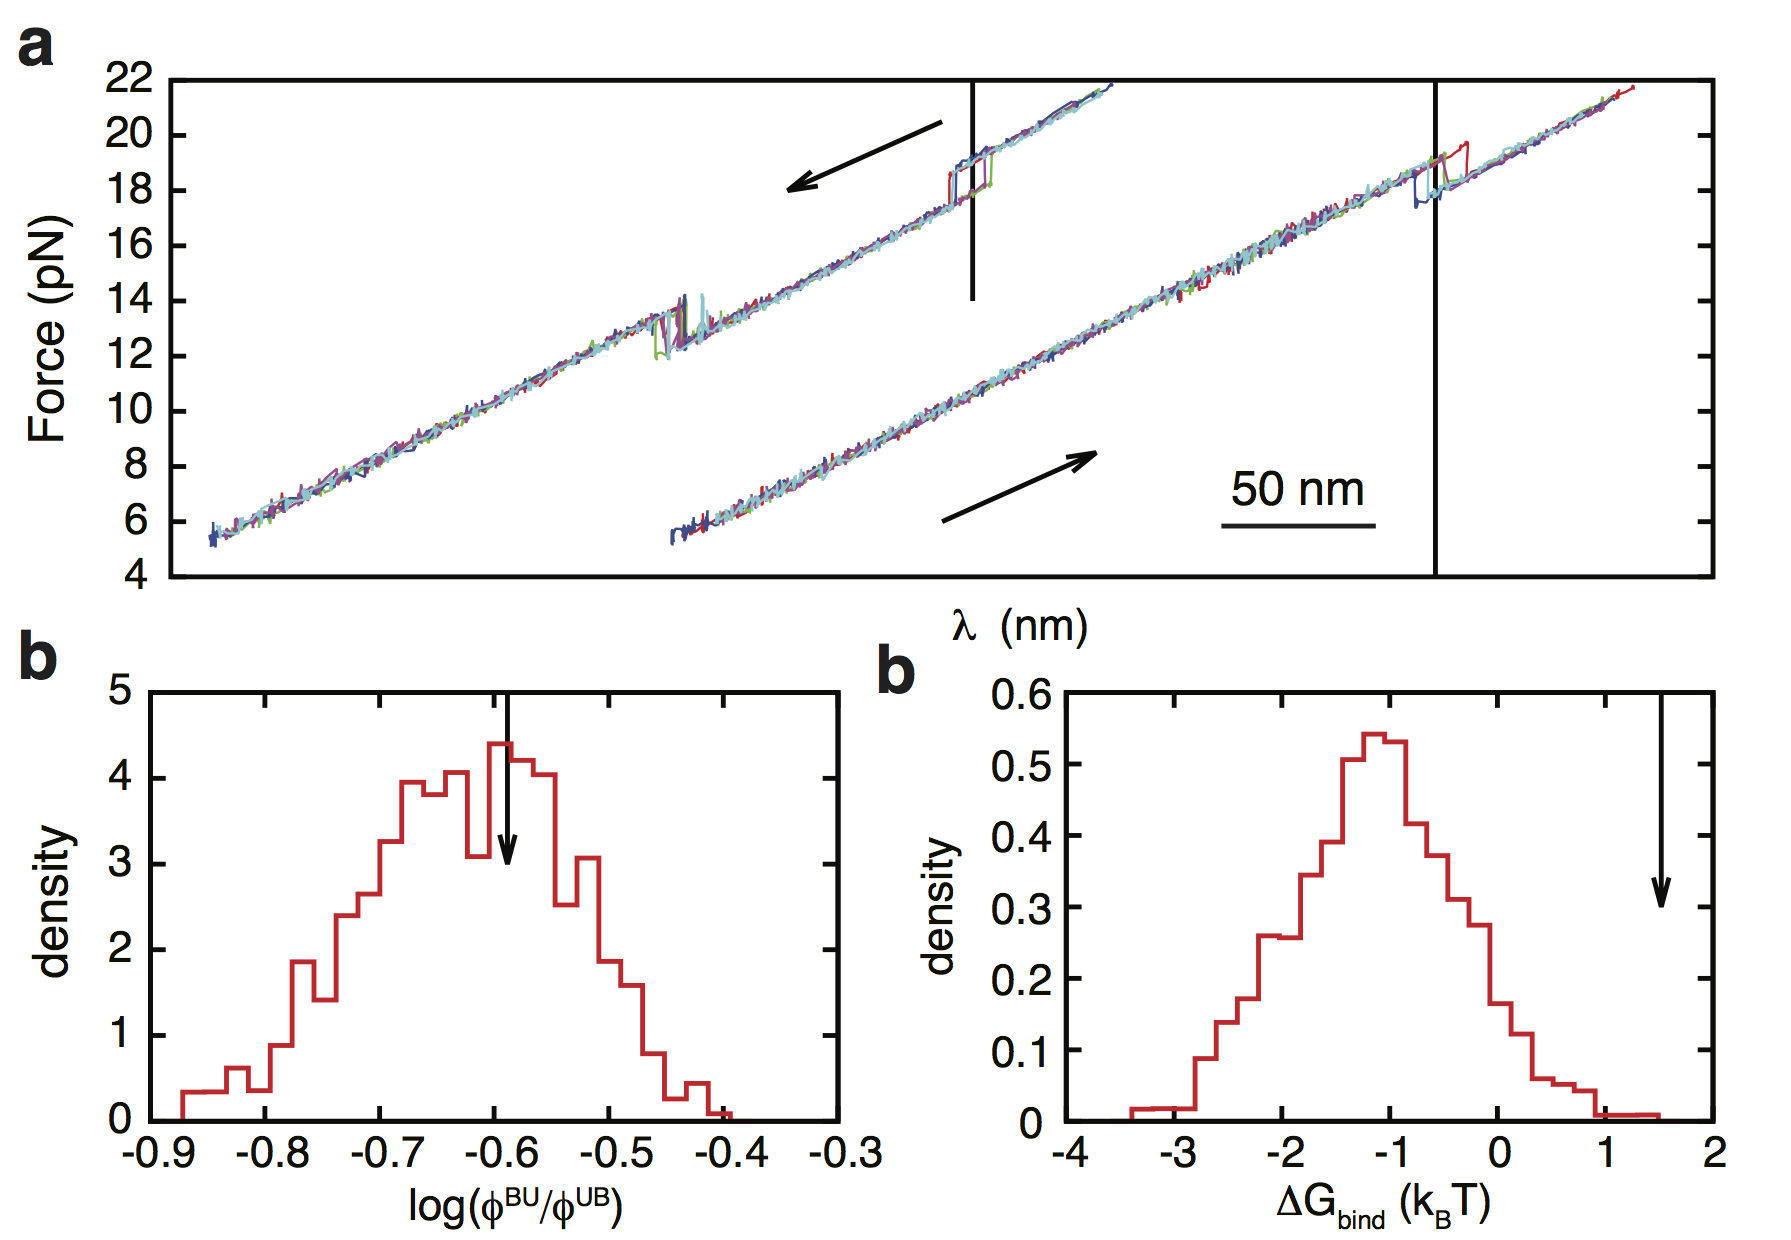
The FTLB is based on the extended fluctuation relation maragakis2008differential ; junier2009recovery ; alemany2012experimental , and relates the work () performed along a pulling protocol connecting the different EcoRI-hairpin binding states (, , ) to their thermodynamic free-energy differences. We performed cyclic protocols that start and end at a force 21 pN (Figure 1b inset and Fig. S1). This force is well above pN, resulting in paths that connect states and , that are then classified into four different sets according to their initial and final states (, , , , Figure 1c). We repeatedly pulled the hairpin and measured the partial work distributions and fraction of paths connecting states and (, , , respectively) and extracted the free-energy difference between states and , () using the FTLB (see S1.4 in suppmaterials ):
| (2) |
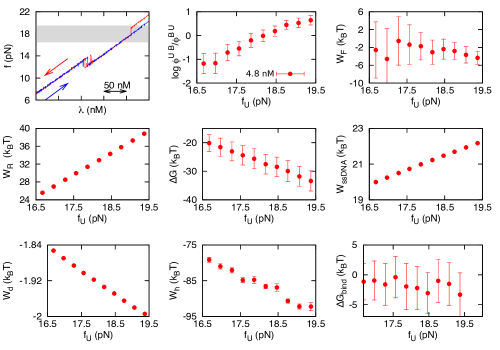
We performed experiments at different EcoRI concentrations, and determined from the work value () at which the partial work distributions cross () by taking (Figure 1d, S1.5 in suppmaterials ). The term includes all the energetic contributions involved in going from to (e.g. binding energy, conformational changes, elastic terms, see S1.6 in suppmaterials ). By subtracting the elastic contributions and the energy of formation of the hairpin from the measured value, we extract the binding energy at zero force () at different EcoRI concentrations (Figure 1e and Tables S1, S2). As shown in Figure 1e, follows the law of mass action (Eq. 1), with , providing a direct test of its validity. This value is independent on the start/end force of the cyclic protocol and relies on a correct classification of paths (Fig. S2-S3). We also performed titration experiments with varying NaCl concentration showing that EcoRI binding energy has a pronounced salt-dependency with slope (Figure 1f and Tables S3, S4), in agreement with previous bulk experiments terry1983thermodynamic ; koch2002probing . Finally, we repeated experiments with hairpins containing non-cognate DNA sequences which did not show binding in the same range of EcoRI concentrations, proving the specificity of the interaction bustamante2003ten ; koirala2011single .
To further test the validity of Eq. 2, we investigated a model system consisting of a short oligonucleotide of 10 bases that binds a DNA hairpin. The oligonucleotide can bind the substrate by base-pairing complementarity when the hairpin is in the unfolded () state, thereby inhibiting the refolding of the hairpin at low forces. At forces below the critical force range of the hairpin ( pN), the oligo-bound state () competes with the formation of the native hairpin (), and states and can be distinguished due to their different molecular extension (Figure 2a). To apply Eq. 2, we considered cyclic protocols that start and end at a force lower than the range (Figure 2b). From the measured partial work distributions and fractions of paths connecting and (Figure 2c) we extracted the binding energies at zero force () (Figure 2d and Tables S5, S6). Measured binding energies again follow the law of mass action with (Figure 2d). This agrees with theoretical predictions using the nearest-neighbour model ( ) santalucia1998unified ; huguet2010single and equilibrium experiments performed at the coexistence force of the hairpin, where hopping due to binding/unbinding is observed (Figs. S4-S6 and Table S7). The inclusion of the ratio (Figure 2d, inset) is essential to recover the correct binding energies. Previous attempts to derive binding energies using unidirectional work measurements and the Jarzynski equality did not account for concentration-dependent effects in the chemical potential that are essential in Equation 2 koirala2011single .
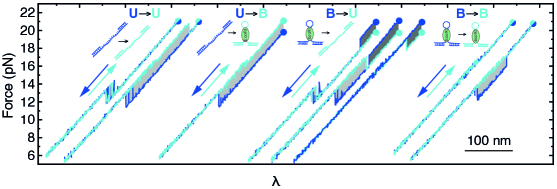
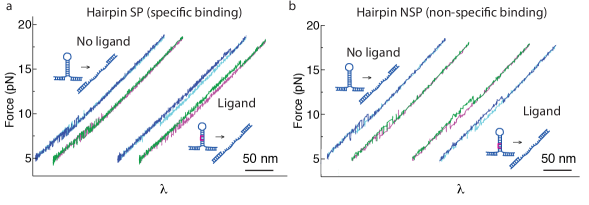
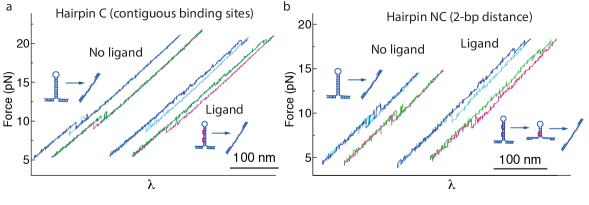
To prove the general power of the method, we studied echinomycin, a small DNA bis-intercalator with selectivity for CG steps van1984echinomycin that binds contiguous ACGT sites cooperatively bailly1996cooperativity . We performed experiments with a 12-bp DNA hairpin containing a single CG-step (SP hairpin) that shows rupture forces in the range pN (Figure 3a and Fig. S7). In the presence of echinomycin the histogram of rupture forces is shifted to higher values and shows a bimodal distribution, indicating two binding modes: a high-affinity binding to the specific CG-site (high-force peak, pN), and a low-affinity binding to other non-specific sites (low-force peak, pN). To confirm this, we pulled a hairpin in which we removed the specific binding site by inverting the CG-motif (NSP hairpin). In the presence of ligand only the low affinity peak is observed (Figure 3a).
To extract the binding energy of each mode, we performed cyclic protocols that start at a force high enough to discriminate both binding modes: we used pN ( pN) for the SP (NSP) hairpin in order to extract both the specific and nonspecific binding energy of the ligand. In this way, we obtained paths connecting states and , and extracted the binding energy of the specific and nonspecific modes (Tables S8-S11). For both binding modes, follows the law of mass action with and (Figure 3b), which give affinities of 2 nM and 1.8 M respectively (Eq. 1). This measurement of an affinity in the nM range for the specific binding is compatible with quasi-equilibrium experiments (Fig. S8) and improves previous studies where accurate measurements could not be obtained due to the concurrent action of both modes leng2003energetics .
The FTLB allows us to go beyond free-energy measurements of single ligands, and measure allosteric effects between ligands binding at nearby positions kim2013probing . For this, we designed hairpin which contains two ACGT sites separated by 2 bp (Figure 3c). The simultaneous binding of two ligands can be distinguished from the binding of a single ligand from the force rips observed in the force-distance curve (Fig. S9). By applying the FTLB we extracted the binding energy per ligand in the single and double bound states, and found that binding is favoured by the presence of a neighbouring ligand. The FTLB allows us to quantitatively test the distance-dependence of this allosteric effect by performing a differential measurement of binding energies with hairpin , which contains two contiguous sites (Figure 3c, Tables S12-S14). The binding energy per ligand we obtain in the double bound state in hairpin is higher than in hairpin , providing a direct experimental measurement of cooperativity effects in ligand pairs as a function of their distance.
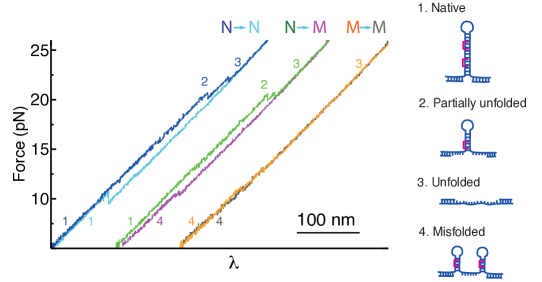
Single-molecule manipulation is particularly suited to observe the formation of misfolded structures (e.g. prions, amyloids) yu2012direct ; heidarsson2014direct , but methods to characterize binding to these species are currently lacking. By applying the FTLB it is possible to extract the binding energy to these kinetically stabilized non-native structures. By using a DNA hairpin with two binding sites separated by 4bp, we observe the formation of a misfolded structure consisting of two short (4bp) hairpins in series (Figure 3d, hairpin M). Such an off-pathway kinetic state is unobservable in the absence of ligand due to its low energy of formation, however it is kinetically stabilized by the binding of the ligand. We applied Eq. 2 by choosing a starting point of the cyclic protocol where the native-bound and misfolded-bound conformations are distinguishable ( pN), and found that the energy of binding to both configurations are equal ( , Fig. S10 and Tab. S15, S16).
In this work, we have introduced a fluctuation theorem for ligand binding (FTLB) to directly determine binding energies as a function of ligand concentration in single-molecule experiments. Using different biomolecular systems of increasing complexity we provide a single-molecule verification of the law of mass action, and show how the FTLB can account for mass exchange between a molecular system and the environment. We can resolve binding energies to specific and non-specific sites with affinities spanning six orders of magnitude. The FTLB provides a direct experimental measurement of binding energies without assuming any model or reaction scheme, which is particularly useful in cases where the law of mass action does not hold. To show this, we applied the FTLB in two situations where this may happen: the cooperative binding of multiple ligands to the same substrate and the stabilization of kinetic structures through ligand binding - both measurements inaccessible to bulk methods and relevant to many interactions between proteins and ligands.
The use of an inherently non-equilibrium method to obtain equilibrium binding energies also grants access to molecular interactions that equilibrate over very long timescales (e.g. nucleosome assembly) and that can only be currently measured by indirect techniques such as competition assays leavitt2001direct ; fierz2012stability ; thaastrom2004histone . The FTLB relates work measurements to binding energies without making any assumption on reaction kinetics or the ideal solution limit. Therefore it might be also used to test the explicit breakdown of the law of mass action in conditions where it is not applicable, for instance in crowded environments, where ligands exhibit compartmentalized dynamics due to steric hindrance interactions schnell2004reaction . Lastly, the applicabilty of the FTLB is not restricted to biomolecular reactions, and might be directly applied to other interacting systems that can only be explored through non-equilibrium methods.
I Acknowledgements
All authors acknowledge funding from grants ERC MagReps 267 862, FP7 grant Infernos 308850, Icrea Academia 2013 and FIS2013-47796- P.
All data used in this study are included in the main text and in the supplementary materials.
II Author Contributions
J.C.-S. and A.A. equally contributed to this work.
III Figure Captions
III.1 Figure 1
![[Uncaptioned image]](/html/1703.10346/assets/x1.png)
EcoRI binding to DNA. (a) Unfolding/refolding force-distance curves of a DNA hairpin in the absence (magenta/black) and presence (blue/cyan) of EcoRI protein. The bound () and unfolded () states are discriminated at high force by the presence of two distinct force branches. (b) Cyclic pulling curves classified according to their initial (blue dot) and final state (cyan dot) that start and end at a high force (21 pN). Work equals the enclosed area between the two curves and is shown in dark/light gray for positive/negative values. (c) Paths of a non-equilibrium cyclic protocol connecting different initial and final states. (d) Partial work distributions of (green) and (magenta) transitions at different EcoRI concentrations. (e) Binding energy of EcoRI (blue) and fit to the law of mass action (red line) at (130 mM , C, M). (f) Binding energy of EcoRI at varying [NaCl] (1 nM EcoRI). Error bars were obtained from bootstrap using 1000 re-samplings of size N (N is total number of pulls for each condition shown in Tables S1 and S3).
III.2 Figure 2
![[Uncaptioned image]](/html/1703.10346/assets/x2.png)
Oligo binding to DNA. (a) Scheme of native (), unfolded () and oligo bound () states. (b) Cyclic pulling curves that start and end at low forces (6 pN) classified according to their initial (blue dot) and final state (cyan dot). (c) Partial work distributions of (green) and (magenta) transitions. (d) Binding energy of the 10-base oligo (blue) and fit to the law of mass action (red line). The value obtained from hopping equilibrium experiments at [oligo]=400 nM (see S1.7 in suppmaterials ) is shown in cyan. (Inset) Contribution of the ratio to the binding energy. Error bars were obtained from bootstrap as described in Fig. 1.
III.3 Figure 3
![[Uncaptioned image]](/html/1703.10346/assets/x3.png)
Binding specificity, allostery and kinetic stabilization of misfolded states for the peptide Echinomycin. (a) First rupture force distribution of hairpins SP (red) and NSP (blue) in the absence (light) and presence (dark) of Echinomycin. (b) Binding energy of Echinomycin to a specific (red) and nonspecific (blue) site, and fit to the law of mass action. (c) Hairpins C and NC contain two specific binding sites (red boxes) placed contiguously or separated by 2-bp respectively. Binding energy per ligand when one (blue) or two ligands (green) are bound to hairpins NC or C (magenta) ([Echninomycin]=3 M). Gaussian distributions are reconstructed from mean and variance of measurements. The wider distribution for the single bound state in hairpin NC (blue) is due to the lower number of paths reaching this state at high ligand concentration, increasing measurement error. (d) Pulling cycle of hairpin M in the presence of Echinomycin. The unfolding curve (blue) shows two force rips at pN corresponding to the unbinding of two ligands bound to specific sites. In the refolding curve (cyan), the hairpin does not fold back to the native state, and misfolds into a kinetically stabilized configuration of longer molecular extension ( of refolding curves at [Echninomycin]=10 M). Error bars were obtained from bootstrap as described in Fig. 1.
IV Materials and Methods
IV.1 Mathematical proof of the Fluctuation Theorem for Ligand Binding (FTLB)
The FTLB is derived following the same steps as in junier2009recovery . Consider a system with a fluctuating number of particles , which correspond to the ligand molecules. The system evolves under an experimental protocol , where denotes the control parameter and in our case corresponds to the position of the optical trap relative to the pipette. We discretize in time the protocol as , where () denotes the value of at the time of the protocol (being the time discretization unit), and denotes the duration of the protocol. Along the protocol the system follows a given trajectory , where a sequence of configurations are sampled. The trajectory can be discretized as . Each configuration () is characterized by the number of particles, , and the degrees of freedom of each particle.
The equilibrium probability to be in a given configuration at can be written, according to the grand-canonical ensemble, as:
| (3) |
where (being the Boltzmann constant and the absolute temperature), is the fugacity of the system (equal to , being the chemical potential of the ligand molecules), is the grand canonical partition function, and is the energy of the configuration at .
We suppose that the dynamics of the system satisfy the following detailed balance condition:
| (4) |
Therefore, the probability of the system to follow a given trajectory (without imposing any initial and final configuration), and the probability to follow its time reversed is:
where .
We assume that in the forward protocol the system starts in partial equilibrium at , while in the reversed protocol it starts in partial equilibrium at (and ). The partial equilibrium probability density function of a given configuration , where is a subset of configurations accessible by the system, can be written as junier2009recovery :
| (5) |
where is equal to one if and zero otherwise, and is the grand canonical partition function restricted to the subset .
Suppose that the system starts in non-equilibrium conditions. Particularly, the system starts in partial equilibrium at the kinetic state in the forward trajectory and at at the kinetic state in the reversed one. A kinetic state is a partially equilibrated region of configurational space, meaning that during a finite amount of time the system is confined and thermalized within that region. This is mathematically described by a Boltzmann-Gibbs distribution restricted to configurations contained in that region. Then:
| (6a) | ||||
| (6b) | ||||
where:
| (7) |
is as the work exerted upon the system along the forward process.
Now we compute the average of the quantity over the forward trajectories that start in partial equilibrium in a configuration and end in . Therefore:
| (8) | ||||
| (9) | ||||
| (10) |
By defining we obtain the extended Crooks relation in the grand-canonical ensemble, or equivalently the Fluctuation Theorem for Ligand Binding (FTLB):
| (11a) | ||||
| (11b) | ||||
where .
IV.2 Force spectroscopy experiments with optical tweezers
Experiments are performed with a highly stable miniaturized dual-beam optical tweezers described in previous studies huguet2010single . The DNA hairpins are tethered between two beads by using short dsDNA handles (29-bp) that are differentially end-labelled with biotin and digoxigenin to attach each handle to a different bead (see Supp. Section IV.3 for hairpin sequences and synthesis details) forns2011improving . Pulling speed is set at 190 nm/s in all the experiments. For the EcoRI experiments, longer dsDNA handles (600-bp) are used to reduce nonspecific interactions mediated by the protein and beads. For these experiments, the microfluidics chamber was also coated with Poly(ethylene glycol) (PEG) to avoid protein loss due to nonspecific absorption on the glass surface cheng2011single . Experimental conditions for each interaction were chosen to be comparable to previous ensemble and single-molecule studies: for EcoRI (Hepes 10 mM pH7.5, EDTA 1 mM, NaCl 130 mM, BSA 0.1 mg/ml, 100 M, DTT, 0.01% NaN3) and salt titrated in the range 60-180 mM NaCl; for the oligonucleotide (Tris 10 mM pH7.5, EDTA 1 mM, 100 mM NaCl, 0.01% NaN3); and for echinomycin (Tris 10 mM pH7.5, EDTA 1 mM, 100 mM NaCl, 2% DMSO, 0.01% NaN3). All ligands were obtained from commercial sources and used without further purification: EcoRI (New England Biolabs, 100 U/l, 800 nM dimer), oligonucleotide (Eurofins MWG Operon, HyPur grade), Echinomycin (Merck Millipore). Concentrations were confirmed using a spectrophotometric analysis for the oligonucleotide (extinction coefficient 97400 M-1cm-1 at =260 nm) and echinomycin (extinction coefficient 11500 M-1cm-1 at =325 nm), whereas for EcoRI we performed an electrophoretic mobility shift assay using previously described protocols sidorova1996differences . All experiments were performed at 25℃. In all the cases, the number of cycles obtained per molecule range between 20 and 1300. A minimum of 2 and a maximum of 10 molecules were pulled in each case (see tables 1, 3, 5, 8, 10, 12 15).
IV.3 DNA hairpins used in this work
DNA hairpin sequences, secondary structure, binding sites, thermodynamic information and synthesis details:
![[Uncaptioned image]](/html/1703.10346/assets/AllH2.png)
| Haipin | () | Handle length |
|---|---|---|
| EcoRI | 65 3 | long |
| Rev | 67 2 | long |
| Rnd | 68 2 | long |
| Oligo | 28 1 | short |
| SP | 19.7 0.5 | short |
| NSP | 19.4 0.3 | short |
| C | 18 1 | short |
| NC | 18 1 | short |
| M (Native) | 33 1 | short |
| (Misfolded) | 10 1 |
Blue-Top. Hairpins used to study the binding of EcoRI to its recognition sequence (5’-GAATTC-3’). Hairpin EcoRI contains the specific binding site, indicated in red; Hairpin Rev contains its reversed sequence (red); and Hairpin Rnd contains a random sequence (red). We did not observe binding of EcoRI to hairpins Rnd and Rev in pulling experiments using these hairpins.
Red-Middle. Hairpin (left) used to study the specific binding of an oligonucleotide (right) to its complementary ssDNA sequence. The binding site of the oligo is indicated in red.
Green-Bottom. Hairpins used to study the binding of echinomycin to different binding motifs. Hairpin SP contains a specific binding site 5’-ACGT-3’ (red). In hairpin NSP the specific binding site is removed by doing a sequence permutation (red). Hairpin C contains two contiguous binding sites (red), while hairpin NC contains two binding sites separated by two basepairs (red). Hairpin M contains two binding sites that are separated by four base pairs (hairpin M, native). In the presence of echinomycin, a misfolded structure containing two serially connected hairpins (hairpin M, misfolded) becomes kinetically stabilized by the binding of the ligand to two 4-bp hairpins containing the 5’-ACGT-3’ motif (red).
Mean values for the free energy of formation at zero force at 25℃ and 130 mM NaCl (which are the experimental conditions unless stated otherwise) have been obtained by averaging over the results provided by the nearest-neighbor model and the unified oligonucleotide set of basepair free energies measured in bulk mfold ; santalucia1998unified and unzipping huguet2010single experiments. Error bars are standard errors obtained between the two different estimations. To pull on the hairpins, handles of two different length are used in the experiments: short (29 bp) and long (500 bp) dsDNA handles.
For the experiments with echinomycin and the oligonucleotide we used a short handle construct (total handle length: 58-bp). This short handles construct is better suited to study small ligands that might non-specifically bind to the dsDNA handles. Due to the short length of this construct, it can be synthesized by direct annealing and ligation of three partially complementary oligonucleotides that create the hairpin structure and dsDNA handles, as described in previous studies forns2011improving .
For the experiments performed with EcoRI we used a long handle construct to maintain a larger separation between the two beads at low forces (total handle length: 1322-bp). The synthesis is similar to the protocol described in forns2011improving . Briefly, the two handles are performed by PCR amplification of plasmid pBR322 to obtain DNA fragments that contain a restriction site for TspRI or Tsp45I respectively, but do not contain potential binding sites for the ligand (i.e. EcoRI). A biotin tag is introduced in one of the handles using a 5’-biotinylated primer on the PCR reaction. The other handle is tailed with digoxigenin-dUTP using the 3’-5’ exonuclease activity of T4 DNA polymerase. After digestion of the labelled products with each enzyme, the TspRI/Tsp45I cohesive ends are used to anneal and ligate the handles to the the hairpin structure, that is assembled using oligonucleotides.
IV.4 Application of the FTLB: how to
To apply the FTLB to cyclic pulling protocols we follow the next steps:
-
1.
Identification of initial and final states in the non-equilibrium protocol.
In the particular cases studied in our work, initial and final states in the cyclic pulling experiments are:
-
•
Specific binding of EcoRI to dsDNA: and (high forces).
-
•
Specific binding of an oligo to ssDNA: and (low forces).
-
•
Specific binding of echinomycin to dsDNA: and (high forces).
-
•
Non-specific binding of echinomycin to dsDNA: and (high forces).
-
•
Cooperative binding of echinomycin to dsDNA: , and (high forces).
-
•
Kinetically-stabilized non-native structures due to the simultaneous binding of two echinomycin ligands to dsDNA, misfolded: , .
-
•
-
2.
Classification of trajectories.
Each trajectory can be classified as a function of the initial and final state. For instance, in EcoRI experiments we have four types of trajectories: () start at and end at ; () start at and end at ; () start at and end at ; and () start at and end at .
-
3.
Obtain partial work distributions.
In each cyclic trajectory, the work is calculated as the area enclosed in the trajectory. The partial work distribution is the histogram of work values restricted to each type of trajectory.
-
4.
Obtain the grand-canonical partial partition function for the intial and the final state.
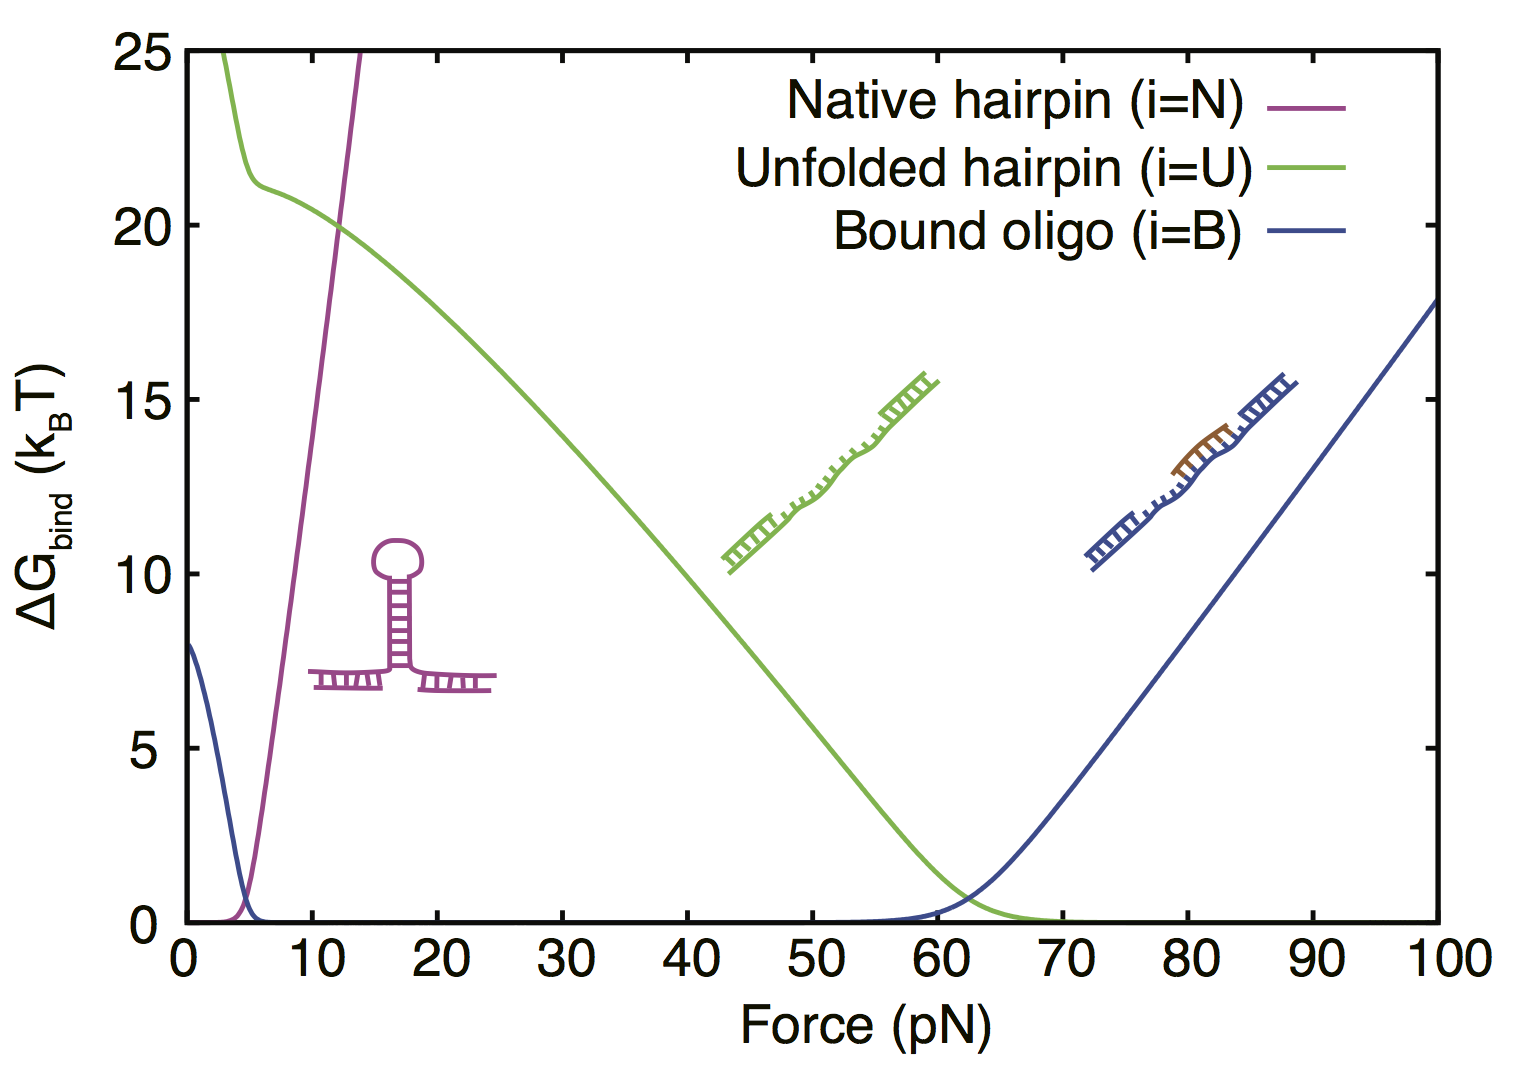
The partial partition function for a state is computed in the restricted subset of configurations that characterize state :
(12) where and are the number of bound particles and the energy in configuration , is the fugacity, and is the chemical potential of the binding agent.
In the particular cases studied in this work these are:
-
•
Specific binding of EcoRI and echinomycin to dsDNA.
The term is the free energy of the hairpin in state at . The term is the free energy of the hairpin at with unfolded basepairs in the hairpin stem prior to the binding site, is the binding energy of the ligand and is its chemical potential. We refer to as the binding free energy .
-
•
Specific binding of a short oligo to its complementary ssDNA sequence.
where and are the free energies of the hairpin at in the folded () or unfolded () state respectively, and is the binding free energy of the oligonucleotide.
-
•
Non-specific binding of echinomycin to dsDNA.
where () is a possible binding state (echinomycin binding to any site in dsDNA), is the binding free energy at position and is the free energy of the hairpin at where the basepairs prior to the position binding site of echinomycin are unfolded.
The FTLB applies to each pair os states and , therefore:
(14) By assuming that and , () and:
(15) (16) it can be shown that:
(17a) (17b) where .
-
•
Simultaneous specific binding of two echinomycin molecules to sequential dsDNA sites (cooperativity).
-
•
Stabilization of misfolded states through simultaneous binding of two echinomycin molecules to sequential dsDNA sites.
-
•
-
5.
Plug everything into the FTLB.
-
6.
Extract the elastic contributions to in order to get the binding free energy (Section IV.6).
IV.5 Bennett acceptance ratio method
The Bennett acceptance ratio method is used to estimate the free-energy difference between two states that satisfies Eq. (11) from non-equilibrium work measurements. Given a set of () forward (reversed) work measurements , it is shown in bennett ; shirts that the solution of the following transcendental equation:
| (21) |
where:
| (22a) | |||
| (22b) |
minimizes the statistical variance of the free energy estimation for .
IV.6 Energetic contributions to the binding free energy
The free energy difference obtained by using the FTLB contains the binding free energy of the ligand to the given substrate plus elastic and thermodynamic energetic contributions of the experimental setup , which can be described as follows:
| (23a) | ||||
| (23b) | ||||
Here, () stands for the configuration of the hairpin at the beginning (ending) of the cyclic protocol at . In what follows, () is the force acting on the molecular setup when the hairpin is in state () at .
The term is the difference between the free energy of formation of the conformations of the DNA hairpin in states and . This term depends on the sequence of the hairpin and is usually calculated using the nearest-neighbor model and the unified oligonucleotide set of basepair free energies huguet2010single ; mfold or can be recovered from pulling experiments performed in the absence of binding agents using fluctuation relations collin2005verification .
The two terms and correspond to the reversible work needed to stretch the handles and move the bead captured in the optical trap from state to state . For short handles:
| (24) |
where is the effective stiffness of the experimental setup, equal to the slope of the force-distance curve measured in the force-branch corresponding to the native state of the hairpin. For long handles:
| (25) |
where () is the equilibrium end-to-end distance of the handles at force (), which is calculated according to the worm-like chain model using a persistence length equal to 43.7 nm, a contour length equal to 446.08 nm and a Young modulus of 1280 pN joanthio ; and pN/nm is the stiffness of the optical trap in our setup forns2011improving .
The term corresponds to the difference between the reversible work needed to stretch the released single stranded DNA in configurations and from zero force to and , respectively. This is calculated according to:
| (26) |
where equilibrium relation between the force and the end-to-end distance and its inverse are modeled according to the worm-like chain ideal elastic model with a persistence length equal to 1.35 nm and an inter-phosphate distance of 0.59 nm/base, and the number of bases released as single-stranded DNA depends on state or alemany14 .
The term is the difference between reversible work needed to orient the double-helix diameter between states and :
| (27) |
The helix diameter is modeled as a single bond of length nm that is oriented due to the action of an external force alemany14 ; forns2011improving .
IV.7 Equilibrium experiments for the hairpin-oligonucleotide system
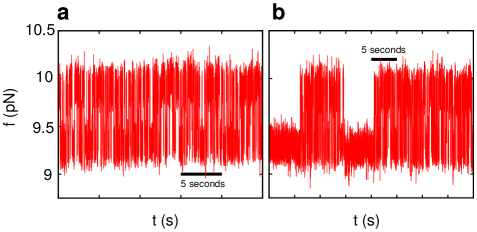
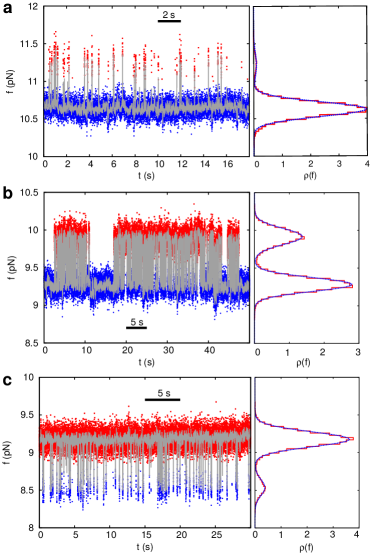
In equilibrium experiments in passive-mode the position of the optical trap is held constant. Hairpin “Oligo” (section IV.3) hops rapidly between the unfolded (low forces) and the folded (high forces) states (Fig. 4a) forns2011improving . The binding and unbinding of the 10-bp oligonucleotide to its complementary sequence in the hairpin occur at a slower timescale (several seconds), and consequently binding/unbinding events can be readily identified in experiments in which a concentration of binding oligonucleotide is present (Fig. 4b).
To extract the binding free energy of the oligo to the unfolded DNA hairpin we consider the reaction pathway , where corresponds to the state where the hairpin is in its native state, corresponds to the state where the hairpin is unfolded (and the oligo is not bound), and corresponds to the state where the hairpin is unfolded and an oligo bound. Since in equilibrium experiments we cannot distinguish between states and due to the very similar extension of dsDNA and ssDNA at the relevant range of forces for these experiments (Fig. 4b) comstock2011ultrahigh , we define the joint probability . By considering that detailed balance is verified, it can be shown that:
| (28) |
In Fig. 5 we show force-time trajectories with the corresponding experimental probability density functions obtained at different values of at 400 nM oligo. From the fit to a double Gaussian (blue dashed line) we can extract the weights and , and determine the two forces levels ( and ) as the average force of each Gaussian peak. In Table 7 we summarize the different contributions to extract for three different experimental traces. Since , the terms , and equal zero.
In average, we find that at a concentration of 400 nM oligo , in good agreement with the theoretical predictions and with the results obtained by applying the FTLB in non-equilibrium pulling experiments.
V Supplementary Figures
VI Supplementary Tables
| [EcoRI] (nM) | pulled molecules (number of cycles per molecule) | total cycles |
|---|---|---|
| 0.25 | 5 (141, 87, 95, 360, 101) | 784 |
| 0.50 | 8 (297, 93, 43, 101, 40, 18, 137, 27) | 756 |
| 1.00 | 8 (852, 555, 486, 48, 153, 76, 159, 404) | 2733 |
| 2.40 | 8 (170, 356, 350, 433, 212, 93, 245, 126) | 1985 |
| 4.80 | 3 (413, 339, 349) | 1101 |
| 10.0 | 10 (470, 317, 290, 242, 87, 200, 248, 401, 102, 396) | 2753 |
| 20.0 | 3 (257, 242, 668) | 1167 |
| (pN) | (pN) | ||||
|---|---|---|---|---|---|
| 19.770.01 | 18.540.01 | 422 | -921 | 21.510.01 | -1.9550.001 |
| [EcoRI] (nM) | |||||
|---|---|---|---|---|---|
| 0.25 | 0.40.1 | 0.120.03 | 1.20.3 | -292 | 24 |
| 0.50 | 0.240.05 | 0.220.02 | 0.10.2 | -252 | 54 |
| 1.00 | 0.150.03 | 0.310.02 | -0.80.1 | -231 | 53 |
| 2.40 | 0.240.04 | 0.260.03 | -0.20.2 | -242 | 82 |
| 4.80 | 0.240.04 | 0.270.03 | -0.10.2 | -272 | 53 |
| 10.0 | 0.170.02 | 0.710.05 | -1.50.1 | -221 | 81 |
| 20.0 | 0.130.02 | 0.830.03 | -1.90.1 | -231 | 81 |
| [NaCl] (mM) | pulled molecules (number of cycles per molecule) | total cycles |
|---|---|---|
| 60 | 15 (156, 69, 525, 60, 61, 35, 21, 43, 713, 258, 433, 58, 78, 162, 83) | 2755 |
| 75 | 6 (263, 312, 519, 506, 156, 302) | 2058 |
| 100 | 7 (276, 273, 516, 577, 128, 494, 235) | 2499 |
| 130 | 8 (852, 555, 486, 48, 153, 76, 159, 404) | 2733 |
| 180 | 8 (654, 323, 88, 298, 61, 423, 211, 80) | 2138 |
| (pN) | (pN) | |||
|---|---|---|---|---|
| 19.760.01 | 18.560.01 | -911 | 21.540.01 | -1.9550.001 |
| [EcoRI] (nM) | ||||||
|---|---|---|---|---|---|---|
| 60 | 392 | 0.0560.008 | 0.80.1 | -2.50.4 | -193 | 133 |
| 75 | 402 | 0.060.01 | 0.70.1 | -2.50.4 | -201 | 112 |
| 100 | 412 | 0.140.02 | 0.290.05 | -0.90.2 | -252 | 52 |
| 130 | 422 | 0.150.03 | 0.310.02 | -0.80.1 | -231 | 61 |
| 180 | 442 | 0.440.07 | 0.060.02 | 1.60.4 | -272 | 02 |
| [oligo] (nM) | pulled molecules (number of cycles per molecule) | total cycles |
|---|---|---|
| 25 | 2 (25, 244) | 269 |
| 50 | 7 (57, 131, 72, 242, 311, 98 46) | 957 |
| 100 | 6 (182, 198, 22, 435, 368, 386) | 1591 |
| 200 | 5 (28, 17, 59, 67, 87) | 258 |
| 400 | 4 (264, 123, 213, 109) | 709 |
| 1000 | 10 (59, 56, 288, 293, 325, 224, 83, 432, 317) | 2077 |
| 2000 | 5 (185, 603, 74, 273, 147) | 1282 |
| (pN) | (pN) | ||||
|---|---|---|---|---|---|
| 6.200.06 | 6.800.06 | -27.50.8 | 16.50.5 | -4.810.05 | 0.8960.008 |
| [oligo] (nM) | |||||
|---|---|---|---|---|---|
| 25 | 1.0∗ | 0.0300.004 | 3.60.1 | -11.30.7 | 41 |
| 50 | 0.960.04 | 0.0370.006 | 3.40.2 | -11.80.6 | 31 |
| 100 | 0.940.03 | 0.0620.006 | 2.790.08 | -11.00.6 | 41 |
| 200 | 0.870.08 | 0.090.03 | 2.30.3 | -9.20.4 | 61 |
| 400 | 0.860.06 | 0.180.03 | 1.60.3 | -8.40.3 | 71 |
| 1000 | 0.490.05 | 0.450.04 | 0.370.07 | -7.70.5 | 71 |
| 2000 | 0.370.02 | 0.600.04 | -0.50.1 | -6.50.8 | 81 |
| trace | (pN) | (pN) | ||||
|---|---|---|---|---|---|---|
| a | 11.22 | 0.05 | 10.62 | 0.01 | 0.038 | 0.006 |
| b | 9.92 | 0.01 | 9.28 | 0.01 | 0.364 | 0.004 |
| c | 9.18 | 0.01 | 8.53 | 0.01 | 0.901 | 0.005 |
| -29 | 2 | 10.4 | 0.5 | 1.40 | 0.02 | -2.4 | 0.5 | 7.5 | 1 |
| -28 | 2 | 9.3 | 0.5 | 1.27 | 0.02 | -2.1 | 0.5 | 6 | 1 |
| -25 | 3 | 8.7 | 0.5 | 1.19 | 0.02 | -1.9 | 0.5 | 6 | 1 |
| [Echi] (nM) | pulled molecules (number of cycles per molecule) | total cycles |
|---|---|---|
| 100 | 7 (121, 408, 369, 277, 98, 484, 261) | 2018 |
| 300 | 6 (496, 271, 201, 341, 600, 511) | 2420 |
| 1000 | 9 (1302, 1272, 486, 978, 420, 121, 327, 470, 196) | 5572 |
| 3000 | 6 (670, 175, 1010, 399, 1268, 475) | 3997 |
| (pN) | (pN) | ||||
|---|---|---|---|---|---|
| 16.770.02 | 16.250.02 | 10.50.3 | -33.00.8 | 8.250.03 | -1.7900.006 |
| [Echi] (nM) | |||||
|---|---|---|---|---|---|
| 100 | 0.50.1 | 0.0460.005 | -2.20.4 | -10.80.4 | 32 |
| 300 | 0.460.07 | 0.1120.008 | -1.30.2 | -10.60.6 | 52 |
| 1000 | 0.270.04 | 0.180.05 | 0.50.4 | -10.30.8 | 52 |
| 3000 | 0.1580.008 | 0.590.04 | 1.30.1 | -8.6 0.6 | 101 |
| [Echi] (nM) | pulled molecules (number of cycles per molecule) | total cycles |
|---|---|---|
| 100 | 6 (131, 145, 761, 492, 230, 567) | 2326 |
| 300 | 8 (504, 506, 528, 455, 46, 320, 219, 275) | 2853 |
| 1000 | 8 (779, 560, 547, 814, 666, 342, 377, 519) | 4604 |
| 3000 | 7 (310, 150, 268, 872, 241, 584, 533) | 2958 |
| (pN) | (pN) | |||||
|---|---|---|---|---|---|---|
| 0 | 10.730.06 | 10.170.05 | 19.90.2 | -26.50.4 | 8.200.04 | -1.3450.006 |
| 1 | 10.690.06 | 10.170.05 | 16.80.2 | -24.30.3 | 7.590.04 | -1.3400.006 |
| 2 | 10.640.06 | 10.170.05 | 13.70.2 | -22.10.3 | 6.900.03 | -1.3360.006 |
| 3 | 10.600.06 | 10.170.05 | 11.640.07 | -20.00.3 | 6.390.03 | -1.3320.006 |
| 4 | 10.550.06 | 10.170.05 | 10.50.1 | -17.80.3 | 5.790.03 | -1.3270.006 |
| 5 | 10.500.06 | 10.170.05 | 8.430.02 | -15.60.4 | 5.190.02 | -1.3230.006 |
| 6 | 10.480.06 | 10.170.05 | 4.630.06 | -13.80.5 | 4.610.02 | -1.3200.006 |
| 7 | 10.430.06 | 10.170.05 | 2.50.1 | -11.60.5 | 4.020.02 | -1.3160.006 |
| 8 | 10.380.06 | 10.170.05 | 1.40.1 | -9.40.5 | 3.440.02 | -1.3110.006 |
| 9 | 10.330.06 | 10.170.05 | -0.110.06 | -7.20.6 | 2.870.01 | -1.3070.006 |
| 10 | 10.290.06 | 10.170.05 | -1.180.03 | -5.10.6 | 2.290.01 | -1.3020.006 |
| 11 | 10.240.06 | 10.170.05 | -2.710.03 | -2.90.7 | 1.730.01 | -1.2960.006 |
| [Echi] (nM) | |||||
|---|---|---|---|---|---|
| 100 | 0.700.07 | 0.120.03 | 1.90.2 | -4.50.2 | -21 |
| 300 | 0.530.07 | 0.300.01 | 0.50.1 | -3.30.2 | -11 |
| 1000 | 0.370.02 | 0.460.03 | -0.20.1 | -2.60.2 | 01 |
| 3000 | 0.210.04 | 0.700.05 | -1.30.3 | -1.20.4 | 11 |
| Hairpin | pulled molecules (number of cycles per molecule) | total cycles |
|---|---|---|
| HC | 7 (40, 348, 312, 324, 603, 352, 374) | 2353 |
| HNC | 6 (997, 300, 193, 325, 845, 125) | 2785 |
| Hairpin | (pN) | (pN) | ||||
|---|---|---|---|---|---|---|
| C | 20.00.2 | 19.40.2 | 18.30.8 | -51.10.4 | 12.100.07 | -1.9670.008 |
| NC | 16.670.05 | 15.940.05 | 18.30.8 | -411 | 10.560.03 | -1.7850.003 |
| Hairpin | |||||
|---|---|---|---|---|---|
| C | 0.260.05 | 0.720.03 | -1.10.3 | -141 | 4.50.5 |
| NC | 0.40.1 | 0.150.02 | 0.90.3 | -81 | 2.60.4 |
| Hairpin | (pN) | (pN) | ||||
|---|---|---|---|---|---|---|
| NC | 16.10.2 | 15.950.06 | 6.60.4 | -152 | 5.650.01 | -1.7570.006 |
| 0.60.2 | 0.0310.006 | 3.10.3 | -91 | -52 |
| pulled molecules (number of cycles per molecule) | total cycles |
| 3 (101, 300, 314) | 715 |
| (pN) | (pN) | ||||
|---|---|---|---|---|---|
| 7.320.03 | 6.750.05 | 231 | -161 | 3.480.02 | 0.6060.006 |
| 0.460.06 | 0.560.03 | -0.20.2 | 171 | 21 |
References
- (1) G. D. Stormo, & Y. Zhao. Determining the specificity of protein–DNA interactions. Nat. Rev. Genet. 11, 751–760 (2010).
- (2) S. Leavitt, & E. Freire. Direct measurement of protein binding energetics by isothermal titration calorimetry. Curr. Opin. Struct. Biol. 11, 560–566 (2001).
- (3) J. M. McDonnell. Surface plasmon resonance: towards an understanding of the mechanisms of biological molecular recognition. Curr. Opin. Chem. Biol. 5, 572–577 (2001).
- (4) C. G. Kalodimos, et al. Structure and flexibility adaptation in nonspecific and specific protein-DNA complexes. Science 305, 386–389 (2004).
- (5) S. Kim, et al. Probing allostery through DNA. Science 339, 816–819 (2013).
- (6) C. Bustamante, Z. Bryant, & S.B. Smith. Ten years of tension: single-molecule DNA mechanics. Nature 421, 423–427 (2003).
- (7) J.P. Junker, K. Hell, M. Schlierf, W. Neupert, & M. Rief. Influence of substrate binding on the mechanical stability of mouse dihydrofolate reductase. Biophys. J. 89, L46–L48 (2005).
- (8) Y. Cao, M.M. Balamurali, D. Sharma, & H. Li. A functional single-molecule binding assay via force spectroscopy. Proc. Natl. Acad. Sci. U.S.A. 104, 15677–15681 (2007).
- (9) D. Koirala, et al. A single-molecule platform for investigation of interactions between G-quadruplexes and small-molecule ligands. Nature Chem. 3, 782–787 (2011).
- (10) S. R. K. Ainavarapu, L. Lewyn, C. Badilla, & J.M. Fernandez Ligand binding modulates the mechanical stability of dihydrofolate reductase Biophys. J. 89, 3337–44 (2005).
- (11) H. Eleanore, et al. The effect of protein complexation on the mechanical stability of Im9. Biophys. J. 92, L79–L81 (2007).
- (12) C. Jarzynski. Nonequilibrium equality for free energy differences. Phys. Rev. Lett. 78, 2690 (1997).
- (13) G. E. Crooks. Path-ensemble averages in systems driven far from equilibrium. Phys. Rev. E 61, 2361 (2000).
- (14) J. Liphardt, S. Dumont, S. B. Smith, I. Tinoco, & C. Bustamante. Equilibrium information from nonequilibrium measurements in an experimental test of Jarzynski’s equality. Science 296, 1832–1835 (2002).
- (15) D. Collin, et al. Verification of the crooks fluctuation theorem and recovery of RNA folding free energies. Nature 437, 231–234 (2005).
- (16) E. A. Shank, C. Cecconi, J. W. Dill, S. Marqusee, & C. Bustamante. The folding cooperativity of a protein is controlled by its chain topology. Nature 465, 637–640 (2010).
- (17) P. Maragakis, M. Spichty, & M. Karplus. A differential fluctuation theorem. J. Phys. Chem. B 112, 6168–6174 (2008).
- (18) I. Junier, A. Mossa, M. Manosas, & F. Ritort. Recovery of free energy branches in single molecule experiments. Phys. Rev. Lett. 102, 070602 (2009).
- (19) A. Alemany, A. Mossa, I. Junier, & F. Ritort. Experimental free-energy measurements of kinetic molecular states using fluctuation theorems. Nature Phys. 8, 688–694 (2012).
- (20) Materials and methods are available as supplementary materials on Science Online.
- (21) A. Orte, et al. Direct characterization of amyloidogenic oligomers by single-molecule fluorescence. Proc. Natl. Acad. Sci. U.S.A. 105, 14424–14429 (2008).
- (22) B. Fierz, S. Kilic, A. R. Hieb, K. Luger, & T. W. Muir. Stability of nucleosomes containing homogenously ubiquitylated H2A and H2B prepared using semisynthesis. J. Am. Chem. Soc. 134, 19548–19551 (2012).
- (23) H. Yu, et al. Direct observation of multiple misfolding pathways in a single prion protein molecule. Proc. Natl. Acad. Sci. U.S.A. 109, 5283–5288 (2012).
- (24) D. R. Lesser, M. R. Kurpiewski, & L. Jen-Jacobson. The energetic basis of specificity in the EcoRI endonuclease–DNA interaction. Science 250, 776–786 (1990).
- (25) L. Jen-Jacobson. Protein–DNA recognition complexes: Conservation of structure and binding energy in the transition state. Biopolymers 44, 153–180 (1997).
- (26) B. Terry, W. Jack, R. Rubin, & P. Modrich. Thermodynamic parameters governing interaction of EcoRI endonuclease with specific and nonspecific DNA sequences. J. Biol. Chem. 258, 9820–9825 (1983).
- (27) S. J. Koch, A. Shundrovsky, B. C. Jantzen, & M. D. Wang. Probing protein-DNA interactions by unzipping a single DNA double helix. Biophys. J. 83, 1098–1105 (2002).
- (28) J. SantaLucia. A unified view of polymer, dumbbell, and oligonucleotide DNA nearest-neighbor thermodynamics. Proc. Natl. Acad. Sci. U.S.A. 95, 1460–1465 (1998).
- (29) J. M. Huguet, et al. Single-molecule derivation of salt dependent base-pair free energies in DNA. Proc. Natl. Acad. Sci. U.S.A. 107, 15431–15436 (2010).
- (30) M. M. Van Dyke, & P. B. Dervan. Echinomycin binding sites on DNA. Science 225, 1122–1127 (1984).
- (31) C. Bailly, F. Hamy, & M. J. Waring. Cooperativity in the binding of echinomycin to DNA fragments containing closely spaced CpG sites. Biochemistry 35, 1150–1161 (1996).
- (32) F. Leng, J. B. Chaires, & M. J. Waring. Energetics of echinomycin binding to DNA. Nucleic Acids Res. 31, 6191–6197 (2003).
- (33) P. O. Heidarsson, et al. Direct single-molecule observation of calcium-dependent misfolding in human neuronal calcium sensor-1. Proc. Natl. Acad. Sci. U.S.A. 111, 13069–13074 (2014).
- (34) A. Thåström, J. Gottesfeld, K. Luger, & J. Widom. Histone-DNA binding free energy cannot be measured in dilution-driven dissociation experiments. Biochemistry 43, 736–741 (2004).
- (35) S. Schnell, & T. E. Turner. Reaction kinetics in intracellular environments with macromolecular crowding: simulations and rate laws. Prog. Biophys. Mol. Bio. 85, 235–260 (2004).
- (36) N. Forns, et al. Improving signal/noise resolution in single-molecule experiments using molecular constructs with short handles. Biophys. J. 100, 1765–1774 (2011).
- (37) W. Cheng, S. G. Arunajadai, J. R. Moffitt, I. Tinoco, & C. Bustamante. Single base pair unwinding and asynchronous RNA release by the hepatitis C virus NS3 helicase. Science 333, 1746–1749 (2011).
- (38) N. Y. Sidorova, & D. C. Rau. Differences in water release for the binding of EcoRI to specific and nonspecific DNA sequences. Proc. Natl. Acad. Sci. U.S.A. 93, 12272–12277 (1996).
- (39) M. Zuker. Mfold web server for nucleic acid folding and hybridization prediction. Nucleic Acids Res. 31, 3406–3415 (2003).
- (40) C. H. Bennett. Efficient estimation of free energy differences from Monte Carlo data. J. Comput. Phys. 22, 245–268 (1976).
- (41) M. R. Shirts, E. Bair, G. Hooker, & V. S. Pande. Equilibrium free energies from nonequilibrium measurements using maximum likelihood methods. Phys. Rev. Lett. 91, 140601 (2003).
- (42) M. J. Comstock, T. Ha, & Y. R. Chemla. Ultrahigh-resolution optical trap with single-fluorophore sensitivity. Nat. Methods 8, 335–340 (2011).
- (43) J. Camunas-Soler, et al. Single-molecule kinetics and footprinting of DNA bis-intercalation: the paradigmatic case of Thiocoraline. Nucleic Acids Res. 43, 2767–2779 (2015).
- (44) A. Alemany, & F. Ritort. Determination of the elastic properties of short ssDNA molecules by mechanically folding and unfolding DNA hairpins. Biopolymers 101, 1193–1199 (2014).