The Sirius System and its Astrophysical Puzzles:
Hubble Space Telescope and Ground-Based Astrometry11affiliation: Based in part on observations with the NASA/ESA Hubble Space Telescope
obtained at the Space Telescope Science Institute, and from the Mikulski Archive
for Space Telescopes at STScI, which are operated by the Association of
Universities for Research in Astronomy, Inc., under NASA contract NAS5-26555
Abstract
Sirius, the seventh-nearest stellar system, is a visual binary containing the metallic-line A1 V star Sirius A, brightest star in the sky, orbited in a 50.13-year period by Sirius B, the brightest and nearest white dwarf (WD).
Using images obtained over nearly two decades with the Hubble Space Telescope (HST), along with photographic observations covering almost 20 years, and nearly 2300 historical measurements dating back to the 19th century, we determine precise orbital elements for the visual binary. Combined with the parallax and the motion of the A component, these elements yield dynamical masses of and for Sirius A and B, respectively.
Our precise HST astrometry rules out third bodies orbiting either star in the system, down to masses of 15–.
The location of Sirius B in the H-R diagram is in excellent agreement with theoretical cooling tracks for WDs of its dynamical mass, and implies a cooling age of 126 Myr. The position of Sirius B in the mass-radius plane is also consistent with WD theory, assuming a carbon-oxygen core. Including the pre-WD evolutionary timescale of the assumed progenitor, the total age of Sirius B is about Myr.
We calculated evolutionary tracks for stars with the dynamical mass of Sirius A, using two independent codes. We find it necessary to assume a slightly sub-solar metallicity, of about , to fit its location in the luminosity-radius plane. The age of Sirius A based on these models is about 237–247 Myr, with uncertainties of 15 Myr, consistent with that of the WD companion.
We discuss astrophysical puzzles presented by the Sirius system, including the probability that the two stars must have interacted in the past, even though there is no direct evidence for this, and the orbital eccentricity remains high.
1 The Sirius Binary System
Sirius ( Canis Majoris), brightest star in the sky, belongs to the seventh-nearest stellar system, at a distance of only 2.6 pc. Periodic astrometric perturbations of its proper motion—and of the other “Dog Star,” Procyon ( Canis Minoris)—were discovered by Bessel (1844), who recognized that they must be caused by dark satellites. The faint companion, Sirius B, was first seen visually in 1862 by Alvan G. Clark and his father, as reported and confirmed by Bond (1862a). Sirius B was noted moreover to lie at a position angle consistent with it being the perturbing body inferred by Bessel, but to be so faint compared to its gravitational influence that Bond (1862b) stated that it must be “only feebly self-luminous.”
The spectrum of Sirius B was photographed by Adams (1915), and found to be remarkably similar to that of the main-sequence early A-type primary Sirius A. Along with the earlier discovery of an A-type spectrum for the intrinsically faint star o2 Eridani B, this finding (as famously recounted three decades later by Russell 1944) established the existence of a new class of stars with low luminosities but relatively early spectral types. The term “white dwarf” was coined for these objects by Luyten (1922). Sirius B is the nearest and brightest white dwarf (WD), cataloged as WD 0642166. It is a hot WD with a pure-hydrogen photosphere and a spectral type of DA2. The classical spectral type of Sirius A is A1 V (Morgan et al. 1953), but high-resolution spectra reveal surface overabundances of heavy elements by factors of as much as 10 to 100 relative to solar (e.g., Cowley et al. 2016 and references therein). Thus Sirius A is generally considered to be a hot metallic-line (Am) star. Its rotational velocity is very low compared to typical A-type stars (Gray 2014 gives ), which favors the action of levitative processes in the outer layers.
It was already apparent by the mid-19th century, based on the astrometric perturbation, that the orbital period of the Sirius system is close to 50 years (e.g., Auwers 1864). Compared to the notoriously difficult Procyon B, Sirius B is somewhat easier to detect visually or photographically, except around the time of closest separation from A; however, the difference in visual brightness of about ten magnitudes leads to comparatively large uncertainties, both random and systematic, in measurements of the separation and position angle (PA). When slightly more than one revolution of the system had been observed, Aitken (1918) analyzed the available observations of Sirius B (all of them made visually with micrometers) and determined orbital elements. Later, based on measurements covering nearly two revolutions, and now including photographic observations, a new orbital solution was published by van den Bos (1960). It yielded dynamical masses for Sirius A and B of 2.15 and , respectively. Gatewood & Gatewood (1978, hereafter GG78), employing measurements of over 300 photographic plates obtained at the Yerkes and Allegheny Observatories between 1917 and 1977, refined the orbital elements, but found nearly the same masses, 2.14 and . Sirius B is thus one of the most massive known WDs, particularly among the nearby sample. Historical details of these discoveries and subsequent developments have been recounted by several authors, especially thoroughly by van de Kamp (1971), GG78, Hetherington (1980), Holberg & Wesemael (2007), Holberg (2007, 2009, 2010), Brosch (2008), and Wesemael & Racine (2008).
In contrast with ground-based observations, Sirius B is easily resolved in appropriately exposed images obtained with the Hubble Space Telescope (HST). Because the binary is so nearby, and the atmospheric parameters of both stars are well known, the Sirius system offers the possibility of fundamental constraints on stellar physics for both main-sequence stars and massive WDs. With this in mind, in 2001 our team began a program of regular HST imaging and astrometry of the binary. Our aims were to obtain dynamical masses of both stars with the highest possible precision, and an accuracy limited only by the absolute parallax of the system. Moreover, precise relative astrometry of the binary would place limits on—or could detect—the presence of third bodies in the system, down to substellar masses.
Our project began with imaging using the Wide Field Planetary Camera 2 (WFPC2) in 2001 October, and we observed the Sirius system with HST at a total of 10 epochs until 2008 January. We then continued the program with the Wide Field Camera 3 (WFC3), following its installation in place of WFPC2 during the 2009 HST Servicing Mission. We obtained WFC3 frames at five epochs between 2010 September and 2016 August. In addition, the HST archive contains WFPC2 observations at two epochs in 1997, making a grand total of 17 epochs between 1997 and 2016, a time interval covering almost 40% of the orbital period. Since the binary astrometry is no longer the dominant constraint on the dynamical mass determinations, we have now concluded the HST imaging program, and we present our final results here.
Supplementing our highly precise HST astrometry are nearly 2300 published ground-based observations of Sirius, obtained between 1862 and 2016. We made a literature search and critical analysis of these data, and include them (with appropriate vetting and statistical weights) in our determination of the orbital elements of the binary. We also present 66 previously unpublished photographic measurements made at the U.S. Naval Observatory (USNO) between 1970 and 1984. We then derive precise dynamical masses for both components of the binary, discuss the astrophysical implications, and place limits on the presence of third bodies in the system. Our study closely parallels a similar presentation of HST and ground-based astrometry of the Procyon system (Bond et al. 2015, hereafter B15).
2 HST Observations
The visual magnitude of Sirius A is (Johnson & Morgan 1953). Sirius B, at (Holberg et al. 1998), is fainter by a factor of 9,200. Astrometry of this binary, even with HST, therefore presents two observational challenges: the extreme brightness of the primary star, and the extremely large flux ratio. There is no combination of a narrow-bandpass filter and short exposure time with HST using either WFPC2 or WFC3 that would not result in saturated pixels in the image of Sirius A. We thus adopted a strategy of obtaining frames with exposure times long enough to show Sirius B with good signal-to-noise ratio (SNR), in which Sirius A was allowed to be grossly overexposed. Unsaturated features in the outer regions of its point-spread function (PSF), principally the diffraction spikes, would be used to determine its centroid location. (We successfully employed this same approach for our WFC3 imaging of Procyon, as described in detail in B15.)
For the WFPC2 camera, we considered several possible bandpasses, but selected the one at the longest available wavelength, the F1042M filter centered near m. This filter had the advantages of (1) a PSF with a well-defined “triple” structure of the diffraction spikes (due to the first Airy ring), (2) a relatively low system throughput, and (3) availability of a substantial number of archival images in this filter, including archival frames of Sirius itself. The main disadvantage of F1042M is that the flux ratio between A and B is even higher than in the visual, about a factor of 18,000, due to the hotter temperature of B.
We placed Sirius near the center of the Planetary Camera (PC) chip of WFPC2, providing pixel images with a plate scale of . We specified telescope roll angles such that Sirius B would not lie near the diffraction spikes or charge bleeding of the bright component, and obtained images at several different dither locations during each visit. We used a range of exposure times from 4 to 60 s, along with a few very short exposures (0.11 s, the shortest possible with WFPC2), which we ended up not using in our final analysis.111There are also limited archival HST observations of Sirius obtained with WF/PC-1, NICMOS, and STIS, and with other WFPC2 filters than the ones we used, but we judged these unlikely to contribute additional useful astrometric data.
For the WFC3 observations, we chose the longest-wavelength narrow-band filter available in the UVIS channel, F953N, with a similar strategy of dithered images of the binary in which Sirius A is overexposed. We used a pixel subarray (in order to reduce data volume and allow more frames to be taken during each HST visit), with a pixel scale of , and exposure times of 6 and 12 s.
An observing log for the WFPC2 and WFC3 data is presented in Table 1. The first two lines give details for archival WFPC2 visits in 1997, which had been obtained as part of an (unsuccessful) search for new faint companions of nearby stars (Schroeder et al. 2000). We included these frames in our astrometric study.
3 HST Astrometric Analysis
For the measurements of separation and PA for the Sirius system we have two sets of HST data. These are (1) WFPC2/PC frames in the F1042M filter; and (2) WFC3/UVIS frames in the F953N filter.
3.1 WFPC2 Images in F1042M
Figure 1 illustrates a typical WFPC2 frame, containing a severely overexposed image of the primary star and a well-exposed image of Sirius B lying to the lower left. Our WFC3 frames have a similar appearance.
For the astrometric measurements of these frames, we followed an essentially identical procedure to that described in B15 for our analysis of overexposed WFPC2 F1042M images of Procyon; thus we do not repeat all of the details here but only give a brief outline. In particular, in order to build over-sampled representations of the F1042M PSF for their study of Procyon, B15 included and discussed an analysis of all the available WFPC2 data on Sirius. As Figure 1 shows, the diffraction spikes exhibit quasi-periodic variations in intensity as a function of distance from the center. B15 found that this structure varies from epoch to epoch (probably because of a dependence on the exact location of A within the field of view), making it difficult to construct a usable over-sampled PSF for the unsaturated outer regions of the images. Instead, we used a procedure of fitting straight lines to the unsaturated portions of the diffraction spikes, and defining their intersection point to be the centroid of Sirius A. For the unsaturated images of Sirius B, centroids were determined from a more conventional technique of PSF fitting, again as discussed in detail in B15. In order to calibrate the systematic offset in the centers using the two different techniques, we obtained unsaturated F1042M images of the star 109 Virginis, an A0 V star with a color very similar to that of Sirius, but sufficiently faint that both unsaturated and saturated images could be compared directly. The resulting offsets were applied to the spike intersection points to place them in the same system as the direct centroids of Sirius B.
3.2 WFC3 Images in F953N
A similar approach was used for the WFC3 observations of Sirius in F953N, which is described in detail in B15 for the analysis of images of Procyon obtained in the same filter. As for the WFPC2 data, we also analyzed and discussed all of the Sirius data then available with WFC3 as direct support of the Procyon results in B15. Again, we fitted straight lines to the diffraction spikes to determine the centroid of A, and used PSF fitting to find the location of B in each image. The offset between the two methods was determined from unsaturated and saturated calibration frames we obtained for the A3 V star HD 23886. However, one difference from the WFPC2 frames is that the diffraction spikes in F953N do appear to have a consistent appearance at all epochs. Thus for the WFC3 frames we could use an alternative method of developing a deep mean PSF for the outer regions, based on a large number of frames of Sirius, Procyon, and HD 23886. This allowed us to determine the positions of Sirius A using PSF fitting instead of the diffraction-spike intersection point. The positions of Sirius B were again found from a conventional unsaturated PSF-fitting method. The systematic offset correction between the two PSF-based centroids was determined from the unsaturated and saturated calibration observations of HD 23886.
3.3 Astrometric Results from HST
The process of converting the astrometry from the image plane to the absolute J2000 frame is, again, described in B15. It is based on an adopted plate scale, and the known orientation on the sky of the image axis. Our final HST astrometric results are given in Table 2. For WFC3 we present the results from both methods—the diffraction-spike intersection and the PSF fit—as well as the weighted means of the two. Note that the PAs are referred to the equator of J2000, not to the equator of the observation epoch that is the usual practice for ground-based measurements.
4 Ground-based Measurements
As in the case of Procyon (see B15), the determination of orbital elements for Sirius is improved through inclusion of historical observations—because of their much longer time coverage than provided by the HST data, and because of measures obtained at orbital phases not observed by HST. In the first subsection below we present a set of previously unpublished historical photographic observations. In the second subsection we refer to our new critical compilation of all published ground-based astrometric measurements of Sirius.
4.1 USNO Photography, 1965–1984
A long-term program of photographic astrometry of the Sirius system was started in 1965 by I.W.L.,222Irving W. Lindenblad passed away on 2011 November 11. An obituary is available at https://aas.org/obituaries/irving-w-lindenblad-1929-2011 using the 26-inch refractor of the USNO in Washington, DC. These observations used a hexagonal aperture mask, which causes intensity to drop off rapidly in certain directions around a bright star, while producing six bright “spikes” at other PAs (e.g., Aitken 1935, p. 60; van Albada 1962). Proper mask orientation allows close companions to be detected that would not otherwise be resolved easily. Along with the hexagonal mask, an objective grating with extremely fine, evenly spaced wires was added. This produced good first- and second-order images of the primary star, which could be measured and used to locate its centroid. Figure 2 shows a digitized version of a typical photographic plate from this series of observations.
Trailed exposures were also taken on the same plates, to define the east-west direction. Details of the observations, and astrometric measurements of the separation and PA on 56 nights between 1965 and 1969, were published by Lindenblad (1970). A later paper (Lindenblad 1973) presented additional measurements between 1969 and 1972. Subsequently this observing program was continued until 1984, but unfortunately these plates had never been measured or the results published. During this interval, about 160 usable photographic observations were obtained, on 66 different nights.
Astrometry of these plates was carried out by M.S.-M. by digitizing them on the StarScan (Zacharias et al. 2008) machine at USNO. A centroiding algorithm was used for the images of Sirius A and B, with the mean position of the two first-order images of A defining its location. A plate scale of was adopted.
These measures were corrected for the “Ross effect” (see Lindenblad 1970), whereby the blackened portions of photographic emulsions dry faster than the non-blackened, causing nearby portions of the emulsion to contract differentially. The correction was determined by using measures of the second-order images. These images are far enough away from the bright primary that they are essentially undisturbed by the Ross effect. In the absence of contraction, the distance between the second-order images would be twice the distance between the first-order images, and the departure from this relation allows calculation of the correction (van Albada 1962, 1971).
Table 3 presents the results of these measurements. The PAs are for the equator of the observation epoch.
4.2 Critical Compilation of Historical Data, 1862–2016
We have collected and critically examined all published measurements of the Sirius visual binary of which we are aware (to which we add the new HST and USNO data presented in this paper). These data are discussed in Appendix A, along with excerpts from the associated full electronic versions of the tables.
5 Elements of the Relative Visual Orbit of Sirius B
5.1 Corrections to J2000
The first step in our determination of orbital elements was to adjust all of the measurements, both HST and ground-based, to a J2000 standard equator and epoch. We used the formulations given by van den Bos (1964) in order to correct for (1) precession (except for the HST measures, which are already in the J2000 frame), (2) the change in direction to north due to proper motion, (3) the changing viewing angle of the three-dimensional orbit due to proper motion, and (4) the steadily decreasing distance of the system due to radial velocity (RV).
Except for precession, these corrections are small relative to the observational uncertainties for the ground-based data, and are also small for the HST data because their epochs are all so close to 2000.0. We verified our coding by showing that it reproduces the values presented for Sirius by van den Bos (1960), if we used his input parameters. For the actual corrections, we used the parallax from §6.1 below, the Hipparcos proper motion (van Leeuwen 2007), and for the space-motion correction an initial solution for the orbital elements of the visual binary. The RV of the center of mass of the Sirius system can be determined from the observed RVs of Sirius A and the relative orbit. There have been several such determinations, beginning with Campbell (1905), who obtained . Here we use our relative orbit and all available RV data from 1903 to 1995 to determine a system velocity of . (Details of the RV determination will be presented in a separate forthcoming spectroscopic paper on Sirius B.) To obtain the true radial component of the space motion we must correct this for the gravitational redshift of Sirius A, yielding .
In Appendix A we tabulate both the input observed PAs and separations, and those corrected to J2000.
5.2 Orbital Solution
We determined elements for the visual orbit via a seven-parameter fit to the combined set of J2000-corrected HST and ground-based measurements. This fit employed a minimization procedure, as described in detail for Procyon in B15. For the HST data, we used the WFPC2 and WFC3 measures333For the WFC3 measures, we used the “F953N average” values. in Table 2, with the (small) corrections to J2000 applied.
We divided the measurements into three groups, based on the methods of observation: visual micrometer; photographic, CCD, and mid-infrared (MIR); and HST. Then we assigned different uncertainties to each of the three data sets, determined through an iterative procedure based on a comparison with the simultaneous orbit fit, as follows. (1) Few of the micrometer observations contained explicit uncertainty estimates, so we set uniform uncertainties by forcing the reduced to equal unity for this set of measurements. On the assumption that observations taken with a larger telescope are typically more precise, and that observing techniques improved over time, we then scaled the uncertainties proportionally to telescope aperture size by computing a two-variable linear fit, and again forced to unity. (2) For the photographic and ground-based CCD+MIR measurements, we applied uniform uncertainties that are isotropic in two dimensions to force the reduced to 1 for this set of measurements. (3) We did not scale the HST uncertainties, but left them at the values given in Table 2.
Following these adjustments to the measurement uncertainties of the first two groups of data, we re-computed the fit to the entire set of ground-based and HST measurements. We used a sigma-clipping algorithm to reject measurements for which the separation and/or PA was discrepant by more than four times the standard deviation of the residuals. We then re-scaled the uncertainties according to the methods described above, and repeated the sigma-clipping algorithm until no further measurements were rejected. The final parameters for the visual orbit are listed in Table 4. Uncertainties were computed from the diagonal elements of the covariance matrix. The electronic table and associated text in Appendix A indicate which observations ended up being rejected.
For the HST data we found a per degree of freedom of . We believe this excess over unity is plausibly due to minor systematic effects not included in our error determinations, such as changes in plate scale due to the occasional adjustments in telescope focus, telescope “breathing” due to thermal effects in orbit, or small errors in the telescope roll angle; or conceivably they could have an astrophysical origin (discussed below in §7).
We also experimented with a fit in which we fixed the orbital period based on the entire set of data covering over 150 years, but then determined the remaining parameters using only the high-precision HST data. However, this resulted in the parameter uncertainties actually increasing by factors of about 1.6 to 4, and a reduction in by only 0.8 mas, which is small compared to its uncertainty. Therefore we consider the values in Table 4 to be the best estimates.
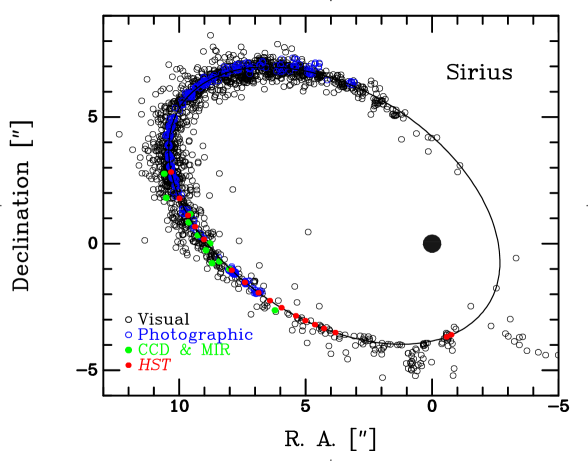
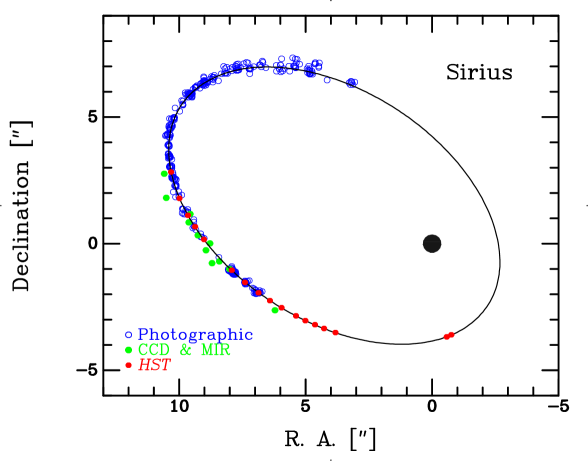
In Figure 3 (top panel) we plot all of the measurements, color-coded according to their source (visual micrometer, photography, CCD and MIR, and HST). The solid-line ellipse shows our orbital fit. For clarity, in the bottom panel of Figure 3 we omit the numerous visual measures. The top panel shows that the visual measurements frequently had very large errors, often of an arcsecond or even more. There is a tendency, especially at the smaller separations, for the separation to be systematically overestimated by the visual observers. The bottom panel shows that even the CCD and MIR measures had a bias toward overestimation of the separation. (Note that the semimajor axis had also been systematically overestimated for Procyon in the historical data, as shown by Girard et al. 2000 and B15.)
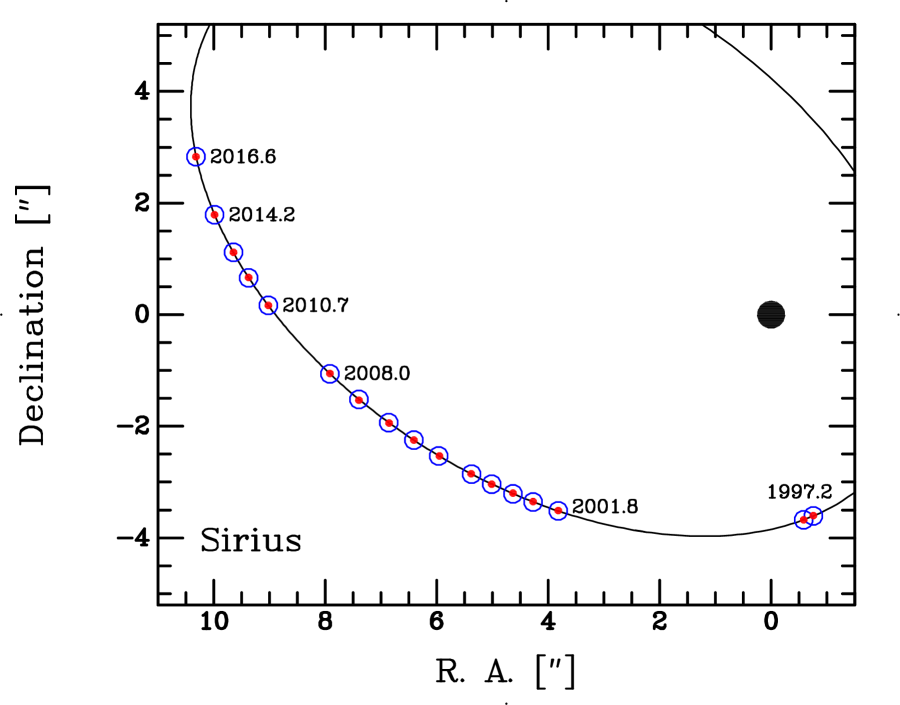
The observational errors for the HST data are too small to be visible in Figure 3, so in Figure 4 we zoom in on a plot of the HST measures only (red dots), along with the calculated positions (open blue circles) based on our orbital solution. But once again the deviations from the orbital fit to the exquisite HST astrometry are too small to be seen.
5.3 Residuals from Orbital Fit
In Figure 5 we plot the residuals of our HST measurements as a function of time relative to the orbital fit, in the directions of right ascension (top panel) and declination (bottom panel). In right ascension the fit agrees with all of the measures within 1 error bars, except for a 2.5 residual for a single observation. There appears to be no jump resulting from the change of cameras in 2009. There is a slightly larger scatter in the declination residuals, with two noticeable departures at the beginning and end of 2006 of about 2 and 3.7. Because the PAs on those dates were around , a residual in declination of these sizes could in principle be due to an incorrect telescope roll angle, at a level of about . Normally the HST roll angle is known to about , but in very exceptional cases444See http://www.stsci.edu/hst/observatory/faqs/orient.faq the uncertainty can approach .
6 Determining the Dynamical Masses
6.1 Parallax and Semimajor Axis of Sirius A
In addition to the period, , and the semimajor axis, , of the relative orbit listed in Table 4, we need two further quantities in order to determine dynamical masses for both stars: the absolute parallax of the system, , and the semimajor axis, , of the absolute orbital motion of Sirius A on the sky.
For the parallax, we used two independent determinations: (1) GG78 calculated the parallax from measurements of over 300 photographic plates obtained at the Yerkes and Allegheny Observatories between 1917 and 1977, combined this result with four earlier published determinations, and corrected the result from relative to absolute to yield a parallax of ; (2) the absolute parallax was measured by the Hipparcos mission to be (van Leeuwen 2007). These results are in good agreement, and we adopt their weighted mean, as given in the top part of Table 5.
GG78 also determined the semimajor axis of Sirius A’s orbital motion from the Yerkes and Allegheny material, and their result is presented in the bottom section of our Table 5. However, the calculation needs to be repeated using our new determination of the elements of the relative orbit. Fortunately GG78 tabulated the individual measurements of the photocenter location (their Table 6), allowing us to repeat the determination of ; we found that one observation, at 1966.824, was very discrepant, possibly due to typographical error, and it was deleted. Our new adopted value of is given in the final entry in Table 5.
6.2 Dynamical Masses
The final column in Table 6 lists the dynamical masses that result from our adopted parameters. For comparison, the second column gives the masses derived by van den Bos (1960), and the third column lists the values from GG78. We used the usual formulae for the total system mass, , and for the individual masses, and ; in these equations the masses are in , and in arcseconds, and in years. Our total system mass, , is about 3.6% lower than was derived by GG78, and our individual masses, and , are smaller by similar factors555If we derive orbital elements using only the HST astrometry, without the historical data, we find essentially the same masses but with uncertainties 2.7 times larger: and .. These differences are due almost entirely to a 2.5% reduction in our adopted , and a 1.0% reduction in . Compared to the earlier study by van den Bos, our total system mass is lower by 3.4%, even though his value of is very close to our measurement. In this case, the difference is due mostly to our 3.1% reduction in relative to the value used by van den Bos.
In Table 7 we present the error budgets for our derived masses of Sirius A and B, based on the random uncertainties of each of the parameters.666A potential source of systematic uncertainty is errors in the plate scales of the HST cameras. As we discussed in B15, Gonzaga & Biretta (2010) state a fractional uncertainty of 0.0003 for the WFPC2 plate scale, and for the WFC3 plate scale we derived a similar fractional uncertainty of 0.00018. These imply a systematic uncertainty of about for the semimajor axis, . Table 7 shows that a systematic error of this magnitude contributes negligibly to the random errors in the dynamical masses. As the table shows, the mass errors are entirely dominated by the uncertainty in the parallax. Unfortunately, this error is unlikely to be reduced in the near future, because Sirius is far too bright for its parallax to be measured by the current Gaia mission (D. Pourbaix and S. Jordan, private communications).
7 Astrometric Limits on Third Bodies
The possibility that a third body exists in the Sirius system has been raised many times. Early suggestions are reviewed by van de Kamp (1971), Greenstein et al. (1971), Lindenblad (1973), and Brosch (2008), among others; they were based on claims of direct visual detections of a companion object, or astrometric perturbations of the binary orbit. Benest & Duvent (1995) cited several studies, including their own, that indicated a possible astrometric perturbation of the visual orbit with a period of about 6 years. The (semi-)amplitude of the claimed departure from two-body motion was found to be about . All modern direct searches for a resolved companion using high-contrast imaging have failed to reveal one down to limits corresponding to masses of several times that of Jupiter (e.g., Schroeder et al. 2000; Bonnet-Bidaud et al. 2000; Thalmann et al. 2011; Vigan et al. 2015; Bowler 2016; and references therein). We likewise saw no evidence for a third object in any of our HST frames, although they were not optimized for such a search.
The six-year orbital perturbation reported by Benest & Duvent (1995), which would produce offsets of over 100 mas peak-to-peak, is of an amount readily detectable in our HST astrometry. However, our plots of the residuals in Figure 5 show that the claim is categorically ruled out. As discussed above (§5.3), we see no evidence for perturbations in right ascension in excess of the measurement uncertainties. The declination residuals (Figure 5 bottom panel) tend to be slightly larger, and there was one noticeably large (3.7) offset during late 2006, although not accompanied by a large residual in right ascension. We calculated periodograms for the residual data, but found no significant evidence for periodicities. In summary, although there was one possible statistical fluke in late 2006, in declination only, we see no convincing evidence for periodic perturbations with semi-amplitudes of more than 5 mas.
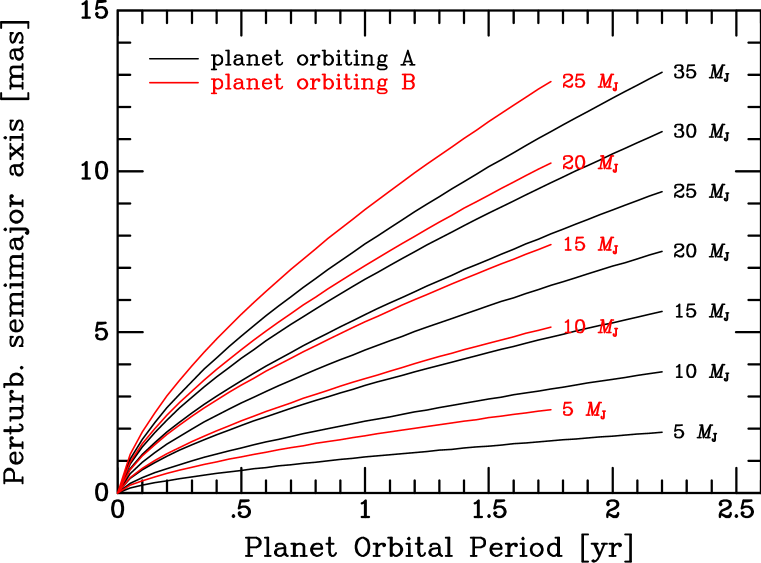
The long-term orbital stability of planets around individual stars in a binary system has been studied numerically by, among others, Holman & Wiegert (1999). Using the results in their Table 3, and the parameters of the present-day binary, we find that the longest periods for stable planetary orbits in the Sirius system are about 2.24 yr for a planet orbiting Sirius A, and 1.79 yr for one orbiting Sirius B.
We calculated the semimajor axes of the astrometric perturbations of both stars that would result from being orbited by substellar companions of masses ranging from 5 to (where is the mass of Jupiter, ), and for orbital periods up to the stability limits given above. The results are plotted in Figure 6. For a semi-amplitude limit of 5 mas, Figure 6 indicates that a companion of Sirius A of or less could escape astrometric detection. At , only an orbital period longer than 1 yr would have led to detection in our data. Progressively more massive objects orbiting Sirius A would have been detected more easily, except at the shortest orbital periods.
Our limits are more useful for Sirius B, for which a precision RV study would be impractical. A companion with a period longer than 0.6 yr is excluded, but a satellite could in principle be present at any period up to the stability limit.
In summary, our findings are consistent with the tighter limits set by the direct-imaging studies cited above.
8 Astrophysics of the White Dwarf Sirius B
We now turn to brief discussions of the astrophysical implications of our precise dynamical masses for both stellar components of the Sirius system. We begin in this section with the WD Sirius B, and then consider the primary star, Sirius A, in §9.
As discussed in §1, Sirius B is the nearest and brightest WD. It is a nearly ideal target for astrophysical investigations—apart from its proximity to the overwhelmingly bright primary, Sirius A, making ground-based study of the WD difficult. However, a wide range of high-quality space-based data has been accumulated. These were summarized by Barstow et al. (2005), whose work has been updated, using new observations, in a recent conference presentation (Barstow et al. 2017). These studies are based in part on spectroscopic observations of Sirius B obtained with the Space Telescope Imaging Spectrograph (STIS) on HST. Unlike ground-based data, the STIS spectra have very minor amounts of contamination by light from Sirius A, easily subtracted to reveal a high-SNR spectrum of Sirius B. The spectra show only the Balmer lines, confirming that the star is a DA2 WD with a pure hydrogen atmosphere.
Full details will be presented in a forthcoming journal paper, but our model-atmosphere fitting to the STIS spectra yields an effective temperature and surface gravity of K and (cgs units). Based on the absolute flux, the implied radius of Sirius B is and its luminosity is . (The quoted uncertainties are internal errors of the model fits and do not include the modestly larger systematic uncertainties.)
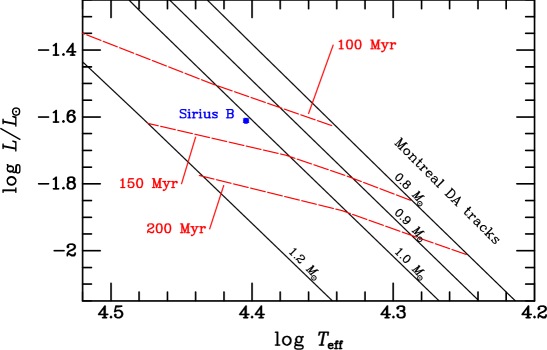
In the two panels of Figure 7, we compare our measured parameters for Sirius B with theoretical predictions. We use theoretical modeling data from the “Montreal” photometric tables777http://www.astro.umontreal.ca/∼bergeron/CoolingModels. These tables are based on evolutionary sequences and model atmospheres calculated by Holberg & Bergeron (2006), Kowalski & Saumon (2006), Tremblay et al. (2011), and Bergeron et al. (2011). for WDs with carbon-oxygen cores, pure-hydrogen atmospheres, and a “thick” hydrogen layer with a mass of . The top panel in Figure 7 shows the location of Sirius B in the theoretical Hertzsprung-Russell diagram (HRD; luminosity vs. effective temperature); the formal errors are smaller than the plotting symbol. Also shown are the model cooling tracks for DA WDs with masses of 0.8, 0.9, 1.0, and . If we were to infer the star’s mass from its HRD location—which was determined without reference to the mass—it would be . This is in superb agreement with our measured dynamical mass of . The top panel of Figure 7 also shows isochrones for ages of 100, 150, and 200 Myr, again based on the Montreal tables. By interpolation in the theoretical data, we estimate the cooling age of Sirius B to be 126 Myr. This agrees very well with an earlier determination of 124 Myr in a study of the Sirius system by Liebert et al. (2005, hereafter L05).
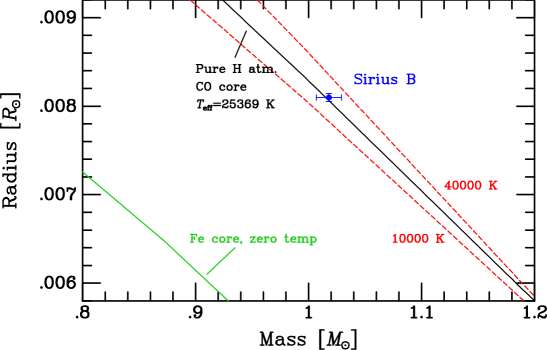
In the bottom panel of Figure 7, we plot the position of Sirius B in the mass-radius plane, using our measured dynamical mass and the radius described above. It is compared with a theoretical mass-radius relation for H-atmosphere CO-core WDs with K, obtained through interpolation in the Montreal tables. The observed mass and radius are in excellent agreement with the theoretical relation. We show the dependence of the theoretical relations on effective temperature by also plotting the curves for and 40,000 K; they clearly disagree with the observed values. To illustrate the dependence on mean molecular weight, we additionally plot the Hamada & Salpeter (1961) mass-radius relation for zero-temperature WDs composed of 56Fe; it is extremely discrepant with the observations.
The surface gravity of Sirius B, calculated from our radius and dynamical mass, is . This is only modestly discrepant (about 2.4) with the value of derived from the model-atmosphere analysis of Barstow et al. (2017). The predicted gravitational redshift (GR) is . This agrees very well with a measured GR of reported in our earlier investigation (Barstow et al. 2005). Unfortunately, in our more recent study of our new set of STIS spectrograms we measure . We are still investigating this discrepancy and will discuss it in a separate forthcoming paper.
Based on an assumed initial-to-final-mass relation (IFMR), we can estimate the initial mass of the Sirius B progenitor, neglecting any interactions with Sirius A during its evolution. Adding the pre-WD evolutionary time of the progenitor to the cooling time then yields the star’s total age. We consider a recent study by Cummings et al. (2016, hereafter C16), which presents two versions of the IFMR. In the left panel of C16’s Figure 8, they show an IFMR based on cluster ages calibrated using the Yonsei-Yale (Y2) isochrones database (Yi et al. 2001; Demarque et al. 2004), which only contains tracks up to . In the right panel of the same figure, C16 show the IFMR based instead on “PARSEC” (Bressan et al. 2012) isochrone data, which extend to higher progenitor masses. The PARSEC calibration, although close to that of Y2 in the lower-mass region, changes slope for progenitor masses larger than . The uncertain location and shape of this break in slope results in a progenitor-mass uncertainty for WDs in the vicinity of Sirius B, and thus an additional uncertainty in calculating the progenitor lifetime.
Assuming a slightly sub-solar metallicity for the progenitor of Sirius B (see next section), we performed two sets of evolutionary calculations, using the Tycho and YREC codes (also described in the next section). When the PARSEC IFMR is chosen, the estimated mass of the progenitor is .888We corrected C16’s PARSEC-based IFMR formula for a typographical error in the slope coefficient, from 0.097 to 0.0907 (J. Cummings, private communication). Using the Tycho evolution code, the lifetimes from the zero-age main sequence (ZAMS) to the asymptotic giant branch (AGB), are 132, 100, and 79 Myr, for progenitors of 5.0, 5.6 and , respectively. These imply a total age of Sirius B of Myr.
The Y2-based IFMR calibration yields lower progenitor masses for Sirius B, and less observational scatter, in the range . In order to reduce the systematic uncertainty inherent in combining data derived with different evolution codes, we used an updated version of YREC to calculate the progenitor lifetimes. The derived lifetimes from the ZAMS were 112, 102, and 94 Myr, for 4.8, 5.0, and , respectively999The YREC and Tycho codes produce different evolutionary timescales at masses around , as discussed in more detail below in §10.3.. When added to the cooling timescale estimate of 126 Myr, these lifetimes yield a total age for Sirius B in the range Myr.
9 Astrophysics of Sirius A
Our precise dynamical mass for Sirius A (), and an age estimate for the binary system (226–228 Myr, with an uncertainty of about 10 Myr) based on properties of the WD and an assumed IFMR, present an opportunity to test theoretical models of the primary star’s evolution. Additional constraints are provided by determinations of the radius, luminosity, and effective temperature of Sirius A; for these we adopt the parameters given by Davis et al. (2011, hereafter D11), as modified slightly by our adopted parallax of instead of the used by D11. These adjusted values are , , and K. The radius of Sirius A is tightly constrained, as it is derived from precise interferometric measurements (e.g., Kervella et al. 2003; D11; Boyajian et al. 2013 and references therein). A caveat, however, is that these recent compilations (see also David & Hillenbrand 2015 and Bohlin et al. 2017) have given values of and that range over several percent relative to our adopted values. In order to test the agreement of models with the observationally determined parameters for Sirius A, we will compare with two sets of theoretical evolutionary tracks calculated using the Yale Rotating Stellar Evolution Code (YREC) and the Tycho101010In spite of the YREC acronym, all of the models in the work discussed here are non-rotating. “Tycho” is a name, in honor of Tycho Brahe, not an acronym. code.
YREC is a modern one-dimensional (1D) stellar-evolution code, designed to study the hydrostatic phases of stellar evolution (Demarque et al. 2008). Convection is included, using a solar calibration of mixing-length theory (MLT). The code has been continually updated; recent applications of YREC are given in Spada et al. (2013) and Guenther et al. (2014).
Tycho is also a 1D stellar evolution code, but it incorporates a description of turbulent convection based on three-dimensional simulations of a convective zone sandwiched between stable layers (Arnett et al. 2015; Cristini et al. 2016). These were analyzed using a Reynolds decomposition (Viallet et al. 2013), which allows a quantitative and local determination of resolution errors. The errors were small for the highest resolutions (). The description of convection has no adjustable free parameters. The simulations exhibit narrow boundary layers and time-dependent turbulent entrainment, features not found in MLT.
Differences in the location of Sirius A in the HRD between models produced by YREC and Tycho should be minimal. The effects of convection on the envelope structure of an A-type star, which is primarily radiative, are small. Both YREC and Tycho predict the presence of a convective core. The most significant differences in the internal structure are the mass of the mixed core, and the existence of a transition layer separating the convective core from the radiative envelope, resulting in turbulent entrainment beyond the convective boundary predicted by MLT.
However, the codes also differ in the choice of the solar chemical composition, which, through the requirement of consistency with the present-day Sun, affects the opacities and equation of state. The YREC models use the solar mixture of Grevesse & Sauval (1998, hereafter GS98), chosen for its compatibility with helioseismology (Basu & Antia 2008). The addition of a boundary layer in the Tycho models gives additional mixing, so that the solar model must compensate by having lower opacity (lower metallicity). The Tycho models use the Lodders (2010, hereafter L10) abundance tables, which have a lower metallicity than GS98. The fractional abundances by mass of elements heavier than helium are and 0.0141 in the GS98 and L10 mixtures, respectively. Solar models with self-consistent boundary layers are not yet available, but asteroseismological data show encouraging agreement for the boundary layer in more massive stars (e.g., ; Arnett & Moravveji 2017).
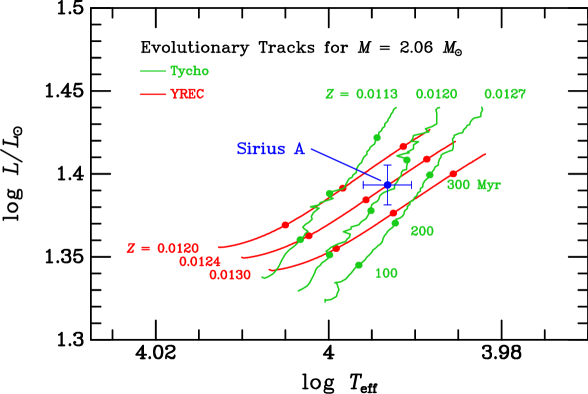
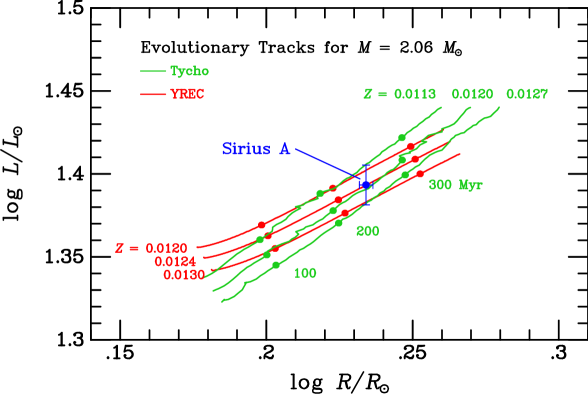
Using the YREC code, we ran a series of models of Sirius A with the mass fixed at the measured and a range of metallicities. (Here, and in the discussion below, we consider the bulk composition of the star, and neglect any effect of the superficial metallic-line photospheric composition.) We were unable to fit the location of Sirius A in either the HRD or in a plot of vs. , under the assumption of solar metallicity, because Sirius A is too luminous. Instead, we were forced to use a modestly metal-poor composition; these tracks have higher luminosities due to the reduced opacity of metal-deficient stellar material. The three YREC tracks plotted using red lines in the two panels of Figure 8 have metal contents bracketing the value giving the best agreement, which has (corresponding to a logarithmic metal deficiency of relative to the GS98 solar value). Ages111111As in §8, “age” is calculated relative to the arrival of the model on the ZAMS, and does not include the time spent in pre-main-sequence evolution. are marked with large dots along the tracks in steps of 100 Myr. The inferred age of Sirius A, based on the vs. diagram, is constrained to Myr. This is compatible, within the uncertainties, with the total age of the WD Sirius B that we obtained in §8.
We also made Tycho runs for three models with a range of metal contents. Again, we find that the metallicity has to be slightly sub-solar in order to reproduce the positions of Sirius A in the HRD and vs. diagrams. The green lines in the two panels of Figure 8 show the Tycho tracks with , 0.0120, and 0.0127, with the middle one giving the best fit (corresponding to on the L10 scale). Note that the Tycho models solve for the compositional mixing separately from the structure (“operator splitting”), which at present causes the small “wiggles” seen in the plotted tracks. This allows efficient use of very large nuclear-reaction networks.
The differences in slopes between the YREC and Tycho tracks seen in Figure 8 arise from the behavior of the convective core. The 321D algorithm implemented in Tycho, which is based upon 3D simulations of turbulent convection and has no parameters which must be fitted, predicts mixing beyond the convective boundaries prescribed by MLT. The core thus remains larger and grows more rapidly in the Tycho models, resulting in a more rapid increase in luminosity with age. Ages are marked on the Tycho tracks, again in steps of 100 Myr. The inferred age of Sirius A is Myr.
Thus both the YREC and Tycho models imply that the bulk composition of Sirius A is slightly deficient in heavy elements with respect to the primordial composition of the Sun, with effective values of [Fe/H] of about to . The absolute metallicity values agree extremely well between the two codes, being and 0.0120, respectively. Because the photospheric composition has been modified by diffusive and levitative processes, it does not provide an observational test of the bulk abundances. As we noted earlier, many heavy elements actually appear to be overabundant at the surface relative to the Sun; for example Lemke (1989) found that iron itself has a photospheric abundance of . Both sets of tracks imply an age of Sirius A of about 237 to 247 Myr, with an uncertainty of approximately 15 Myr. These results are in good agreement with the age of the binary inferred completely independently in our discussion of the WD Sirius B in §8.
10 Astrophysical Puzzles of the Sirius Binary System
Sirius, the brightest star in the sky, and one of the nearest—far from being well-understood—presents several astrophysical problems. These questions have been discussed by L05, Brosch (2008), Bonačić Marinović et al. (2008, hereafter BM08), Landstreet (2011, hereafter L11), Perets & Kratter (2012, hereafter PK12), and many others. In this section we review a few of these issues in the light of our new findings.
10.1 Have the Stars Interacted?
In §§8–9, we discussed the two components of Sirius as if they have evolved independently. But—even though we find consistent ages for Sirius A and B under this assumption—independent single-star evolution may not have been the case. In the present-day orbit, the separation of Sirius A and B ranges from 31.5 AU at maximum to 8.1 AU at periastron. If the progenitor of B had a mass of 5.0–, as discussed in §8, then the total mass of the system was reduced from an original 7.1– to its present , due to mass lost from the progenitor of B. Under the assumption that this mass loss was isotropic and on a timescale long compared to the orbital period (cf. Burleigh et al. 2002, §2), and ignoring any interactions between the stars, this implies that the periastron separation was only 1.5–1.6 AU in the progenitor binary. This is smaller than the radius attained in the AGB phase of a 5.0– star, and thus the two must almost certainly have interacted in the past. Yet the binary did not enter into a common-envelope event, and the orbit did not even tidally circularize as might have been expected—it still has an eccentricity of 0.59. Moreover, as discussed in §§8–9, Sirius B appears to be a normal WD, and Sirius A shows no apparent departure from single-star evolution nor any obvious signs of a past interaction.
Several authors, including BM08, have pointed out that Sirius is by no means unique: there are many detached binary systems in which one component is a WD that clearly interacted with the primary star in the past, yet they still have eccentric orbits. For instance, barium stars, in which processed material from an AGB star (now faded to a WD) is present on the surface of a companion, are often in eccentric orbits (Izzard et al. 2010, and references therein). Another example of a wide evolved binary that avoided circularization is the Procyon system, consisting of an F5 subgiant and a DQZ WD companion in a 40.8-yr orbit, with an eccentricity of 0.40 (see B15). BM08 (see also references therein for earlier theoretical considerations) have modeled binary systems in which the orbit is initially significantly eccentric before the more-massive component reaches the AGB. Mass loss from the AGB star is enhanced at each periastron passage, producing a growth rate in eccentricity larger than the rate of tidal circularization. In §4.1 of BM08 they explore parameter space to see whether the Sirius system itself can be reproduced through this eccentricity-pumping mechanism, and they are able to do so. The amount of material accreted by Sirius A from the progenitor of B in the successful scenarios is about 0.05–. In a later paper, L11 raised the possibility that as much as was accreted by Sirius A. However, a possible objection to significant mass transfer from the companion is that the rotational velocity of Sirius A is small compared to most A-type stars (§1), indicating that it avoided being spun up by accretion to a short rotation period.
Since the photospheric composition of A appears to have been modified by diffusive processes, it is difficult to apply strong constraints on accretion scenarios based on chemical abundances at its surface. However, L11, and earlier Richer et al. (2000), suggested that the abundance patterns, in particular deficiencies of C and O, and near-solar N, are at least qualitatively consistent with accretion of CNO-processed material having occurred at the time Sirius B was an AGB star. The enrichments of the heavy elements Sr, Y, Zr, and Ba found by L11 (3 to 30 times solar), and of Cu and heavier elements found by Cowley et al. (2016; generally 10 to 100 times solar), may also be indicative of accretion of -process elements. In addition, any mass accretion might have resulted in helium enrichment of the atmosphere, which would increase element abundance ratios relative to hydrogen.
We made an exploratory theoretical study, in which an additional Tycho model was run to assess whether a past accretion event could have produced a detectable effect on the evolution of Sirius A. A star initially of mass , with a metallicity of , was evolved for 100 Myr, the approximate time for a companion star to evolve to the thermally pulsing AGB phase. At that point, steady accretion at a rate of was implemented for a duration of 1 Myr, yielding a final mass for the star of . After the accretion was terminated, the model readjusted on a thermal timescale, and then converged onto an evolutionary track with a normal shape and rate of evolution. This track had a slightly lower and larger radius at a given luminosity than a non-accreting model starting at a mass of . This particular scenario results in a poorer fit to the observed stellar parameters of Sirius A than the single-star models discussed in §9; however, the unexceptional shape and evolutionary timescale of the post-interaction track makes it difficult to rule out a similar accretion history for Sirius A.
PK12 considered an alternative scenario, in which eccentric binaries with compact components like Sirius are descended from systems that were initially triple. The onset of mass loss as the most massive component evolves could trigger an orbital instability, leading to ejections, interactions, or even physical collisions. In §7 of PK12, they consider the specific case of Sirius. PK12 ran theoretical simulations of triple systems, with a third star orbiting an inner binary having initially a small orbital eccentricity. They were able to reproduce the current Sirius system in cases where the third star was eventually ejected, and the inner binary pumped to high eccentricity. This scenario is, in principle, testable, since it predicts existence of an ejected third star as a very wide common-proper-motion companion.
10.2 Does Sirius Belong to the Ursa Major Moving Group?
Over a century ago, Hertzsprung (1909) pointed out that Sirius appears to share the space motions of the bright A-type “Dipper” stars in Ursa Major. A substantial literature has developed since then in which many authors have assigned Sirius to membership in this Ursa Major Group (UMaG). A detailed investigation of the UMaG, and a summary of earlier work, is given in a classical paper by Roman (1949). Eggen (1960) stated that Sirius is known to be a member of the UMaG, indeed calling it the “Sirius Group,” or later (Eggen 1992) the “Sirius Supercluster.” Soderblom & Mayor (1993) reviewed the literature on moving groups up to 1993, and considered Sirius a “probable” member of the UMaG.
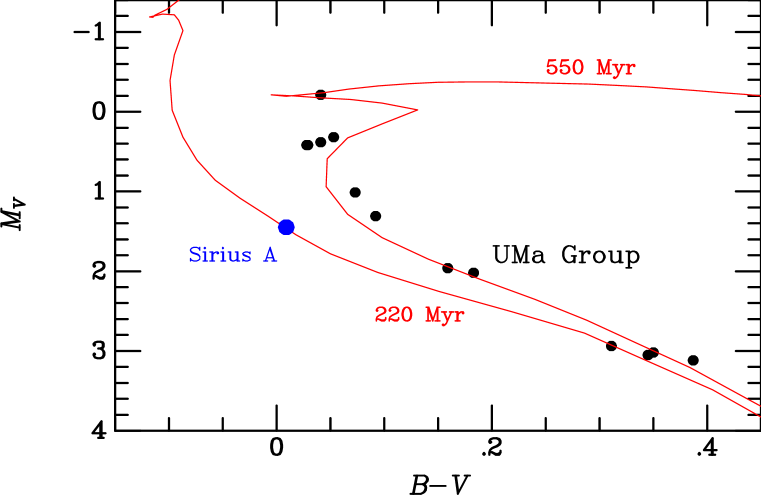
However, King et al. (2003, hereafter K03) made an updated examination of stellar memberships in the UMaG, based on a large collection of new data, including precise new parallaxes from the Hipparcos mission. This led to a “clean” sample of definite UMaG members, and demotion of Sirius to an “uncertain” membership category. In Figure 9 we plot the observational HRD ( vs. ) for the “certain” UMaG members, using the data in K03 (their Table 5) for stars with a membership class of “Y” (i.e., “yes,” indicating definite membership). Also plotted are the data for Sirius A, from the same table. K03 derived an age of the UMaG of Myr based on Y2 isochrones. We essentially verified this result by using the Y2 isochrones database, together with the accompanying interpolation tool121212Both available for download from the Y2 web page: http://www.astro.yale.edu/demarque/yyiso.htm (Demarque et al. 2004), to find a solar-composition isochrone that provides a reasonable fit to the UMaG data; this is the 550 Myr isochrone plotted in Figure 9. The figure shows that Sirius A lies well to the left and below the main-sequence turnoff of the UMaG, in accordance with the younger age implied by our discussion in §§8–9. We calculated another Y2 isochrone, for an age of 220 Myr and metallicity , consistent with our findings in §9. This isochrone passes directly through the Sirius point, as shown in Figure 9. We conclude that either Sirius is too young to be a member of the UMaG, or that if it is a member, it is conceivably a blue straggler or other exotic object.
K03 quote a metallicity of for the UMaG, and in a more recent paper Ammler-von Eiff & Guenther (2009) state that UMaG members have [Fe/H] lying in the range to +0.06. The slightly sub-solar bulk metallicity of Sirius A that we deduced in §9 is reasonably consistent with these values, so it is difficult to exclude Sirius from the moving group solely on the basis of its composition.
10.3 Sirius B and the Initial-Final Mass Relation
In §8 we adopted two versions of the IFMR from a recent paper by C16, in order to obtain the initial mass of the progenitor of Sirius B, from which we determined its evolutionary timescale. Here we consider the reverse approach, in which we constrain the total age of Sirius B to be equal to that found in §9 for the age of Sirius A. Then we take the difference between that age and the cooling age of the WD to be equal to the pre-WD evolutionary timescale for the progenitor. Using our evolutionary codes, we finally infer the progenitor’s mass that yields this timescale.
The ages of Sirius A from the YREC and Tycho codes are 237 and 247 Myr, respectively (§9). Taking the YREC age, and subtracting the 126 Myr cooling age of Sirius B (§8), we find a pre-WD evolutionary timescale for the progenitor of about 111 Myr. The YREC code gives this timescale for a progenitor mass of .
We also ran Sirius B progenitor models using the Tycho code for masses of 4.85, 5, 5.1, 5.6, and , at a metallicity of . These simulations were terminated during the thermally pulsing AGB (TP-AGB), at which point computational times become long. A conservative estimate is that continuation of the evolution all the way through removal of the H envelope would increase the measured ages by only 2%. Including a 2% adjustment for the end of the TP-AGB, the lifetimes of these models, starting from the ZAMS, are 145, 132, 112, 100, and 81 Myr, respectively. The age of Sirius A, based on the Tycho code, is 247 Myr. Subtracting the 126 Myr WD cooling age yields a progenitor pre-WD timescale of 121 Myr, corresponding to a progenitor mass of .
There is a significant discrepancy in stellar lifetimes in this mass range between Tycho and YREC. It arises from the treatment of convection. The additional turbulent entrainment beyond the thermodynamic boundary of the convective core that is a feature of the 321D algorithm in Tycho is predicted to increase with stellar mass, resulting in longer main-sequence lifetimes and larger He cores. The final mass of the WD in Tycho is also larger than in YREC for a given progenitor mass, due to the larger He core and the larger extent of convection during He burning. Thus the relatively small differences in the Sirius A models become much more marked in a model.
We note that the exact final WD mass predicted by the Tycho code depends on details of the TP-AGB evolution, but the models allow us to constrain the progenitor mass needed to yield a WD at this metallicity to about , in agreement with the lifetime argument above.
Our result (– and ) lies well within the observational scatter for WDs in open clusters shown in the IFMR of Figure 8 in C16. Our results are also consistent with the earlier study of L05, who inferred a Sirius A age of 225–250 Myr, and an initial mass for Sirius B of . Thus, again, we see no direct evidence for a departure from normal single-star evolution.
11 Summary
Based on our analysis of nearly two decades of precise astrometry of the Sirius system with the Hubble Space Telescope, ground-based photographic observations presented here for the first time, and historical measurements dating back to the 19th century, we have derived dynamical masses for both components. The metallic-line A star Sirius A is found to have a mass of , and the Sirius B WD companion has a mass of . In spite of past claims, we find no evidence for perturbations due to third bodies in the system, at levels down to masses of about 15–.
The position of Sirius B in the H-R diagram is in excellent agreement with a theoretical cooling track for a WD of its measured mass, and implies a cooling age of 126 Myr. In the mass-radius plane, Sirius B’s location is likewise in agreement with theoretical predictions for a carbon-oxygen white dwarf of its effective temperature, with a hydrogen-dominated atmosphere.
We calculated evolutionary tracks for stars with the mass of Sirius A, using two modern codes. In order to fit the observed parameters (radius, luminosity, and effective temperature) we find it necessary to adopt a slightly subsolar bulk metallicity, of about . The two codes yield ages for Sirius A in the range of about 237–247 Myr. This age range is consistent with the age of Sirius B, if we add a plausible pre-WD evolutionary timescale to its cooling age.
In spite of the apparent consistencies with the assumption that the two stars have evolved independently, we point out that the binary might have been closer in the past, before the progenitor of Sirius B underwent significant mass loss. Thus it is difficult to understand how they could have avoided an interaction and mass accretion onto Sirius A. There are indeed tantalizing hints in the photospheric composition of Sirius A for contamination from an AGB wind or Roche-lobe overflow, but the evidence is obscured by apparent levitative processes in the stellar atmosphere. The slow rotational velocity of Sirius A and the high eccentricity of the present-day orbit are also problematic for a scenario involving a past interaction.
We considered the long-standing claim that Sirius belongs to the Ursa Major moving group, with which it appears to share a common space motion. However, Sirius A has the appearance of being significantly younger than the group members, perhaps indicating that it simply is not a physical member. Alternatively, the seemingly well-behaved Sirius system may be concealing an exotic past evolutionary history involving interactions and mass transfer between the two stars, or even one necessitating a third star that was dynamically ejected from the system while exciting the remaining binary to a higher orbital eccentricity. The brightest star in the sky continues to stand as a beacon challenging our understanding of stellar evolution.
Appendix A Critical Compilation of Historical Observations of the Sirius Binary System
By Gail H. Schaefer, Jay B. Holberg, and Brian D. Mason
We have assembled what we believe to be a complete compilation of all published historical measurements of the position angle (PA) and angular separation of Sirius B relative to the primary star. Our tabulation is based on a critical review of measures contained in the Washington Double Star Catalog (WDS)131313http://ad.usno.navy.mil/wds. Sirius is designated WDS J064511643 in the WDS catalog. maintained at the USNO, and from our additional literature searches.
The complete tabulation is presented in the electronic version of this paper, and will also be available at the VizieR website.141414http://vizier.u-strasbg.fr/viz-bin/VizieR Notes at the end of the tabulation give extensive commentary on the historical observations. Table 8 in the present paper shows an excerpt from the full table, with some of the columns omitted for clarity. The table presents the date of observation (Besselian year), measured PA and separation, PA and separation corrected to J2000 (as described in §5.1) and their adopted uncertainties, an observer code, a code for method of observation, telescope aperture, and a code for notes and remarks. A second tabulation contains the bibliographic codes (BibCodes) and full literature references corresponding to the observer codes; an excerpt from this tabulation is given in Table 9.
The visual micrometer observations did not always include a contemporaneous measurement of both PA and separation. In Table 8, these omissions are listed with a value of and the associated errors are set to zero. The adopted uncertainties were determined as described in §5.2, but are listed with a value of 0.0 for measurements that were rejected from the orbit fit.
Many early publications provided measures averaged over multiple nights or even an entire observing season, for the purpose of reducing computational labor in subsequent analyses. With modern computers there is no need for such averaging, so we opted to present the individual measures whenever available. However, if an observer reported more than one measurement on a given night, we did compute the mean position for that night. If the original publication only reported a mean across several nights, we tabulate that mean as reported.
Some early results were reported in more than one publication. We identified these by listing additional reference codes in the online version of the table. There were several cases where the results were slightly different from one publication to another; we identify these instances in the notes column, and provide an explanation for selecting the values listed in the table. Here we discuss one specific case in more detail: Struve (1893) attempted to correct his measurements for systematic errors by measuring artificial double stars, and he published both the original and corrected measures for the companion of Sirius. Aitken (1935, p. 61) cautions that the variances of the PAs and separations compared with those of other observers are often larger for Struve’s corrected values than for the originals. However, in the case of Struve’s measurements of Sirius, we in fact found that the mean residuals in the PAs did improve when we used Struve’s corrected values, while the separation residuals did not change significantly; we therefore chose to use Struve’s corrected values.
Another set of measurements that we discuss in more detail are the USNO photographic observations by Lindenblad (1970, 1973). He published data for the raw individual measures, but only corrected the seasonal means for emulsion contraction (see §4.1). The average time span covered by his mean measures is 70 nights. We chose to apply Lindenblad’s tabulated scale factors in order to compute corrected separations and PAs for the individual measurements. We then averaged the measures for plates taken on the same night, reducing the number of individual measurements from 157 down to 77 observations on unique dates.
The electronic table contains a total of 2354 measurements. Of these, two observations by G. M. Searle at 1866.93 and 1867.03 (1882, Harvard Annals, 13, p. 36) were rejected because his notes indicate that they do not refer to Sirius B. Additionally, the two HST measurements by Schroeder et al. (2000) were replaced by our reanalysis of the same images, as described in §3. The table also includes eight attempted observations wherein the binary was unresolved, or where no formal measurement of the binary position was reported, including the initial discovery by the Clarks.
A total of 2350 measurements remains for inclusion in our initial orbital fit, contributed by 135 distinct observers. There are 1915 visual micrometer observations, 407 photographic observations, and only 28 using “modern” techniques. Remarkably, aside from the HST observations reported here, astrometry of Sirius B has been almost entirely neglected by professional astronomers for more than the past three decades, subsequent to a final 1986 photographic observation reported by Jasinta & Hidayat (1999). The only exception of which we are aware is a single measurement in 2005 derived from MIR observations with the Gemini South telescope (Skemer & Close 2011). Ten measurements by two amateur astronomers based on CCD frames obtained with small telescopes between 2008 and 2016 have been reported, their most recent publications being Anton (2014) and Daley (2016).
In our orbital solution described in §5.2, we used a sigma-clipping algorithm to reject badly discrepant measurements. We rejected a total of 67 observations: 59 micrometer, five photographic, and three amateur CCD measurements. The rejected observations are identified in the Notes column of Table 8. As mentioned in the notes to the electronic version, many of these observations were of dubious quality to begin with.
References
- (1)
- (2)
- (3) Adams, W. S. 1915, PASP, 27, 236
- (4)
- (5) Aitken, R. G. 1918, Lick Observatory Bulletin, 9, 184
- (6)
- (7) Aitken, R. G. 1935, The Binary Stars, 2nd ed. (New York: McGraw-Hill)
- (8)
- (9) Ammler-von Eiff, M., & Guenther, E. W. 2009, A&A, 508, 677
- (10)
- (11) Anton, R. 2014, Journal of Double Star Observations, 10, 232
- (12)
- (13) Arnett, W. D., Meakin, C., Viallet, M., et al. 2015, ApJ, 809, 30
- (14)
- (15) Arnett, W. D., & Moravveji, E. 2017, ApJ, 836, L19
- (16)
- (17) Auwers, A. 1864, MNRAS, 25, 38
- (18)
- (19) Barstow, M. A., Bond, H. E., Holberg, J. B., et al. 2005, MNRAS, 362, 1134
- (20)
- (21) Barstow, M. A., Joyce, S., Casewell, S. L., Holberg, J. B., Bond, H. E., & Burleigh, M. R. 2017, in 20th European White Dwarf Workshop, ed. P.-E. Tremblay, B. Gänsicke, & T. Marsh (San Francisco: ASP), 383
- (22)
- (23) Basu, S., & Antia, H. M. 2008, Phys. Rep., 457, 217
- (24)
- (25) Benest, D., & Duvent, J. L. 1995, A&A, 299, 621
- (26)
- (27) Bergeron, P., Wesemael, F., Dufour, P., et al. 2011, ApJ, 737, 28
- (28)
- (29) Bessel, F. W. 1844, MNRAS, 6, 136
- (30)
- (31) Bohlin, R. C., Mészáros, S., Fleming, S., et al. 2017, ApJ, submitted
- (32)
- (33) Bonačić Marinović, A. A., Glebbeek, E., & Pols, O. R. 2008, A&A, 480, 797 (BM08)
- (34)
- (35) Bond, G. P. 1862a, Astronomische Nachrichten, 57, 131
- (36)
- (37) Bond, G. P. 1862b, American Journal of Science and Arts, 33, 286
- (38)
- (39) Bond, H. E., Gilliland, R. L., Schaefer, G. H., et al. 2015, ApJ, 813, 106 (B15)
- (40)
- (41) Bonnet-Bidaud, J. M., Colas, F., & Lecacheux, J. 2000, A&A, 360, 991
- (42)
- (43) Bowler, B. P. 2016, PASP, 128, 102001
- (44)
- (45) Boyajian, T. S., von Braun, K., van Belle, G., et al. 2013, ApJ, 771, 40
- (46)
- (47) Bressan, A., Marigo, P., Girardi, L., et al. 2012, MNRAS, 427, 127
- (48)
- (49) Brosch, N. 2008, Sirius Matters, Astrophysics & Space Science Library, vol. 354 (Berlin: Springer)
- (50)
- (51) Burleigh, M. R., Clarke, F. J., & Hodgkin, S. T. 2002, MNRAS, 331, L41
- (52)
- (53) Campbell, W. W. 1905, PASP, 17, 66
- (54)
- (55) Cowley, C. R., Ayres, T. R., Castelli, F., et al. 2016, ApJ, 826, 158
- (56)
- (57) Cristini, A., Meakin, C., Hirschi, R., et al. 2016, arXiv:1610.05173
- (58)
- (59) Cummings, J. D., Kalirai, J. S., Tremblay, P.-E., & Ramirez-Ruiz, E. 2016, ApJ, 818, 84 (C16)
- (60)
- (61) Daley, J. 2016, Journal of Double Star Observations, 12, 468
- (62)
- (63) David, T. J., & Hillenbrand, L. A. 2015, ApJ, 804, 146
- (64)
- (65) Davis, J., Ireland, M. J., North, J. R., et al. 2011, PASA, 28, 58 I(D11)
- (66)
- (67) Demarque, P., Guenther, D. B., Li, L. H., Mazumdar, A., & Straka, C. W. 2008, Ap&SS, 316, 31
- (68)
- (69) Demarque, P., Woo, J.-H., Kim, Y.-C., & Yi, S. K. 2004, ApJS, 155, 667
- (70)
- (71) Eggen, O. J. 1960, MNRAS, 120, 563
- (72)
- (73) Eggen, O. J. 1992, AJ, 104, 1493
- (74)
- (75) Gatewood, G. D., & Gatewood, C. V. 1978, ApJ, 225, 191 (GG78)
- (76)
- (77) Girard, T. M., Wu, H., Lee, J. T., et al. 2000, AJ, 119, 2428
- (78)
- (79) Gonzaga, S., & Biretta, J. 2010, HST WFPC2 Data Handbook, Version 5.0 (Baltimore: STScI)
- (80)
- (81) Gray, D. F. 2014, AJ, 147, 81
- (82)
- (83) Greenstein, J. L., Oke, J. B., & Shipman, H. L. 1971, ApJ, 169, 563
- (84)
- (85) Grevesse, N., & Sauval, A. J. 1998, Space Sci. Rev., 85, 161 (GS98)
- (86)
- (87) Guenther, D. B., Demarque, P., & Gruberbauer, M. 2014, ApJ, 787, 164
- (88)
- (89) Hamada, T., & Salpeter, E. E. 1961, ApJ, 134, 683
- (90)
- (91) Hertzsprung, E. 1909, ApJ, 30, 135
- (92)
- (93) Hetherington, N. S. 1980, QJRAS, 21, 246
- (94)
- (95) Holberg, J. B. 2007, Sirius: Brightest Diamond in the Night Sky (Berlin: Springer)
- (96)
- (97) Holberg, J. B. 2009, Journal for the History of Astronomy, 40, 137
- (98)
- (99) Holberg, J. B. 2010, Journal for the History of Astronomy, 41, 41
- (100)
- (101) Holberg, J. B., Barstow, M. A., Bruhweiler, F. C., Cruise, A. M., & Penny, A. J. 1998, ApJ, 497, 935
- (102)
- (103) Holberg, J. B., & Bergeron, P. 2006, AJ, 132, 1221
- (104)
- (105) Holberg, J. B., & Wesemael, F. 2007, Journal for the History of Astronomy, 38, 161
- (106)
- (107) Holman, M. J., & Wiegert, P. A. 1999, AJ, 117, 621
- (108)
- (109) Izzard, R. G., Dermine, T., & Church, R. P. 2010, A&A, 523, A10
- (110)
- (111) Jasinta, D. M. D., & Hidayat, B. 1999, A&AS, 136, 293
- (112)
- (113) Johnson, H. L., & Morgan, W. W. 1953, ApJ, 117, 313
- (114)
- (115) Kervella, P., Thévenin, F., Morel, P., Bordé, P., & Di Folco, E. 2003, A&A, 408, 681
- (116)
- (117) King, J. R., Villarreal, A. R., Soderblom, D. R., Gulliver, A. F., & Adelman, S. J. 2003, AJ, 125, 1980 (K03)
- (118)
- (119) Kowalski, P. M., & Saumon, D. 2006, ApJ, 651, L137
- (120)
- (121) Landstreet, J. D. 2011, A&A, 528, A132 (L11)
- (122)
- (123) Lemke, M. 1989, A&A, 225, 125
- (124)
- (125) Liebert, J., Young, P. A., Arnett, D., Holberg, J. B., & Williams, K. A. 2005, ApJ, 630, L69 (L05)
- (126)
- (127) Lindenblad, I. W. 1970, AJ, 75, 841
- (128)
- (129) Lindenblad, I. W. 1973, AJ, 78, 205
- (130)
- (131) Lodders, K. 2010, Astrophysics and Space Science Proceedings, 16, 379 (L10)
- (132)
- (133) Luyten, W. J. 1922, PASP, 34, 356
- (134)
- (135) Morgan, W. W., Harris, D. L., & Johnson, H. L. 1953, ApJ, 118, 92
- (136)
- (137) Perets, H. B., & Kratter, K. M. 2012, ApJ, 760, 99 (PK12)
- (138)
- (139) Richer, J., Michaud, G., & Turcotte, S. 2000, ApJ, 529, 338
- (140)
- (141) Roman, N. G. 1949, ApJ, 110, 205
- (142)
- (143) Russell, H. N. 1944, AJ, 51, 13
- (144)
- (145) Schroeder, D. J., Golimowski, D. A., Brukardt, R. A., et al. 2000, AJ, 119, 906
- (146)
- (147) Skemer, A. J., & Close, L. M. 2011, ApJ, 730, 53
- (148)
- (149) Soderblom, D. R., & Mayor, M. 1993, AJ, 105, 226
- (150)
- (151) Spada, F., Demarque, P., Kim, Y.-C., & Sills, A. 2013, ApJ, 776, 87
- (152)
- (153) Struve, O. 1893, Pulkovo Observatory Publications, 10
- (154)
- (155) Thalmann, C., Usuda, T., Kenworthy, M., et al. 2011, ApJ, 732, L34
- (156)
- (157) Tremblay, P.-E., Bergeron, P., & Gianninas, A. 2011, ApJ, 730, 128
- (158)
- (159) van Albada, G. B. 1962, Journal des Observateurs, 45, 1
- (160)
- (161) van Albada, G. B. 1971, A&A, 11, 317
- (162)
- (163) van de Kamp, P. 1971, ARA&A, 9, 103
- (164)
- (165) van den Bos, W. H. 1960, Journal des Observateurs, 43, 145
- (166)
- (167) van den Bos, W. H. 1964, in Astronomical Techniques, ed. W. A. Hiltner (Chicago: Univ. of Chicago Press), 537
- (168)
- (169) van Leeuwen, F. 2007, A&A, 474, 653
- (170)
- (171) Viallet, M., Meakin, C., Arnett, D., & Mocák, M. 2013, ApJ, 769, 1
- (172)
- (173) Vigan, A., Gry, C., Salter, G., et al. 2015, MNRAS, 454, 129
- (174)
- (175) Wesemael, F., & Racine, R. 2008, Journal for the History of Astronomy, 39, 161
- (176)
- (177) Yi, S., Demarque, P., Kim, Y.-C., et al. 2001, ApJS, 136, 417
- (178)
- (179) Zacharias, N., Winter, L., Holdenried, E. R., et al. 2008, PASP, 120, 644
![[Uncaptioned image]](/html/1703.10625/assets/x1.png)
False-color rendition of an HST image of Sirius, from a WFPC2 frame obtained in the near-infrared F1042M filter on 2001 October 27, exposure time 35 s. The white dwarf Sirius B lies to the lower left of the grossly overexposed Sirius A, at a separation of . The diffraction spikes were used to locate the centroid of Sirius A, as described in the text. In this near-IR bandpass the brightness difference is about 10.6 mag.
![[Uncaptioned image]](/html/1703.10625/assets/x2.png)
Digitized image of Sirius taken from a scan of a photographic plate obtained with the USNO 26-inch refractor. A hexagonal mask was used in front of the objective, and oriented to place Sirius B between two of the spikes at the lower right. An objective wire grating was also used, producing first- and second-order images on either side of the overexposed Sirius A, from which its centroid can be determined.


| UT Date | DatasetaaDataset identifier for first useful observation made at each visit. Principal Investigator was H. Ford for first two epochs, H.E.B. for the rest. | Exposure | No. | Proposal |
|---|---|---|---|---|
| Times [s]bbExposures of 0.11 s were also taken during some WFPC2 visits, but were not used in our astrometric analysis. | FramesccTotal number of useful individual frames obtained during each visit. | ID | ||
| WFPC2/PC Frames, F1042M Filter | ||||
| 1997 Mar 19 | u3mi1503r | 12, 100 | 8 | 6887 |
| 1997 May 18 | u3mi1603m | 12, 100 | 8 | 6887 |
| 2001 Oct 27 | u6gb0202m | 4, 5, 6, 7, 35 | 10 | 9072 |
| 2002 May 10 | u6gb0306m | 8, 40, 60 | 10 | 9072 |
| 2002 Oct 20 | u8if0206m | 8, 40, 60 | 10 | 9334 |
| 2003 Apr 18 | u8if0306m | 8, 40, 60 | 10 | 9334 |
| 2003 Oct 15 | u8tp0206m | 8, 40, 60 | 10 | 9964 |
| 2004 Aug 15 | u8tp0301m | 8, 60 | 12 | 9964 |
| 2005 Apr 20 | u8tp0601m | 8, 60 | 12 | 9964 |
| 2006 Jan 15 | u9bv0101m | 8, 60 | 12 | 10619 |
| 2006 Dec 27 | u9o60101m | 8, 40, 60 | 13 | 10990 |
| 2008 Jan 03 | u9z80101m | 8, 60 | 12 | 11290 |
| WFC3/UVIS Frames, F953N Filter | ||||
| 2010 Sep 02 | ibk703010 | 6, 12 | 28 | 12296 |
| 2011 Oct 01 | ibti03010 | 6, 12 | 28 | 12673 |
| 2012 Sep 26 | ic1k03010 | 6, 12 | 28 | 13062 |
| 2014 Mar 31 | ica103010 | 6, 12 | 28 | 13468 |
| 2016 Aug 20 | icvd03010 | 6, 12 | 28 | 14342 |
| UT Date | Besselian | Separation | J2000 Position | Source |
|---|---|---|---|---|
| Date | [arcsec] | Angle [∘] | ||
| 1997 Mar 19 | 1997.2137 | WFPC2 F1042M spike fit | ||
| 1997 May 18 | 1997.3782 | WFPC2 F1042M spike fit | ||
| 2001 Oct 27 | 2001.8209 | WFPC2 F1042M spike fit | ||
| 2002 May 10 | 2002.3562 | WFPC2 F1042M spike fit | ||
| 2002 Oct 20 | 2002.8012 | WFPC2 F1042M spike fit | ||
| 2003 Apr 18 | 2003.2942 | WFPC2 F1042M spike fit | ||
| 2003 Oct 15 | 2003.7879 | WFPC2 F1042M spike fit | ||
| 2004 Aug 15 | 2004.6224 | WFPC2 F1042M spike fit | ||
| 2005 Apr 20 | 2005.3012 | WFPC2 F1042M spike fit | ||
| 2006 Jan 15 | 2006.0415 | WFPC2 F1042M spike fit | ||
| 2006 Dec 27 | 2006.9883 | WFPC2 F1042M spike fit | ||
| 2008 Jan 03 | 2008.0072 | WFPC2 F1042M spike fit | ||
| 2010 Sep 02 | 2010.6697 | WFC3 F953N spike fit | ||
| 2011 Oct 01 | 2011.7484 | WFC3 F953N spike fit | ||
| 2012 Sep 26 | 2012.7392 | WFC3 F953N spike fit | ||
| 2014 Mar 31 | 2014.2455 | WFC3 F953N spike fit | ||
| 2016 Aug 20 | 2016.6361 | WFC3 F953N spike fit | ||
| 2010 Sep 02 | 2010.6697 | WFC3 F953N PSF fit | ||
| 2011 Oct 01 | 2011.7484 | WFC3 F953N PSF fit | ||
| 2012 Sep 26 | 2012.7392 | WFC3 F953N PSF fit | ||
| 2014 Mar 31 | 2014.2455 | WFC3 F953N PSF fit | ||
| 2016 Aug 20 | 2016.6361 | WFC3 F953N PSF fit | ||
| 2010 Sep 02 | 2010.6697 | WFC3 F953N average | ||
| 2011 Oct 01 | 2011.7484 | WFC3 F953N average | ||
| 2012 Sep 26 | 2012.7392 | WFC3 F953N average | ||
| 2014 Mar 31 | 2014.2455 | WFC3 F953N average | ||
| 2016 Aug 20 | 2016.6361 | WFC3 F953N average |
| Besselian | Position | Separation | Besselian | Position | Separation | |
|---|---|---|---|---|---|---|
| Date | AngleaaReferred to equator of observation date [∘] | [arcsec] | Date | AngleaaReferred to equator of observation date [∘] | [arcsec] | |
| 1970.1331 | 1976.1460 | |||||
| 1970.1930 | 1976.1591 | |||||
| 1970.1990 | 1976.1840 | |||||
| 1970.2371 | 1976.1949 | |||||
| 1970.2430 | 1976.2390 | |||||
| 1970.2729 | 1976.2610 | |||||
| 1970.2920 | 1976.2629 | |||||
| 1970.7990 | 1976.9670 | |||||
| 1970.8010 | 1977.1290 | |||||
| 1970.9520 | 1977.1510 | |||||
| 1971.0179 | 1977.1780 | |||||
| 1971.2230 | 1977.2410 | |||||
| 1971.2720 | 1977.2679 | |||||
| 1971.2830 | 1977.9940 | |||||
| 1971.8910 | 1978.1470 | |||||
| 1971.9050 | 1978.1500 | |||||
| 1971.9160 | 1978.2130 | |||||
| 1972.1429 | 1979.2310 | |||||
| 1972.1479 | 1979.2450 | |||||
| 1972.1510 | 1979.8390 | |||||
| 1972.1591 | 1979.9100 | |||||
| 1973.0710 | 1980.1680 | |||||
| 1973.1560 | 1980.2220 | |||||
| 1973.7880 | 1980.2390 | |||||
| 1973.8430 | 1981.1180 | |||||
| 1973.9550 | 1981.1230 | |||||
| 1974.0430 | 1981.1370 | |||||
| 1974.2560 | 1981.1560 | |||||
| 1974.2590 | 1981.1591 | |||||
| 1974.2650 | 1981.2740 | |||||
| 1975.2230 | 1981.9860 | |||||
| 1975.2810 | 1982.2729 | |||||
| 1975.8440 | 1984.1899 |
| Element | Value |
|---|---|
| Orbital period, [yr] | 50.1284 0.0043 |
| Semimajor axis, [arcsec] | 7.4957 0.0025 |
| Inclination, [deg] | 136.336 0.040 |
| Position angle of node, [deg] | 45.400 0.071 |
| Date of periastron passage, [yr] | 1994.5715 0.0058 |
| Eccentricity, | 0.59142 0.00037 |
| Longitude of periastron, [deg] | 149.161 0.075 |
| Source | Value | Reference |
|---|---|---|
| Absolute Parallax, [arcsec] | ||
| Ground-based compilation | Gatewood & Gatewood (1978) | |
| Hipparcos | van Leeuwen (2007) | |
| Weighted mean | Adopted | |
| Semimajor Axis, [arcsec] | ||
| Ground-based compilation | Gatewood & Gatewood (1978) | |
| Solution with updated elements | Adopted | |
| Quantity | van den Bos (1960) | Gatewood & Gatewood (1978) | This paper |
|---|---|---|---|
| Total mass, | |||
| Mass of Sirius A, | |||
| Mass of Sirius B, |
| Quantity | Value | Uncertainty | [] | [] |
|---|---|---|---|---|
| Absolute parallax, | 0.3789 | 0.0014 arcsec | 0.023 | 0.011 |
| Semimajor axis, | 7.4957 | 0.0025 arcsec | 0.0024 | 0.0007 |
| Semimajor axis for A, | 2.4761 | 0.0045 arcsec | 0.0018 | 0.0018 |
| Period, | 50.1284 | 0.0043 yr | 0.0004 | 0.0002 |
| Combined mass uncertainty | 0.023 | 0.011 |
| Date | PA | Sep. | PA_cor | e_PA | Sep_cor | e_Sep | Observer | MethodbbMethod code: M = Micrometer, P = Photographic, C = CCD, H = HST | Tel. | NotesccNotes codes, explained fully in machine-readable table; R1 = rejected from solution; M1 = mean of multiple observations; etc. |
|---|---|---|---|---|---|---|---|---|---|---|
| (BY) | (deg) | (arcsec) | (deg) | (deg) | (arcsec) | (arcsec) | CodeaaObserver reference code (see Table 9) | (m) | ||
| 1862.102 | 88.55 | 11.36 | 89.369 | 11.3618 | Bond_1862a | M | 0.4 | R1 | ||
| 1862.111 | 85.15 | 10.18 | 85.969 | 1.917 | 10.1818 | 0.4467 | Bond_1862a | M | 0.4 | M1 |
| 1862.127 | 83.00 | 9.85 | 83.819 | 1.917 | 9.8518 | 0.4467 | Bond_1862a | M | 0.4 | |
| 1862.190 | 84.13 | 9.63 | 84.949 | 1.916 | 9.6318 | 0.4466 | Bond_1862a | M | 0.4 | M1 |
| 1862.239 | 84.15 | 9.94 | 84.968 | 1.916 | 9.9418 | 0.4465 | Bond_1862a | M | 0.4 | M1 |
| 1862.278 | 84.26 | 10.06 | 85.078 | 1.916 | 10.0618 | 0.4465 | Bond_1862a | M | 0.4 | M1 |
| 1862.190 | 85.267 | 8.95 | 86.086 | 1.949 | 8.9518 | 0.4615 | Rutherfurd_1862 | M | 0.3 | |
| 1862.193 | 10.93 | 99.000 | 0.000 | 10.9318 | 0.4615 | Rutherfurd_1862 | M | 0.3 | ||
| 1862.215 | 83.0 | 10.4 | 83.818 | 1.785 | 10.4018 | 0.3867 | Chacornac_1862 | M | 0.8 | |
| 1862.228 | 86.1 | 10.43 | 86.918 | 1.785 | 10.4318 | 0.3866 | Chacornac_1862 | M | 0.8 |
Note. — This table is available in its entirety in machine-readable format through the online journal and VizieR. A portion is shown here for guidance regarding its form and content.
| Observer Code | BibCodeaaBibcode in NASA ADS, http://www.adsabs.harvard.edu | Full Reference |
|---|---|---|
| Aitken_1896 | 1896PASP….8..314A | Aitken, R.G. 1896, PASP, 8, 314 |
| Aitken_1914 | 1914PLicO..12….1A | Aitken, R.G. 1914, Publ. Lick Obs., 12, 1 |
| Aitken_1923 | 1923LicOB..11…58A | Aitken, R.G. 1923, Lick Observatory Bulletin, 11, 58 |
| Aitken_1926 | 1926PASP…38..131A | Aitken, R.G. 1926, PASP, 38, 131 |
| Aitken_1927 | 1927LicOB..12..173A | Aitken, R.G. 1927, Lick Observatory Bulletin, 12, 173 |
| Bond_1862a | 1862AN…..58…85B | Bond, G.P. 1862, AN, 58, 85 |
| Chacornac_1862 | 1862AN…..57..175C | Chacornac, M. 1862, AN, 57, 175 |
| Rutherfurd_1862 | Rutherfurd, L. 1862, AmJSA, 34, 294 |
Note. — This table is available in its entirety in machine-readable format through the online journal and VizieR. A portion is shown here for guidance regarding its form and content.