Mufasa: The assembly of the red sequence
Abstract
We examine the growth and evolution of quenched galaxies in the Mufasa cosmological hydrodynamic simulations that include an evolving halo mass-based quenching prescription, with galaxy colours computed accounting for line-of-sight extinction to individual star particles. Mufasa reproduces the observed present-day red sequence reasonably well, including its slope, amplitude, and scatter. In Mufasa, the red sequence slope is driven entirely by the steep stellar mass–stellar metallicity relation, which independently agrees with observations. High-mass star-forming galaxies blend smoothly onto the red sequence, indicating the lack of a well-defined green valley at . The most massive galaxies quench the earliest and then grow very little in mass via dry merging; they attain their high masses at earlier epochs when cold inflows more effectively penetrate hot halos. To higher redshifts, the red sequence becomes increasingly contaminated with massive dusty star-forming galaxies; UVJ selection subtly but effectively separates these populations. We then examine the evolution of the mass functions of central and satellite galaxies split into passive and star-forming via UVJ. Massive quenched systems show good agreement with observations out to , despite not including a rapid early quenching mode associated with mergers. However, low-mass quenched galaxies are far too numerous at in Mufasa, indicating that Mufasa strongly over-quenches satellites. A challenge for hydrodynamic simulations is to devise a quenching model that produces enough early massive quenched galaxies and keeps them quenched to , while not being so strong as to over-quench satellites; Mufasa’s current scheme fails at the latter.
keywords:
galaxies: formation, galaxies: evolution, methods: N-body simulations1 Introduction
For nearly a century, it has been recognised that galaxies divide into a star-forming population consisting primarily of disk galaxies, and a passive population consisting primarily of bulge-dominated galaxies. The initial dichotomy goes back to the Hubble sequence characterising the differences in morphology, but it is now well established that it extends to a wide range of galaxy properties, including star formation rate, gas content, dust content, environment, mass, and central black hole properties. Understanding the physical origin of this dichotomy in terms of galaxy formation processes over cosmic time represents a key unsolved challenge in modern astrophysics, and despite impressive observational constraints, remains poorly understood.
There exists a canonical scenario for the co-evolution of morphology and ongoing star formation. In it, disk galaxies form first owing to angular momentum conservation in the dissipational gaseous component (Fall & Efstathiou, 1980; Dalcanton, Spergel, & Summers, 1997; Mo, Mao, & White, 1998), after which such galaxies merge together to make elliptical systems (e.g. Barnes, 1992). Early hydrodynamic simulations noted the connection of gas-rich mergers to starburst activity (Mihos & Hernquist, 1996), in accord with observations demonstrating such a connection (Sanders & Mirabel, 1996). Simulations then incorporated models for black hole growth and showed that mergers are able to subsequently trigger strong active galactic nuclei (AGN; Springel, 2005) whose energetic feedback (under optimistic assumptions) is able to evacuate the remaining cold gas to leave a passive bulge-dominated system. Hence the current paradigm is that galaxies form as disks that eventually merge together and undergo a starburst with associated black hole growth, leaving a cold gas-free, non-starforming elliptical system with a large central black hole (Hopkins et al., 2008). Semi-analytic models incorporating these elements are able to successfully reproduce a wide range of galaxy properties including galaxy-black hole co-evolution (, 2006; Bower et al., 2006; Somerville et al., 2008; Benson, 2014; Somerville & Davé, 2015).
However, emerging observations have shown that this merger-starburst paradigm may not completely, or even predominantly, explain the formation of massive “red and dead” galaxies. One key observation is that true passive disk galaxies exist (Bamford et al., 2009; van der Wel et al., 2009), and are increasingly common to higher redshifts (Bundy et al., 2010). This shows that the transition to being passive is not necessarily accompanied by a change in morphology, as one would expect via a merger. Observations also show that, at least at intermediate redshifts, AGN activity is not obviously correlated with merger-like morphological signatures (e.g. Schawinski et al., 2011; Kocevski et al., 2012) as one might expect if black hole growth is predominantly linked with merger activity. Finally, theoretical work has shown that mergers of highly gas-rich disk galaxies can result in a final merged galaxy that is still a disk rather than an elliptical (e.g. Robertson et al., 2006), and indeed this seems to be necessary in order to reproduce the observed distribution of galaxy morphologies (Hopkins et al., 2009), thus casting doubt on the unique association of mergers and morphological transformation. These results suggest that the path(s) to forming red sequence elliptical galaxies may be more complex than canonically believed.
Models that aim to explain massive galaxy formation must reproduce all these subtle facets of the observed galaxy population. Stringent constraints on models are already provided by the detailed observed properties of passive galaxies. For instance, the red sequence in colour-magnitude or colour-mass space is remarkably tight, showing that at a given luminosity or mass, there is a limited range of stellar population ages and/or metallicities that is allowed. The red sequence also shows a distinct slope such that more massive galaxies are redder. This can owe either to a trend in stellar population age or metallicity, such that passive galaxies at higher mass are older and/or more metal-rich, but it is not obvious which one is the predominant driver. The fraction of galaxies in the green valley is also an important observation, as it constrains the timescale for passage from the blue cloud to the red sequence. A timescale of under a gigayear would be associated with a rapid shutoff of star formation, while significantly larger timescales would indicate a more gradual process perhaps associated only with a shutoff of fresh accretion. Finally, dust extinction is important, as more massive star-forming galaxies tend to have higher metallicities and hence dust content that, particularly at higher redshifts, can result in them lying within the red sequence in colour while still being star-forming. Thus quantitatively characterising the buildup of the passive population involves carefully and homogeneously selecting passive objects across all redshifts. These are some of the issues that models of passive galaxy formation could help resolve if they are able to adequately reproduce the observed growth of such galaxies.
Cosmological hydrodynamic simulations offer a self-consistent platform to study the evolution of massive red sequence galaxies within the context of the overall galaxy population. Since red sequence galaxies typically represent the endpoint of galaxy evolution, it is important to initially validate such simulations against observations of the growth of star-forming galaxies across cosmic time – clearly, if the properties of the star-forming progenitors of massive galaxies are incompatible with data, then it casts doubt on the validity of the predictions for massive galaxies. Fortunately, thanks to an improving understanding of galaxy formation physics, many modern galaxy formation simulations are now able to broadly reproduce the observed star-forming galaxy population over the majority of cosmic time (e.g. Somerville & Davé, 2015). Key elements required to achieve this include stellar feedback that is increasingly effective at suppressing star formation in smaller galaxies, and a feedback mechanism that suppresses star formation in massive galaxies typically associated with energy release from AGN activity. Incorporating these mechanisms, even heuristically, into models enables simulations to regulate the efficiency of star formation at both high and low masses in a manner consistent with observations.
Armed with broadly successful models of galaxy formation, several groups have examined the red sequence population in their hydrodynamical simulations. Building on hydrodynamic galaxy formation simulations that modeled black hole growth via Bondi accretion (Di Matteo, Springel, & Hernquist, 2005), Sijacki et al. (2007) pioneered a unified model for cosmological black hole–galaxy co-evolution including AGN feedback that significantly suppressed the growth and reddened the colours of massive galaxies. However, in a cosmological setting such simulations were unable to produce a tight red sequence as observed, particularly once star formation-driven feedback was included. A related black hole growth and feedback model was utilised by the more recent Illustris simulation, which used an advanced hydrodynamics solver and updated stellar feedback recipes, and nicely reproduced observed black hole–galaxy correlations Sijacki et al. (2015). Still, Illustris was unable to produce a red sequence that was sufficiently well-populated, sufficiently red, and sufficiently tight as observed (Vogelsberger et al., 2014). The recent Evolution and Assembly of GaLaxies and their Environments (EAGLE; Schaye et al., 2015) simulation has produced the closest match to the observed galaxy colour distribution to date using a model with self-consistent black hole growth. Trayford et al. (2015) showed that EAGLE produced a red sequence whose colour is within 0.1 dex of data, and a blue cloud that matches the bulk of the observed star-forming galaxy population. Nonetheless, there were still discrepancies regarding the slope of the red sequence and an excess of bright blue galaxies. Crucial for their comparison was that they included dust extinction, albeit as a simple dust screen with dependences on gas content and metallicity. These results demonstrate that simulations are now starting to broadly reproduce the observed red sequence, but significant challenges remain.
A distinct approach for quenching galaxies in simulations was taken in a series of papers by Gabor & Davé (2010, 2012, 2015) Rather than implementing black hole growth and associated energy release to quench galaxies directly, they mimicked the impact of AGN feedback via perpetual gas heating in massive halos. Gabor et al. (2011) showed via post-processing simulated galaxy star formation histories (SFHs) that evacuating all the cold gas from galaxies via mergers does not produce red and dead galaxies, since accretion and hence star formation restarts after 1–2 Gyr. Instead, a model where diffuse hot gas in massive halos is prevented from cooling was able to broadly reproduce observed galaxy colours and the red and blue galaxy mass functions (Gabor et al., 2011), albeit with too few passive galaxies at higher redshifts (Gabor & Davé, 2012). However, when incorporated on-the-fly into a full hydrodynamic simulation, this model still suffered from too shallow and too blue a red sequence, though this could be rectified by re-calibrating the luminosity–stellar metallicity relation (note that EAGLE also employs such a re-calibration; Trayford et al., 2015). Finally, Gabor & Davé (2015) showed that such a model can simultaneously produce the trends of satellite (environmental) and central (mass) quenching in accord with observations by e.g. Peng et al. (2010). These results indicate that mergers are not the dominant pathway to quenching, and instead that balancing cooling with heat input in massive halos is broadly effective at reproducing both central and satellite colour distributions as observed.
In this work, we examine the red sequence in the Mufasa suite of cosmological hydrodynamic simulations. Mufasa produces one of the most data-concordant representations of the galaxy population across cosmic time among current galaxy formation models, in terms of global galaxy stellar (Davé, Thompson, Hopkins, 2016), gas, and metal (Davé et al., 2017) properties. In Mufasa, the model for quenching follows Gabor et al. via suppressing gas cooling in massive halos on the fly, rather than directly modeling black hole growth and feedback. Like every current quenching model, Mufasa is heuristic and requires free parameters. In our case the key free parameter is the quenching halo mass scale, i.e. the halo mass above which we keep halo gas hot. To choose this, we appeal to constraints derived from the analytic equilibrium model for galaxy evolution (Mitra, Davé, & Finlator, 2015), which uses a Monte Carlo Markov Chain approach to constrain this parameter (simultaneously with various others) against observations of galaxy stellar and metal assembly over most of cosmic time. Hence while our evolving quenching mass scale is a free parameter, it is not adjusted specifically to match Mufasa to data.
In Davé, Thompson, Hopkins (2016) we showed that Mufasa produces a galaxy stellar mass function with an abrupt cutoff at high masses that is in good agreement with observations; this had been difficult to achieve in earlier hydrodynamic simulations. This hints that our quenching model is properly suppressing the growth of massive galaxies, but as many other works have shown, this does not necessarily imply a red sequence with the proper slope and scatter. On the other hand, Davé et al. (2017) hinted that the neutral gas content in Mufasa’s massive galaxies is under-predicted, suggesting that quenching may be overly strong. Here we build on these works to examine the quenched galaxy population in Mufasa in more detail, in terms of theit colours, mass functions, evolution, and central vs. satellite populations.
This paper is outlined as follows: In §2 we briefly recap the key ingredients of the Mufasa simulations. §3 presents our main results, including the colour-mass diagram, the stellar mass–stellar metallicity relation, evolutionary tracks, the UVJ diagram, and quenched mass functions subdivided by central and satellite populations, and we discuss our results compared to other recent works. In §4 we summarize our findings.
2 Simulation and Analysis
2.1 The Mufasa Simulations
The Mufasa simulations are run with a modified version of the gravity plus hydrodynamics solver Gizmo (Hopkins, 2015), which uses the Gadget-3 tree-particle-mesh gravity solver (Springel, 2005), together with the meshless finite mass (MFM) solver for hydrodynamics. We use adaptive gravitational softening throughout for all particles (Hopkins, 2015), with a minimum (Plummer-equivalent) softening length set to 0.5% of the mean interparticle spacing, chosen to balance the increased resolution afforded by adaptive softening versus the increased computing time it requires.
Radiative cooling is included from primordial elements without assuming ionisation equilibrium, and heavy elements under the assumption of equilibrium ionisation, via the Grackle-2.1 chemistry and cooling library (The Enzo Collaboration, 2014; Kim et al., 2014). A spatially-uniform photo-ionising background is applied, taken from Faucher-Giguere, Kereš, & Ma (2009), and all gas is assumed to be optically thin. Gas above a specified threshold density is assumed to have an equation of state given by (Schaye & Dalla Vecchia, 2008), and for the run employed in this paper the threshold density is taken to be cm-3. Stars are formed using a molecular gas-based prescription following Krumholz, McKee, & Tumlinson (2009), which computes the H2 fraction based on the local density utilising the Sobolev approximation, along with the particle’s metallicity scaled to solar abundance based on Asplund et al. (2009). Using this, we assume stars form with a rate given by , where is the star formation efficiency, and . In detail, we compute a star formation probability for each timestep, and probabalistically convert individual gas particles entirely into stars.
Star formation feedback is modeled using decoupled, two-phase winds. Winds are ejected stochastically, with a probability that is times that of the star formation rate. We take to be the best-fit relation from the Feedback In Realistic Environments (FIRE) suite of zoom simulations Muratov et al. (2015), namely
| (1) |
where is the galaxy stellar mass determined using an on-the-fly friends-of-friends galaxy finder. The ejection velocity scaling is likewise assumed to follow scalings from FIRE albeit with a higher amplitude, namely
| (2) |
where is the galaxy circular velocity estimated from the friends-of-friends baryonic mass via the baryonic Tully-Fisher relation, and accounts for the potential difference between the launch location and one-quarter of the virial radius. Wind particles are ejected with a 30% probability of being “hot”, namely at a temperature set by the difference between the supernova energy and the wind launch energy, with the remaining 70% launched at K. No adjustment is made to the wind particles’ metallicities upon ejection, meaning they carry with them a metallicity typical of the ISM from where they were launched. Wind fluid elements are decoupled, i.e. hydrodynamic forces and cooling are turned off, until such time as its Mach number relative to its local fluid is less that 0.5, or alternatively if it reaches limits in density of 0.01 times the SF critical density, or a time given by 2% of the Hubble time at launch. We further include feedback from Type Ia supernovae (SNIa) and asymptotic giant branch (AGB) stars, implemented as a delayed component using stellar evolution as tracked by Bruzual & Charlot (2003) models with a Chabrier (2003) initial mass function (IMF). This includes erg of energy per Type Ia SN, and a heating term due to AGB winds, where we assume that such winds are ejected at 100 km/s and immediately thermalise in surrounding gas.
Chemistry is tracked for hydrogen, helium, and 9 metals: C, N, O, Ne, Mg, Si, S, Ca, and Fe. Type II SN yields Nomoto et al. (2006) are parameterised as a function of metallicity, which we multiply across the baord by 0.5 in order to more closely match observed galaxy metallicities. These yields are added instantaneously to every star-forming gas element at every timestep, based on its current star formation rate. We take SNIa yields from Iwamoto et al. (1999), assuming each SNIa yields of metals. AGB enrichment is parameterised as a function of age and metallicity following Oppenheimer & Davé (2008), assuming a 36% helium fraction and a N yield of 0.00118. The enrichment, like the energy, is added from stars to the nearest 16 gas particles, kernel-weighted, following the mass loss rate as computed from Bruzual & Charlot (2003) models.
Critical for the present work is our quenching prescription. To quench massive galaxies, we employ an on-the-fly halo mass-based prescription that broadly follows Gabor & Davé (2012, 2015). Above a halo quenching mass , we keep all halo gas at a temperature above the system virial temperature. This is intended to model the bulk effects of “radio mode” or “jet mode” feedback (, 2006), where jets inflate superbubbles in surrounding hot gas that counteracts gas cooling (McNamara & Nulsen, 2007).
We take as given by the best-fit formula from the analytic Equilibrium Model of galaxy formation (Davé, Finlator, & Oppenheimer, 2012), which uses an MCMC approach to constrain key feedback parameters directly to data within a simple baryon cycling framework (Mitra, Davé, & Finlator, 2015), and is remarkably successful at matching bulk galaxy evolution properties. The Equilibrium Model predicts a quenching mass that scales with redshift as
| (3) |
We employ an on-the-fly friends of friends (FOF) halo finder to determine the halo mass for each gas element. Gas in halos above that is not self-shielded is heated to , and allowed to cool until before being heated again. We define self-shielded gas as having a cold (atomic+molecular) fraction above 10%, after applying a self-shielding correction following Rahmati et al. (2013).
We note that this quenching model is rather extreme, as it uniformly heats all (non-dense) gas all the way out to the virial radius. We showed in Davé, Thompson, Hopkins (2016) that the energy requirements for this are not so severe compared to the expected available energy from black hole accretion. Nonetheless, the uniform spatial distribution of this energy is optimally efficient for quenching, hence this can be considered to be an optimistic model in terms of AGN feedback coupling efficiency.
Owing to our desire to explore massive galaxy evolution, in this paper we focus on our largest-volume Mufasa simulation that employs gas fluid elements (i.e. mass-conserving cells), dark matter particles, and minimum softening length. We generate initial conditions at using Music (Hahn & Abel, 2011) assuming a cosmology consistent with Planck (2015) “full likelihood” constraints: , , , , , and .
2.2 Analysis: Caesar and Loser
We output 135 snapshots down to . These outputs are analysed using the Caesar111http://caesar.readthedocs.org/en/latest/ (Thompson, 2015) simulation analysis suite embedded in the yt package, which identifies galaxies using SKID and halos using a friends-of-friends prescription with a linking length set to 0.2 times the mean interparticle separation, and then links galaxies and halos via their positions. Caesar goes on to calculate many basic properties of the galaxies and halos such as and SFR, and outputs an hdf5 file for each snapshot that contains all this information, including member particle lists.
To obtain galaxy colours, we employ the package Line Of Sight Extinction by Ray-tracing (Loser; https://bitbucket.org/romeeld/closer). For each star particle, we compute the single stellar population (SSP) stellar spectrum interpolated to the particle’s age and metallicity using the Flexible Stellar Population Synthesis (FSPS; Conroy, 2010) library. We then individually extinct each star’s spectrum based on the integrated dust column, by computing a line-of-sight metal column density using an SPH-kernel weighted integral of particles, and converting that to using relations measured in the Milky Way (Watson, 2011) at solar and above metallicities, with a metallicity dependence of the dust-to-metal ratio based on high-z GRB measurements (De Cia et al., 2013). We add a baseline extinction of to all galaxies to avoid extinction-free lines of sight; all star-forming systems have well above this.
Given , we redden the spectra assuming a Cardelli, Clayton, & Mathis (1989) Milky Way extinction. Finally, we sum all the individual stellar spectra within each SKID galaxy, and apply bandpass filters to obtain magnitudes. We also obtain a global for each galaxy by computing the difference between the extincted and unextincted spectra, and convolving that with the bandpass. All extincted flux is assumed to be re-emitted in the far-IR thereby yielding a bolometric far-IR luminosity, but because Loser does not properly account for dust radiative transfer, it does not compute a dust temperature and hence cannot (directly) predict a far-IR spectrum; in any case, here we will not be concerned with far-IR emission. In short, Loser provides a simple way to generate galaxy spectra that fully utilises the information in the simulation regarding individual line-of-sight extinction. It is thus an improvement over the oft-used dust screen model, while keeping assumptions (and computational cost) to a minimum as compared with full dust radiative transfer codes.
3 The Red Sequence in Mufasa
3.1 The colour- diagram
The classic plot that highlights the quenched galaxy population is the colour-magnitude diagram (CMD). It is well known that low-redshift galaxies separate fairly distinctly into two basic populations in a CMD, namely a star-forming blue cloud comprising mostly of disk galaxies, and a passive red sequence comprising primarily of bulge-dominated galaxies. In this paper, we will focus on colour-stellar mass diagrams (CSMDs), with the idea that stellar mass measurements at least in the nearby Universe are now fairly robust (Mobasher et al., 2015). This diagram has the advantage that (central) galaxies generally evolve towards larger with time, modulo stellar mass loss, and this metric is more straightforwardly relatable to other -based relations. For the nearly constant mass-to-light ratio typical of redder bands and older stellar populations, CMDs and CSMDs are essentially equivalent. Hence CSMDs represent a good diagnostic to study the assembly of the red sequence.
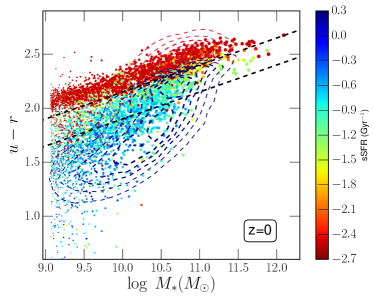
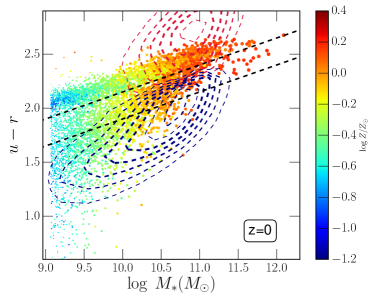
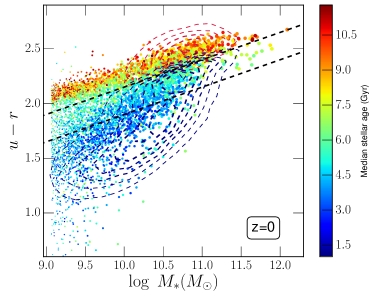
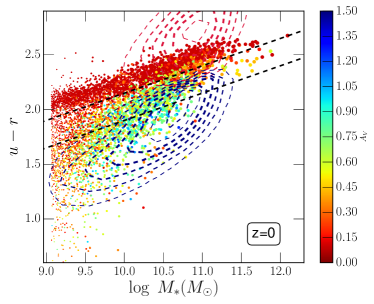
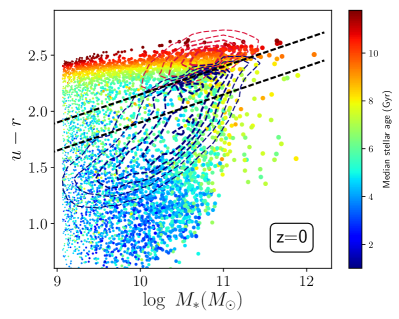
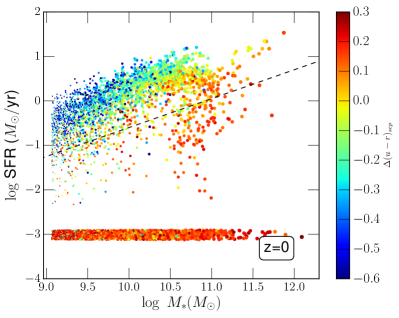
Figure 1 shows the CSMD at from our Mufasa simulation. Individual points are galaxies from Mufasa, and the points are the same for each panel. The difference between the panels is in the colour-coding of the points: Clockwise from upper left panel, we colour-code galaxies by their instantaneous sSFR, median stellar metallicity, -band extinction, and mean stellar age, as shown by the colour bars to the right of each panel.
Observations are indicated by the contours and dashed lines. The black dashed lines demarcate the “green valley” region from Schawinski et al. (2014) using SDSS data, and we will use the midpoint between those dashed lines as our division into red and blue; this separatrix is given by . In the right panels we show observations from Sloan Digital Sky Survey (SDSS; Simard et al., 2011; Mendel et al., 2013), while in the left panels we show results from the GAMA survey (Taylor et al., 2015) for galaxies with , each separated into red and blue populations. The GAMA data has a median , so we account for colour evolution to by adding 0.2 to the colour, which corresponds roughly to passive evolution for 2.5 Gyr. Note that in flux-limited surveys it is difficult to detect faint red galaxies, so the lack of a faint red sequence here owes in part to selection effects. The SDSS red sequence lies at significantly higher than GAMA’s, which Taylor et al. (2015) argues arises because SDSS employs model magnitudes.
Figure 1 shows, first and foremost, that Mufasa predicts a red sequence whose slope, amplitude, and scatter is in reasonable agreement with observations. This is already a substantial achievement. Most cosmological hydrodynamic simulations have found it difficult to produce a sufficiently steep red sequence slope (e.g. Gabor & Davé, 2010, 2012; Trayford et al., 2015, 2016), and consequently fail to produce massive galaxies that are sufficiently red. Gabor & Davé (2012) investigated this discrepancy and showed that imposing a new stellar mass-stellar metallicity () relation that was steeper than directly predicted in their simulations could resolve this discrepancy, but their simulations did not do so self-consistently, only in post-processing. That Mufasa self-consistently reproduces the observed red sequence slope fairly well is an important success, although it still does so within the context of an ad hoc model for quenching.
To better understand what drives the slope, we now examine the various colour codings. In the upper left, we see that galaxies along the red sequence have quite low sSFR as expected, and that the sSFR increases steadily towards bluer colours. There are some bluer low- galaxies with very low sSFR, which are typically satellite galaxies whose instantaneous SFR is zero but still underwent some fairly recent star formation.
At high masses, we see a steady decline of sSFR even among the blue cloud galaxies, until the entire population blends into the green valley and then red sequence. This gradual transition to the red sequence was noted in Schawinski et al. (2014) and has been interpreted that the green valley is traversed slowly by massive quenching galaxies. Indeed, our quenching model implicitly assumes this to be true, as we have no “rapid” quenching mode associated with mergers, only “slow” quenching associated with shutting off accretion in massive galaxies. We will examine the evolution onto the red sequence in §3.4.
The upper right panel shows the CSMD colour-coded by stellar metallicity. Here there is a clear trend that more massive galaxies are more metal rich, except perhaps at . Notice that the bands in metallicity are mostly vertically demarcated, which indicates that galaxies at a given tend to have the same stellar metallicity regardless of whether they are star-forming or quenched. More subtly, it is seen that the bands have a slight tilt such that galaxies at a given metallicity tend to be slightly more massive in the red sequence. Again, this is consistent with slow quenching where most of the stars form early on, then the galaxy is gradually quenched which adds a small amount of high-metallicity stars but mostly just makes the galaxy redder. In principle, the slope of these bands is thus a measure of the slow quenching timescale.
Moving to the lower left panel, we now see galaxies colour-coded by median stellar age, i.e. the time back to when 50% of the stars that ended up in this galaxy were formed. As expected, blue cloud galaxies are fairly young with ages Gyr, while green valley galaxies are Gyr old, and red sequence galaxies are Gyr old. Interestingly, the bands in age here strictly follow the galaxy colours, modulo the overall slope. Hence the red sequence itself is not uniformly very old (i.e. Gyr), nor does it show a significant age dependence with .
The lower right panel shows the colour-coding by extinction () as computed by Loser. Unsurprisingly, the extinction is quite low in massive galaxies that have only hot gas, as well in low- galaxies, while the extinction is maximised at in massive star-forming galaxies. Mufasa does not produce very high extinction galaxies such as ultraluminous infrared galaxies (ULIRGs) because its kiloparsec-scale resolution does not allow mergers to concentrate high amounts of gas and dust into a sub-kpc region as observed for ULIRGs. This means that we may be missing a population of very highl extincted starburst galaxies, which will likely be increasingly important to higher redshifts.
In summary, Mufasa produces a red sequence with a slope and amplitude in general agreement with observations. The slope agreement obtained without any post-processing adjustment is particularly notable since it has been difficult to achieve in simulations. At a given , galaxies show strong trends in colour with sSFR, age, and , but little trend with ; instead, is strongly correlated with mass. This gives us clues as to what is driving the slope of the red sequence, which is what we explore next.
3.2 Colour histograms
An important feature observed in the galaxy population is that the distribution of galaxy colours shifts from predominantly blue to predominantly red galaxies as one considers more luminous or more massive subsamples. Quantitatively reproducing this trend provides a more precise test of galaxy formation models than a qualitative agreement with the red sequence. The benchmark for this test is the histogram of galaxy colours, binned by luminosity or mass (e.g. Strateva et al., 2001; Baldry et al., 2004). Here we examine such histograms in Mufasa and compare to observations.
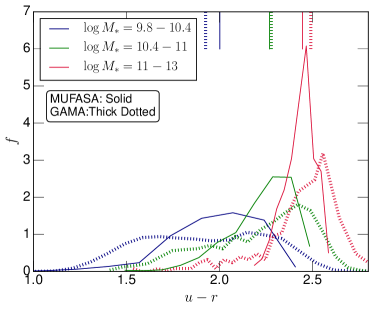
Figure 2 shows a comparison of the distribution of colours in Mufasa at versus data from the GAMA survey. We consider three mass bins, corresponding to predominantly star-forming (), transition (), and quenched () galaxies. The Mufasa results are shown as the solid lines, and corresponding results from GAMA are shown as the thick dashed lines. For GAMA, we have considered here only galaxies with in order to mitigate incompleteness at the low-mass end. The median redshift of this subsample is , so we add 0.08 to GAMA’s colours in order to account for passive evolution down to . Coloured tickmarks hanging from the upper axis indicate median colour values in those four mass bins, for Mufasa and GAMA.
The colour distributions from Mufasa in all three mass bins broadly match that from GAMA. There is a clear trend that more massive galaxies have redder colours. The median values are within 0.1 dex of the observed values, though star-forming Mufasa galaxies are not quite blue enough and quenched Mufasa galaxies are not quite red enough. The colour distributions at a given mass tend to be somewhat narrower in Mufasa than in GAMA. In part this can be explained by invoking observational measurement error in the colour, which will tend to broaden the distribution. However, we have checked that based on GAMA’s typical colour uncertainties and assuming a Gaussian error distribution, the effect of this is modest and is not enough to fully explain the observed spread. Hence it appears to be a real discrepancy that Mufasa does not quite reproduce the spread in colours at a given mass. The narrowness of the red sequence predicted by Mufasa suggests that there is some leeway allowed in terms of variations in star formation histories or metallicities compared to that predicted in this simulation, which is comforting because our current ad hoc quenching scheme is rather extreme and abrupt, so a more physically-based approach would likely result in less uniformity among the galaxy colours within the red sequence. Outside of their slightly narrow widths, the colour distributions prediced by Mufasa appear to be a reasonable match to observations.
3.3 What sets the slope of the red sequence?
Galaxies are redder if they are either older, more metal-rich, or more highly dust-reddened. Focusing on the red sequence, we have shown that the extinction is generally negligible, hence massive galaxies are redder either because they are older or more metal-rich. Owing to intrinsic difficulties in separating the colour effects of stellar ages and metallicities, it is not obvious from observations which of these is the primary driver of the red sequence slope. In this section we break down these possibilities within Mufasa to investigate how it manages to produce the observed red sequence slope.
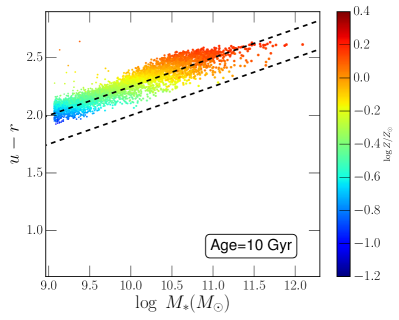
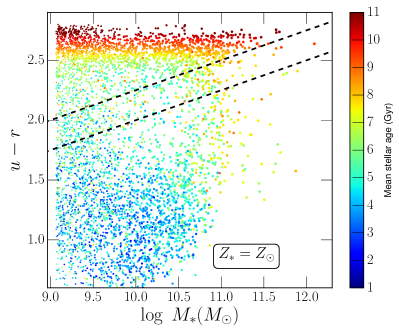
We conduct two numerical experiments on our simulated galaxies. In the first, we set the age of every star particle in our simulation to 10 Gyr before computing the magnitudes. In the second, we instead set the metallicity of every star particle to solar. We also turn off extinction here to isolate the trends in these two cases, though this does not much impact the red sequence.
Figure 3 shows the resulting CSMDs from Mufasa at in these two cases. The left panel shows the result of setting the age to 10 Gyr, with each galaxy colour-coded by metallicity. The right panel shows the converse, fixing the metallicity to solar and colour-coding by age. We show the dashed lines demarcating the green valley as before, for reference.
In the left panel, we see that setting the age to 10 Gyr results in a very tight locus in CSMD space, consistent with the red sequence; the blue cloud has disappeared. Yet the slope of the red sequence is exactly as before. There remains a strong trend of increasing metallicity with mass along the red sequence; indeed, the galaxy’s colour corresponds closely to its metallicity.
The right panel shows that setting the metallicity to solar still produces a bimodal galaxy population. Since we neglect extinction here, we obtain a much stronger bimodality at all masses with a clear lack of galaxies at , although at we still see a hint of the transition from the blue cloud to the red sequence. Hence without extinction, the green valley would be much more prominent than it is. Crucially, the colour of the galaxy is now purely dependent on age, and the red sequence has zero slope. Note also that by turning off extinction, the slope of the blue cloud disappears. Hence even blue galaxies do not show a strong gradient of age with , except once the quenching process is initiated at .
From this experiment, we conclude that in Mufasa the slope of the red sequence is entirely driven by the relationship between stellar mass and stellar metallicity. The stellar age sets the overall colour, and at a given mass a galaxy’s colour is much more sensitive to age than metallicity. Nonetheless, the lack of any trend in age with mass for either old or young galaxies means that the residual trend in , despite having a weaker impact on the colours, still fully drives the red sequence slope.
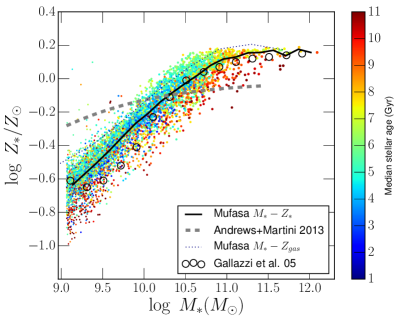
If the relationship between stellar mass and stellar metallicity is predicted to drive the red sequence slope, a natural follow-up question to ask is whether the relation predicted by Mufasa is consistent with observations. Figure 4 shows the relation for galaxies at from our Mufasa volume. A running median is shown as the solid black line. Galaxies are colour-coded by their median age. The dotted line shows the stellar mass–gas phase metallicity relation predicted in Mufasa from Davé et al. (2017). Observations of stellar metallicities from photospheric absorption lines from SDSS by Gallazzi et al. (2005) are shown as the open circles, while observations of the gas-phase metallicity from stacking SDSS spectra to obtain direct metallicity measures from Andrews & Martini (2013) are shown as the grey dashed line. Note that the metallicities quoted for Mufasa are computed from the total metal content, which is also what is quoted in the observations by Gallazzi et al. (2005), although the observed photospheric lines are most sensitive to iron; using the iron metallicity instead in our simulation gives very similar trends.
Overall, Mufasa does well at reproducing the observed SDSS relation. Crucially, there is a strong turnover at that is well reproduced, though Mufasa perhaps predicts slightly too high metallicities at the lowest masses. The critical aspect of the agreement is the shape of the relation, as this gradient in stellar metallicity with mass is what drives the red sequence slope. It is worth recalling that the simulation was run with a factor of 2 lower Type II yields than directly predicted by the Nomoto et al. (2006) yields; without this, we would have overpredicted the stellar metallicities by a roughly constant factor, though this would have had minimal impact on the shape of the relation. We did not adjust the metallicities of the stars (or gas) in Mufasa in post-processing. Also note that the simulated is mass-weighted, while the observations are from photospheric absorption lines that do not precisely correspond to a mass-weighted metallicity since they are dominated by the light from giant stars, hence the interpretation of such minor differences is better left to a more careful comparison. The fact that the red sequence slope and the relation both agree with data independently highlights the self-consistency of the explanation that the slope is driven by this relation.
It is interesting to compare to the gas-phase metallicity relation. In Mufasa, stellar metallicities trace gas-phase metallicities (dotted line) quite well, with an offset of dex owing to the fact that stars typically formed at an earlier epoch when gas metallicities were slightly lower. However, the observed gas-phase metallicities from Andrews & Martini (2013) show a completely different trend. The data from Tremonti et al. (2004, not shown) is closer to the stellar metallicities but still has a significantly shallower low-mass slope. Hence as pointed out in Davé et al. (2017), the simulated appears to be too steep compared to recent observations, in contrast to the stellar metallicities shown here that are in very good agreement with data.
It is not obvious what physical effect could cause the stellar metallicities to vary with substantially differently than gas-phase metallicities. Simulations generally find that these relations trace each other with a minor offset. Gas-phase metallicities are subject to some calibration uncertainties (Kewley & Ellison, 2008), but the different calibrators generally do not show strong mass-dependent variations.
To explore this further, we show galaxies in Figure 4 colour-coded by median stellar age. Here, it is clearly seen that galaxies with younger ages have higher stellar metallicities. This is expected, since at a given , galaxies at later epochs have higher gas-phase metallicities that form new stars (e.g. for Mufasa, see Davé et al., 2017). However, it is in some sense opposite to the trend associated with gas-phase metallicities, in which galaxies at a given mass with higher sSFR – and hence, one might reckon a younger age – actually have lower metallicities. This shows that, at some level, the stellar and gas-phase metallicities can decouple, although in the current paradigm the variations in gas-phase metallicity likely owe to a temporary phase associated with recent accretion (e.g. Davé, Finlator, & Oppenheimer, 2011) which will average out over longer timescales.
One way to reconcile these relations is to appeal to a strongly varying oxygen to iron ratio, since the gas-phase metallicities are generally driven by the oxygen abundance, while stellar metallicities are driven by the iron abundance. Interestingly, Somerville, Popping, & Trager (2015) showed that the O/Fe vs. total metallicity relation required to explain the difference between these relations is reasonably well-matched to that observed for Milky Way halo stars. However, Mufasa (like their semi-analytic models) does not naturally reproduce such a strong dependence of O/Fe on ; we will explore alpha enhancement in more detail in forthcoming work. This may indicate a failing of the timescales for chemical enrichment in Mufasa, that might produce variations in the Type Ia to Type II SN ratio.
The fact that Mufasa nicely matches the red sequence slope argues for a steep dependence in this regime. To emphasize this, we conduct another experiment: We take our original simulation, and assign every star particle a metallicity corresponding to the best-fit (gas-phase) metallicity from Andrews & Martini (2013), namely . The results of this are show in in Figure 5. The slope of the red sequence is now shallower, and is inconsistent with the red sequence slope as indicated by the dashed lines from Schawinski et al. (2014). Hence if our simulation had reproduced the Andrews & Martini (2013) relation, and the stellar metallicities had traced this relation, then it would not have predicted the correct red sequence slope.
If one takes these simulation results at face value that gas and stellar metallicities track each other, it suggests rather remarkably that it is possible to constrain the shape of the relation quite tightly using the red sequence. If however one takes the observations of (and ) at face value, it suggests that there is some missing physics in the models that results in the and relations having substantially different low-mass slopes, possibly related to the predicted alpha-to-iron ratio. The fact that the Andrews & Martini (2013) data are obtained via stacking may increase the metallicity if there is a large scatter in at low masses (Zahid et al., 2012), but the Tremonti et al. (2004) data and extensions to lower mass (Lee et al., 2006) suggest that the trend is not grossly different for individual objects.
In summary, the slope of the red sequence in Mufasa is driven by a steep relationship between stellar mass and stellar metallicity that is in agreement with independent observations of this relation. This indicates that age, and also the alpha-to-iron ratio which we have not taken into account here, are sub-dominant in setting the slope of the red sequence. The relation required to do this has a substantially different low-mass slope than observed relations, which is not straightforward to understand since Mufasa predicts the stellar and gas-phase metallicity relations should track each other with a modest offset. This could highlight some failing in the alpha-to-iron ratios predicted in the models, or could be a result of systematic effects in determining observed metallicities.
3.4 Evolutionary tracks in colour-mass space
Massive galaxies begin as star-forming, and eventually quench and move onto the red sequence. When and how this happens depends on a variety of factors, including the physical mechanisms by which galaxies shut off star formation. Given Mufasa’s success at reproducing a red sequence it is instructive to examine how the galaxies arrived into the red sequence over a range of masses and epochs, to provide insights into how the red sequence is assembled. Here we study this by examining tracks of representative individual galaxies in colour-mass space.
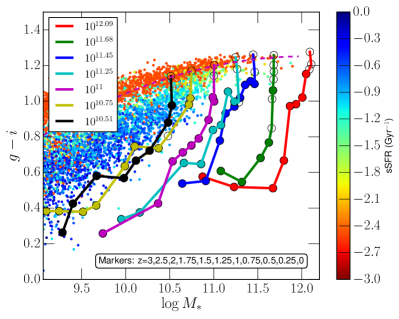
Figure 6 shows tracks in vs. for selected individual massive galaxies that end up on the red sequence at . The galaxies are randomly selected as centrals that span a range in stellar masses from at roughly 0.25 dex intervals, with the final stellar mass indicated in the legend. Progenitors are identified as the galaxy at the earlier epoch sharing the greatest amount of cold gas and stars with the final galaxy. The tracks are overplotted on the CSMD for comparison, with the full population of galaxies at colour-coded by their sSFR.
The tracks are marked by individual circles representing the locations of each galaxy in this space at , going backwards from the final location on the red sequence. Open circles indicate epochs when the sSFR for that galaxy is below Gyr-1, which is an empirical cutoff below which galaxies can be considered substantially below the star-forming main sequence; filled circles indicate epochs where the galaxy is (instantaneously) approximately on the main sequence. The magenta dashed line is a fit to the red sequence in vs. , obtained as the best fit for all galaxies with sSFR Gyr-1 and , and given by . Note that the red sequence passively evolves upwards in colour at a rate of magnitudes per unit redshift, hence galaxies at higher redshifts below the red sequence can still be red sequence members at that earlier epoch.
These tracks display some general trends with that are typical of the entire population of red sequence galaxies. Smaller galaxies tend to have more mass growth and remain star-forming down to late epochs, and only quench and move onto the red sequence fairly recently. The two lowest mass objects shown quench at , after which the mass growth stops and the colour jumps. This trend arises from the combination of having a particular halo mass quenching threshold, and the fact that the stellar mass–halo mass relation is fairly tight in these simulations. As galaxies grow via star formation, they tend to become redder owing to dust extinction, and at the lower-mass galaxies show the typical slope in colour-mass space arising from such evolution, which is roughly . Once galaxies quench, this slope becomes much steeper in CSMD space, meaning that galaxies are not growing much in mass and passively becoming redder.
The most massive galaxies tend to quench earlier, and show very little mass growth at . For instance, the most massive galaxy in the simulation (red track) undergoes a merger at that greatly increases its mass and makes it very blue temporarily, but after that grows by only about a factor of 2 all the way to , of which only 0.1 dex is from . It does have some residual star formation (the circles are filled all the way to , but this makes only a small contribution to stellar growth. Similarly, the green track also shows little mass growth after . The intermediate-mass galaxies (; magenta, cyan, blue) all quench and move onto the red sequence at .
One trend that is notable in its absence is substantial growth along the red sequence owing to dry mergers. Once galaxies are fully quenched, they grow only very slightly in mass, and in fact this can be compensated by mass loss from stellar evolution. Hence Mufasa does not yield the schematic scenario of Faber et al. (2007) in which the most massive galaxies quench early at a modest mass and grow substantially by dry mergers. There are occasionally mergers along the red sequence, but these are very rare and not represented in the sample of galaxies tracked in Figure 6.
In Mufasa, the most massive quenched galaxies grew to substantial masses at early epochs via rapid star formation, and then truncated star formation and (for the most part) stellar growth, evolving essentially vertically in the colour-mass diagram. It is curious that galaxies can reach such large masses, well above , even by . Our assumed quenching halo mass is somewhat higher at high-, e.g. at as opposed to today, but this is still not enough to allow for such massive galaxy growth to be common given the typical ratio at that epoch. Hence to get such a massive object requires that it has an anomalously high ratio that allowed it to reach a large stellar mass before exceeding the halo quenching threshold. It may be that our hot halo quenching model is less effective at quenching at early epochs because cold streams (and/or associated gas-rich galaxies) are more able to penetrate the hot halo and feed star formation in central galaxies above the nominal quenching mass (Dekel et al., 2009). This would explain why even the most massive galaxies in our volume are typically not (permanently) quenched by . We will explore these possibilities in more detail in future work.
3.5 The evolution of the red sequence
With advancing near-IR capabilities, it is becoming possible to trace the passive galaxy population back to quite early epochs (e.g. Kriek et al., 2009). This enables the possibility to probe the assembly of the red sequence over time, and ask questions such as when did the red sequence come into place? What are the properties of the first red sequence galaxies? How did the red sequence evolve into what we see today? In this section, we will explore the answers to some of these questions in Mufasa.
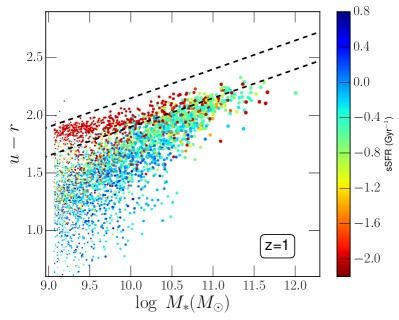
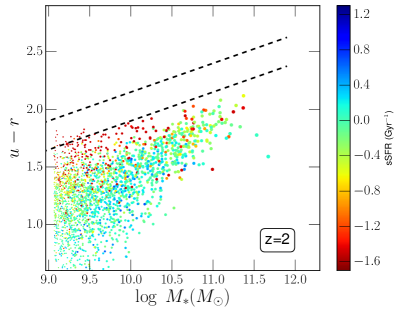
Figure 7 shows the rest-frame colour- diagrams at and , with the individual galaxies colour-coded by their specific SFR. These panels can be compared to the CSMD presented in the upper left panel of Figure 1, with the green valley demarcation (dashed lines) reproduced to aid comparison. Note that the colour bar shifts to higher sSFR at earlier epochs, such that green approximately represents the median sSFR at that epoch. The reddest points typically indicate upper limits on sSFR, as most have no ongoing star formation. The point size is scaled by as in Figure 1.
Besides the obvious fact that red sequence galaxies are bluer at earlier epochs, there are two clearly evident trends with redshift, and both are well-known. First, if we define the red sequence as comprising of galaxies with low sSFR (ie. the red points), then this becomes significantly less tight and well-defined at higher redshifts. Second, the population of massive star-forming galaxies are sufficiently reddened, and the passive galaxies are sufficiently younger, that it becomes increasingly difficult at higher redshifts to separate passive and star-forming galaxies purely in colour-mass (or colour-magnitude) space. As a result, at star-forming and quiescent galaxies with are essentially inseparable using the CSMD alone.
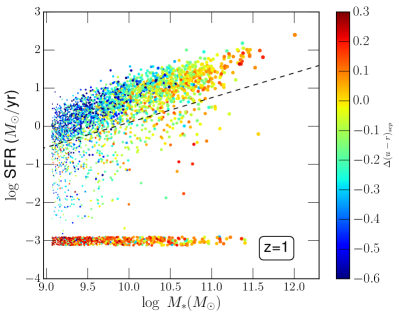
Another view of this is provided by examining galaxy colours in the plane of SFR vs. . Figure 8 shows the Mufasa galaxies in this plane at (left) and (right), colour-coded by the difference in rest-frame from the separatrix defined in §3.1 which separates the red sequence from the blue cloud in colour- space; this is labeled as in the colour bar. The dashed line shows an SFR separatrix defined by SFR; this is similar to that used by Moustakas et al. (2013) to isolate quiescent galaxies, which was somewhat conservative cut designed to identify truly passive galaxies. We note that, owing to the less rapid evolution of the main sequence in simulations as compared to observations (see e.g. Davé, Thompson, Hopkins, 2016, for a discussion), we have reduced the prefactor on the redshift evolution term compared to that in Moustakas et al. (2013). Galaxies with SFR are shown near SFR, with a small random scatter added.
Ideally, the colour separation should closely correspond to the separation in SFR, i.e. that the colour should track whether a galaxy is star-forming or quiescent. At , it is clear that the colour does a reasonable job of identifying quiescent galaxies. There are not so many red sequence galaxies (i.e. with ) above the dashed line, and the galaxies below the dashed line, particularly the massive ones, are almost uniformly identified as being on the CSMD red sequence. One could even shift up the dashed line to produce a more robust separation.
In contrast, at , the colour separation does not correspond to SFR separation nearly as well. Here, there are numerous galaxies that would be identified as red sequence systems by their colour, but are actually lying on the high- extension of the main sequence. Also, there are many galaxies with that lie below the dashed line. Hence by , the colour separation does a relatively poor job of identifying truly quiescent galaxies.
For this reason, it has become more popular to utilise colour-colour diagrams to separate these populations at higher redshifts. The UVJ diagram is particularly useful (e.g. Patel et al., 2012; Fumagalli et al., 2014), where the locus to identify quiescent galaxies is selected via a (diagonal) cut that mimics the trend of extinction, thereby keeping the dusty SFG population somewhat separated from red and dead galaxies.
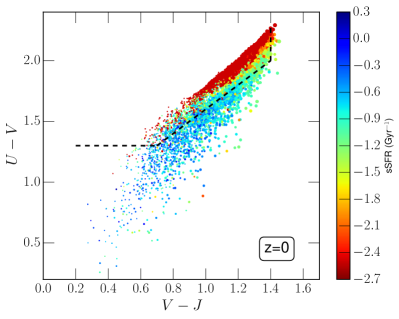
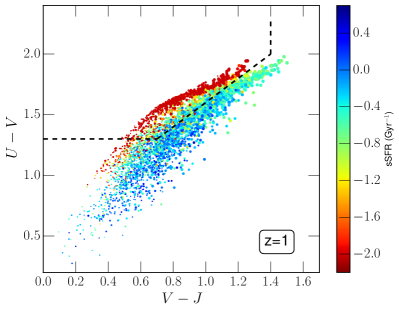
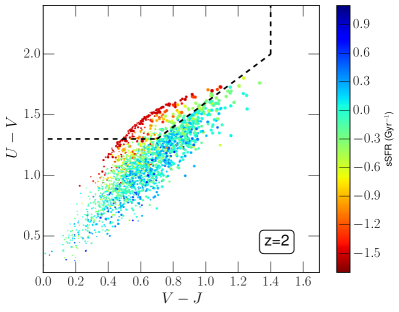
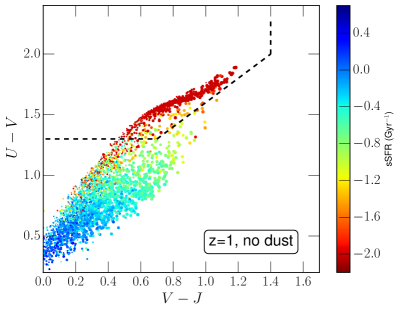
Figure 9 shows the rest-frame UVJ diagram for Mufasa galaxies at , and in the lower right at with no extinction. Galaxies are colour-coded by sSFR. A canonical separation of passive from SF galaxies is indicated by the dashed demarcation taken from Tomczak et al. (2014); galaxies above and to the left are considered passive. The locations of the two corners are and (1.4,2.0).
It is clear the UVJ diagram does a reasonably effective job of separating passive from star-forming galaxies at all redshifts. As expected, the effects of extinction as seen by comparing the bottom and top right panels is to move star-forming galaxies along the diagonal direction of the cut, which preserves the separation though there is more contamination of green star-forming galaxies within the canonical passive region. It is also evident that some low-mass red galaxies are missed by the bottom edge of this cut, increasingly so to higher redshifts; extending the diagonal separatrix to bluer colours (say ) would mitigate this without greatly increasing contamination.
It is notable that Mufasa does not produce the full range of colours seen in real galaxies at intermediate redshifts. In particular, it fails to produce highly dusty SFGs that appear towards the upper right of the UVJ diagram in observed samples. This owes at least partly to the fact that, as mentioned earlier, Mufasa does not produce very compact dusty SFGs owing to resolution limitations. Mufasa also predicts a very tight locus of passive galaxies in this space, while in observations the passive galaxies show a much greater range in colour-colour space that fills the upper left side of the UVJ diagram. It is not clear how one produces such galaxies that are extremely red in but blue in ; this could in part owe to measurement (or -correction) scatter in the observations, but it seems unlikely to fully explain this. We leave a more thorough investigation of these discrepancies to future work; for now, we note that Mufasa populates the UVJ diagram in a manner broadly consistent with observations.
In summary, massive galaxies at higher redshifts can be equivalently red owing to either dust or lack of star formation. This owed to the fact that passive galaxies at high- have not had time to redden as much, while SFGs are dustier. The UVJ colour-colour diagram effectively separates these population at in Mufasa in accord with data, with the caveat that the locus of galaxies predicted in this space does not span that observed.
3.6 What are green valley galaxies doing?
A major question in passive galaxy evolution is understanding the nature of green valley galaxies. In the simplest scenario, disk galaxies truncate their star formation abruptly, and move through the green valley in around 1 Gyr onto the red sequence. More recent work indicates that, particularly for more massive systems at low redshifts, galaxies generally proceed somewhat more slowly through the green valley (e.g. Schawinski et al., 2014; Hahn et al., 2015; Pacifici et al., 2016; Pandya et al., 2017) with quenching timescales of or more. This favours more gradual starvation-related quenching processes, which is also qualitatively consistent with the prevalence of passive disks. Here, we examine the fate of galaxies that are in the green valley from , to quantitatively assess the diversity of their fates.
To select green valley galaxies, we consider objects at that have stellar masses between , that lie in the range of rest-frame colours given by . This colour range is parallel to the green valley demarcation from Schawinski et al. (2014), but shifted down in colour to account for passive evolution and narrowed somewhat to isolate true green valley objects. We then follow them to subsequent redshifts by determining their primary descendant (i.e. the one containing the largest fraction of common stars). We also require that the primary descendant have the galaxy as its most massive progenitor; this de-selects small galaxies that would show large jumps in mass because they merged into larger systems. We find approximately 400 such galaxies at in our volume, which will be the sample we consider.
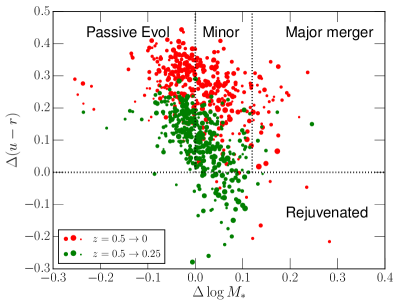
Figure 10 shows the change in stellar mass () versus change in rest-frame colour () from (green points; 2.16 Gyr) and (red points; 5.19 Gyr) for our green valley sample. We have subdivided this space into various regions. When a galaxy’s colour gets bluer, we refer to this as “rejuvenation”, as significant recent star formation must have happened since in this system. The vast majority of galaxies get redder; we assume that these galaxies have negligible growth via in situ star formation. We subdivide those into galaxies that have lost mass (), which we refer to as “passive evolution” that occurs via stellar mass loss. Galaxies that grow by more than 33% are candidates for objects that have undergone major mergers; these are located in the upper right region. Note that not all of these will necessarily have undergone a major merger, as 33% growth could have occured in a series of minor mergers, hence this represents an upper limit on major merger growth. The remaining region corresponds to galaxies that have grown by minor merging; this is likely an underestimate of this category for the reason as above, along with the fact that even retaining the same mass requires some growth to compensate for stellar mass loss.
Rejuvenating galaxies correspond to 14% of our sample from . The fraction is significantly smaller for (2.6%), since galaxies that undergo a rejuvenation will have had a few more Gyr to become red again. This rejuvenated fraction is comparable to that seen in EAGLE (Trayford et al., 2016). Note however that most of the rejuvenated galaxies have , which would not result in rejoining the main locus of blue cloud galaxies. Hence true rejuvenation into the blue cloud is quite rare, and basically the green valley is a one-way highway to death with perhaps occasional rest stops.
The fraction of galaxies that may have undergone major dry mergers is likewise relatively small. From , only 1.2% of green valley galaxies undergo growth corresponding to a major merger. For the fraction is 8%, but a larger fraction of this likely owes to minor merger growth occuring along a longer time baseline. This quantifies the impression noted in §3.4 that galaxies very rarely grow by substantial amounts once they reach the red sequence; indeed, this shows that this is even true when considering galaxies that start off in the green valley. For comparison, given the main sequence sSFR of Gyr-1 corresponding to a doubling time of about 5 Gyr, star-forming galaxies will have typically doubled their stellar mass owing to in situ star formation alone from . In contrast, galaxies essentially already stop their growth once they enter the green valley.
The remaining of green sequence galaxies are roughly evenly split into either the passive evolution category where their mass decreases slightly, or the minor merger category where it increases slightly over this time period. The typical amount of reddening is from , and from .
3.7 Mass function evolution by colour
A complementary, and somewhat more stringent test of models is provided by observed galaxy stellar mass functions separated into quenched and star-forming (SF) galaxies. While the colour-magnitude diagram tests the locus of quenched vs. SF galaxies, the GSMFs test whether a model produces the correct fraction of quenched galaxies as a function of . To separate quenched from SF galaxies across redshifts, we follow Tomczak et al. (2014) and separate galaxies via the UVJ diagram. We showed in Figure 9 that this provides a reasonable separation of quenched versus SF galaxies in our simulation as well.
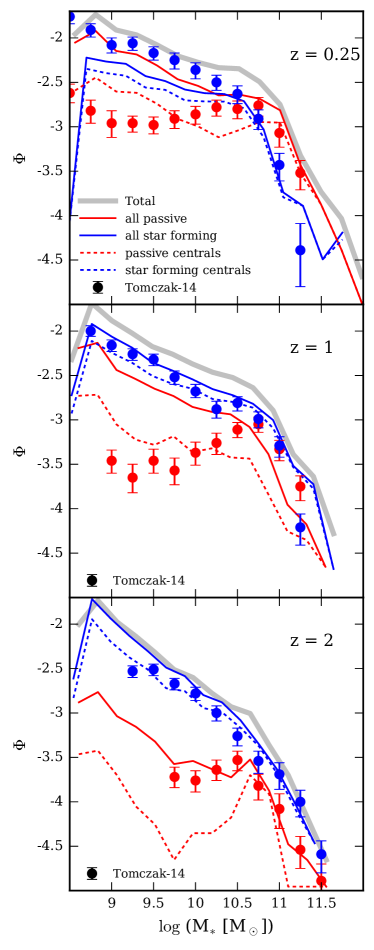
Figure 11 shows the GSMFs of quenched (red solid) and star-forming (blue dashed) galaxies at , separated via UVJ as described in the previous section, compared to the observations from Tomczak et al. (2014, points with error bars) using the same selection criterion. The total mass function is indicated in grey.
Overall, Mufasa predicts that passive galaxies dominate the massive end () at low redshift, but star-forming galaxies are more prevalent here at . At low masses, there is very rapid buildup of the quenched population from , so that by passive galaxies are the majority at essentially all masses. While qualitatively these trends are in agreement with data, the predicted trends are quantitatively quite different than observed.
Focusing on the massive () galaxies, there is generally fairly good agreement with the observed GSMF evolution. Already by we see a robust population of massive red galaxies. This is interesting because, at high redshifts, one might surmise that our purely starvation-based quenching model would have insufficient time to operate in order to quench substantial numbers of massive galaxies. Indeed, Hopkins et al. (2009) found using a semi-analytic model that radio mode alone is unable to produce enough red galaxies at high-, even when using a roughly constant halo mass threshold, and that quasar mode is needed to more rapidly quench galaxies at early epochs. Gabor & Davé (2012) also found this using a halo mass-based quenching scheme with a constant halo mass. Yet Mufasa’s feedback scheme, which is essentially pure radio mode feedback, produces good agreement with the observed passive mass function, indicating that relatively rapid quenching is still possible even with pure radio mode-like feedback. One new aspect is that we include SN-heated winds, which tends to build up hot gaseous halos more quickly, and could be responsible for helping to shut down star formation more rapidly; we will investigate this in more detail in future work.
In contrast, the low-mass end of the GSMF is highly discrepant compared to data at , with Mufasa greatly over-predicting the observed numbers, increasingly so to lower masses. Tomczak et al. (2014) claims that their completeness extends down to the smallest shown, so these galaxies should have been observed if they were present, even though identifying distant faint galaxies lacking emission lines can be challenging. There is only mild evolution observed in the low-mass passive GSMF at , whereas Mufasa predicts rapid buildup of such galaxies. Interestingly, the predictions are in good agreement with data at , but deviate substantially at later epochs, but this may partly reflect the fact that observations cannot yet probe to sufficiently low masses at this epoch to reveal the discrepancies. There is also a mild discrepancy in that Mufasa underpredicts the number of massive quenched galaxies at , though this is typically only a discrepancy.
These low-mass quenched galaxies are predominantly satellites. The dashed lines show the contribution from centrals, and at , centrals represent only of all passive galaxies. In contrast, centrals dominate star-forming galaxies at all masses and epochs. At , the number of low-mass central passive galaxies is broadly in agreement with the total number of observed red galaxies, although some of these may be “backsplash” centrals (Gabor & Davé, 2015) that were satellites whose orbits took them temporarily outside the halo, or are centrals living within the extended hot envelope of a nearby more massive halos.
In particular, our halo-based quenching model appears to be too efficient at stripping or starving gas in satellites. Recall that our model prevents cooling in hot halo gas all the way out to the virial radius, which is rather extreme. It is possible that keeping only the inner halo hot would still quench the central galaxy’s star formation sufficiently, while not quenching satellites so dramatically in the outskirts of massive halos. Empirically, it seems difficult to achieve this balance self-consistently; for instance, Illustris’s black hole feedback model tends to strongly over-evacuate gas within group-sized halos in order to shut down star formation, and yet is still insufficient to adequately suppress massive galaxy growth and star formation (Vogelsberger et al., 2014). Apparently, the Universe is remarkably effective at shutting down central galaxy star formation while leaving satellites relatively unfettered.
These results suggest that while Mufasa predicts the overall distribution of galaxy colours fairly well today, the detailed buildup of the red sequence over time, particularly in the satellite popution, is not well modeled. It is possible to improve the agreement somewhat if one varies the demarcating boundary in the UVJ diagram. For instance, moving the diagonal boundary to slightly redder by about 0.1 magnitudes would yield enough massive quenched galaxies at , but it would then exacerbate the disagreement at the low-mass end. Moving the boundary redder in would improve the agreement at the low-mass end but would still not change the fundamental character that the GSMF is sharply rising, in disagreement with observations. While one might appeal to small differences in SPS models to justify such variations, it appears that this cannot simultaneously resolve the discrepancies that are in opposite senses at the massive and low-mass ends. Simultaneously quenching both the massive central and low-mass satellite populations in accord with observations seems like a challenge for current galaxy formation models, and the current incarnation of Mufasa only succeeds at the former while failing at the latter.
3.8 Comparison with previous works
Since most cosmological galaxy formation models now include some form of quenching that is intended to yield a red and dead galaxy population, there have been various recent studies of how the red sequence assembles. This includes in semi-analytic models that predominantly create red (central) galaxies via “radio mode” (, 2006; Somerville et al., 2008) quenching, as well as hydrodynamic simulations such as Illustris and EAGLE that self-consistently grow black holes and use the resulting accretion energy to quench massive galaxies. In general, there is qualitative agreement on how the red sequence is constructed, but there are also interesting quantitative differences. In this section we compare and contrast Mufasa results to results from some of these recent models.
Trayford et al. (2015) examined the red sequence in EAGLE, including a two-component dust screen model based on Charlot & Fall (2000). Their quenching model is more self-consistent in that it directly uses black hole feedback energy that is stored up and intermittently released to heat surrounding gas, although the heating temperatures are quite high, typically K. Their success in broadly matching the numbers, ages, and colours of red and blue galaxies is encouraging and overall similar to that of Mufasa. In detail, Mufasa does somewhat better at reproducing the slope of the red sequence and the colours and numbers for systems, but worse at matching the low-mass number density which is reasonably well reproduced in EAGLE’s high-resolution simulation.
Trayford et al. (2016) followed this up by examining the evolution of the red sequence. Qualitatively, our results are fairly similar to theirs; like us, they see a separate buildup of the low-mass satellite red sequence and the massive central red sequence. They do not explicitly compare to observed red and blue mass functions, but seem to generally find fewer red satellites than Mufasa so are probably in somewhat better agreement with data there. They measure a timescale of Gyr to cross the green valley, independent of mass, which is qualitatively similar to what we find by examining individual tracks, and is generally consistent with slow attenuation of accretion as being the primary driver rather than abrupt major merger-driven evacuation. They also find a small fraction () of galaxies are “rejuvenated”, as also seen in Mufasa, although individual examples of their rejuvenation events seem to be qualitatively stronger. Their CSMD tracks also demonstrate a lack of growth once on the red sequence (except in rare cases of rejuvenation). In general, it appears that the growth of the red sequence is qualitatively similar in these two simulations that also both reproduce the evolution of the overall galaxy stellar mass function.
Semi-analytic models have long argued for the cessation of star formation in massive galaxies being driven by “radio” or “maintenance” mode (, 2006; Bower et al., 2006; Somerville et al., 2008), and have enjoyed many successes modeling galaxy evolution in general including the red sequence (Benson, 2014; Somerville & Davé, 2015; Henriquest et al., 2016). The simulations of Gabor & Davé (2012) and their subsequent work showed that such a model generally works well when implemented in a full cosmological hydrodynamic setting. However, those simulations failed to properly predict the slope of the red sequence, and also produced too few red sequence galaxies at early epochs. Mufasa utilises a similar quenching model, albeit with a mild difference being a slowly-evolving quenching mass, yet manages to alleviate these issues. A major difference relative to those earlier simulations is the treatment of star formation feedback, and Mufasa’s treatment results in much better agreement with the evolution of the overall GSMF (Davé, Thompson, Hopkins, 2016). A simple interpretation is that evolving the star-forming galaxy population correctly is a prerequisite to properly reproducing the observed red sequence.
The assembly of massive galaxies has also been a subject of much study. Overall, the concensus is that galaxies grow initially rapidly via cold accretion and in situ star formation (Kereš et al., 2005; Dekel et al., 2009; Brooks et al., 2009), and only once they get fairly massive do they grow their stellar mass substantially by merging (e.g. Hirschmann et al., 2015). This so-called two-stage galaxy formation (Oser et al., 2010) is also broadly seen in our simulations, owing to our halo mass threshold that curtails star formation in massive galaxies, leaving the primary growth channel as being via merging. Even though we predict fairly small amounts of growth once quenched, Gabor & Davé (2012) showed that the typical merger ratio and merger frequency in this type of halo quenching model is still sufficient to puff up early-type galaxies to explain their size evolution, as proposed by e.g. Naab et al. (2009); Oser et al. (2012). We expect this to be true in Mufasa as well, though we leave it for future work to check this in detail.
Overall, both SAMs and simulations seem to have converged on the idea that the primary driver of red sequence formation is the presence of a hot halo that is kept hot by (putatively) AGN feedback. Detailed models of how this happens, however, are less certain. Early models for black hole accretion and feedback in hydrodynamic simulations used Bondi accretion and spherical thermal feedback (e.g. Di Matteo, Springel, & Hernquist, 2005; Sijacki et al., 2007; Vogelsberger et al., 2013), but these models typically do not sufficiently quench massive galaxies. More recent models incorporate momentum input from jets (Dubois et al., 2012) and other heating terms such as X-ray heating (Choi et al., 2012), and have more success quenching galaxies (Choi et al., 2015) and producing morphological diversity (Dubois et al., 2016). EAGLE utilised a more sophisticated accretion model with high levels of thermal heating to achieve a reasonable red sequence (Schaye et al., 2015). Illustris-TNG has added a kinetic component of feedback at low accretion rates (Weinberger et al., 2017) to generate an improved red sequence compared to Illustris (Pillepich et al., 2017). Anglés-Alcázar et al. (2015) departed from Bondi accretion altogether to instead use a torque-limited accretion model Hopkins & Quataert (2011) coupled to kinetic jet feedback (Anglés-Alcázar et al., 2016); we are in the process of incorporating this model into Mufasa and preliminary results suggest a reasonable quenched population using this approach as well.
Hence the field is transitioning from having no self-consistent successful quenching models to now having many of them, thus highlighting the importance of careful tests against observations to further discriminate between these scenarios. It is also unclear whether these mechanisms fully cover all pathways to the red sequence. For instance, an important constraint may be whether such slow-quenching mechanisms can explain galaxies that seem to be undergoing rapid transitions such as post-starburst systems (e.g. Tremonti, Moustakas, & Diamond-Stanic, 2007; Yang et al., 2008), indicative of merger-based quenching. Clearly while there is convergence towards the broad mechanisms driving the growth of the red sequence, the details remain to be sorted out. Mufasa yields comparable or better agreement with detailed galaxy properties as compared to other current simulations, but at the cost of a comparatively ad hoc physical model for quenching. Developing a more physically self-consistent scenario for the co-evolution of black holes and galaxies, including the supernova and AGN feedback that limits the growth of each, is clearly the next major challenge in this area.
4 Summary
We present a study of galaxy colours and their evolution in the Mufasa simulation, a box cosmological hydrodynamic simulation using the Gizmo code. We obtain galaxy colours using Loser, which uses the Flexible Stellar Population Synthesis models together with line-of-sight extinction computed to individual star particles based on the integrated metal column density. Mufasa includes state of the art prescriptions for star formation and quenching feedback that yield good agreement with many observed bulk properties of galaxies such as masses, gas contents, metallicities, and star formation rates. Here we extend these studies to focus on evolution in colour-mass space, and in particular on the growth of the red sequence. Our key results are as follows:
-
•
Mufasa produces a red sequence, green valley, and blue cloud in colour-stellar mass space that are in good agreement with observations. In particular, Mufasa yields a red sequence with a slope and amplitude that is in good agreement with recent observations from GAMA.
-
•
The slope of the red sequence is driven by the stellar mass– stellar metallicity relation, which is independently in good agreement with observations. The age of the stellar population yields strong variations in colour, but this trend has no mass dependence; in particular, more massive galaxies are not predicted to have substantially older stellar populations.
-
•
Massive star-forming galaxies are increasingly dusty, causing them to smoothly merge onto the red sequence at the massive end. Thus the green valley is only distinct at low masses (), while at high masses there is no clear separation between the blue cloud and red sequence. This confusion is exacerbated at higher redshifts, where the upper end of the red sequence becomes increasingly contaminated by dusty star-formers. A UVJ diagram is effective at separating truly passive galaxies from dusty star-formers; extinction diminishes this only mildly.
-
•
Galaxies arrive on the red sequence at approximately their final mass, and grow little via dry merging once on the red sequence. More massive galaxies are quenched earlier, while galaxies traverse up the blue cloud until before quenching at . Modest rejuvenation of is seen in a minority of cases, but very rarely does this result in the galaxy fully rejoining the blue cloud.
-
•
Using a UVJ diagram to examine quenched and star-forming stellar mass functions, we find that massive galaxy evolution is reasonably well reproduced, but Mufasa grossly overproduces the number of low-mass, predominantly satellite, red galaxies at . The agreement in the number of massive red galaxies at is interesting, because it has been argued that such galaxies can only become passive at such early epochs via a rapid quenching mode owing to e.g. mergers, but Mufasa does not explicitly include such a quenching mode.
Overall, Mufasa has demonstrated a viable self-consistent scenario for the assembly of today’s red sequence, particularly for massive (central) galaxies, reproducing trends in colours and metallicities of passive galaxies. Galaxies grow at earlier epochs in a star-forming phase that is in good accord with data, and then quench via a radio mode-type feedback scheme above a slowly-evolving halo quenching mass. The detailed physical mechanisms driving the various aspects required for this success, namely feedback from star-forming galaxies and how AGN enact such maintenance mode feedback, remain uncertain. But the viability of Mufasa, at least for massive galaxies, provides a platform for further testing and investigation into the pathways to quenching.
That said, the strong overproduction of red satellites suggests that this quenching model is too strongly affecting the environment of massive galaxies, and it will require a balancing act to reduce the impact on satellites while preserving the good agreement for central galaxies in massive halos. Upcoming work will attempt to do so, as well as to implement a more physically-based quenching model that utilises the energy directly from growing black holes. In the meantime, the current iteration of Mufasa provides broad constraints for how such feedback mechanisms must operate on large scales in order to yield the observed red sequence.
Acknowledgements
The authors thank D. Anglés-Alcázar, F. Durier, K. Finlator, S. Huang, T. Naab, and N. Katz for helpful conversations and comments. The authors thank P. Hopkins for allowing us access to the Gizmo code repository. We thank T. Mendel and L. Simard for providing us their SDSS catalogs, and to E. Taylor and M. Cluver for helping us with the GAMA catalogs. RD, MR, and RJT acknowledge support from the South African Research Chairs Initiative and the South African National Research Foundation. Support for MR was also provided by the Square Kilometre Array post-graduate bursary program. RD acknowledges long-term visitor support provided by the Simons Foundation’s Centre for Computational Astrophysics, as well as the Distinguished Visitor Program at Space Telescope Science Institute, where some of this work was conducted. The Mufasa simulations were run on the Pumbaa astrophysics computing cluster hosted at the University of the Western Cape, which was generously funded by UWC’s Office of the Deputy Vice Chancellor. These simulations were run with revision e77f814 of Gizmo hosted at https://bitbucket.org/rthompson/gizmo.
References
- Andrews & Martini (2013) Andrews, B. & Martini, P. 2013, ApJ, 765, 140
- Anglés-Alcázar et al. (2015) Anglés-Alcázar, D., Özel, F., Davé, R., Katz, N., Kollmeier, J. A., Oppenheimer, B. D. 2015, 800, 127
- Anglés-Alcázar et al. (2016) Anglés-Alcázar, D., Davé, R., Faucher-Giguere, C.A., Özel, F., Hopkins, P.F. 2016, MNRAS, submitted, arXiv:1603.08007
- Asplund et al. (2009) Asplund, M., Grevesse, N., Sauval, A. J., Scott, P. 2009, ARA&A, 47, 481
- Baldry et al. (2004) Baldry, I. K., Glazebrook, K., Brinkmann, J., Ivezić, Z., Lupton, R. H., Nichol, R. C., Szalay, A. S.
- Bamford et al. (2009) Bamford, S. P. et al. 2009, MNRAS, 393, 1324
- Barnes (1992) Barnes, J.E. 1992, ApJ, 393, 484
- Benson (2014) Benson, A. J. 2014, MNRAS, 444, 2599
- Bower et al. (2006) Bower, R. G., Benson, A. J., Malbon, R., Helly, J. C., Frenk, C. S., Baugh, C. M., Cole, S., Lacey, C. G. 2006, MNRAS, 370, 645
- Brooks et al. (2009) Brooks, A. M., Governato, F., Quinn, T., Brook, C. B., Wadsley, J. 2009, ApJ, 694, 396
- Bruzual & Charlot (2003) Bruzual, G., Charlot, S. 2003, MNRAS, 344, 1000
- Bundy et al. (2010) Bundy, K. et al. 2010, ApJ, 719, 1969
- Cardelli, Clayton, & Mathis (1989) Cardelli, J. A., Clayton, G. C., Mathis, J. S. 1989, ApJ, 329, 33
- Chabrier (2003) Chabrier G., 2003, PASP, 115, 763
- Charlot & Fall (2000) Charlot, D., Fall, S. M. 2000, ApJ, 539, 718
- Choi et al. (2012) Choi, E., Ostriker, J. P., Naab, T., Johansson, P. H. 2012, ApJ, 754, 125
- Choi et al. (2015) Choi, E., Ostriker, J. P., Naab, T., Oser, L., Moster, B. P. 2015, MNRAS, 449, 4105
- Conroy (2010) Conroy, C. 2010, ASCL, 10043
- (19) Croton, D. J., et al. 2006, MNRAS, 365, 11
- De Cia et al. (2013) De Cia, A., Ledoux, C., Savaglio, S., Schady, P., Vreeswijk, P.M. 2013, A&A, 560, 88
- Dalcanton, Spergel, & Summers (1997) Dalcanton, J. J., Spergel, D. N., Summers, F. J. 1997, ApJ, 481, 659
- Davé, Finlator, & Oppenheimer (2011) Davé, R., Finlator, K. M., Oppenheimer, B. D. 2011, MNRAS, 416, 1354
- Davé, Finlator, & Oppenheimer (2012) Davé, R., Finlator, K. M., Oppenheimer, B. D. 2012, MNRAS, 421, 98
- Davé, Thompson, Hopkins (2016) Davé, R., Thompson, R. J., Hopkins, P. F. 2016, MNRAS, 462, 3265
- Davé et al. (2017) Davé, R., Rafieferantsoa, M., Thompson, R. J., Hopkins, P. F. 2017, MNRAS, in press
- Dekel et al. (2009) Dekel, A. et al. 2009, Nature, 457, 451
- Di Matteo, Springel, & Hernquist (2005) Di Matteo, T., Springel, V., Hernquist, L. 2005, Nature, 433, 604
- Dubois et al. (2012) Dubois, Y., Devriendt, J., Slyz, A., Teyssier, R. 2012, MNRAS, 420, 2662
- Dubois et al. (2016) Dubois, Y., Peirani, S., Pichon, C., Devriendt, J., Gavazzi, R., Welker, C., Volonteri, M. 2016, MNRAS, 463, 3948
- The Enzo Collaboration (2014) The Enzo Collaboration, Bryan, G. L., Norman, M. L., et al. 2014, ApJS, 211, 19
- Faber et al. (2007) Faber, S. M. et al. 2007, ApJ, 665, 265
- Fall & Efstathiou (1980) Fall, S.M., Efstathiou, G. 1980, MNRAS, 193, 189
- Faucher-Giguere, Kereš, & Ma (2009) Faucher-Giguere, C. A., Lidz, A., Zaldarriaga, M., Hernquist, L. 2009, ApJ, 703, 1416
- Feldmann, Gnedin, & Kravtsov (2012) Feldmann R., Gnedin N. Y., Kravtsov A. V., 2012, ApJ, 747, 124
- Fumagalli et al. (2014) Fumagalli, M. et al. 2014, ApJ, 796, 35
- Gabor & Davé (2010) Gabor, J. M., Davé, R. 2010, MNRAS, 407, 749
- Gabor et al. (2011) Gabor, J. M., Davé, R., Oppenheimer, B. D., Finlator, K. M. 2011, MNRAS, 417, 2676
- Gabor & Davé (2012) Gabor, J. M. & Davé, R. 2012, MNRAS, 427, 1816
- Gabor & Davé (2015) Gabor, J. M. & Davé, R. 2015, MNRAS, 447, 374
- Gallazzi et al. (2005) Gallazzi, A., Charlot, S., Brinchmann, J., White, S. D. M., Tremonti, C. A. 2005, MNRAS, 361, 41 10
- Gunawardhana et al. (2013) Gunawardhana, M. L. P. et al. 2013, MNRAS, 433, 2764
- Hahn & Abel (2011) Hahn, O., Abel, T. 2011, MNRAS, 415, 2101
- Hahn et al. (2015) Hahn, C., Blanton, M. R., Moustakas, J., Coil, A. L., Cool, R. J., Eisenstein, D. J., Skibba, R. A., Wong, K. C., Zhu, G. 2015, ApJ, 806, 162
- Henriquest et al. (2016) Henriques, B. M. B., White, S. D. M., Thomas, P. A., Angulo, R. E., Guo, Q., Lemson, G., Wang, W. 2016, MNRAS, submitted, arXiv:1611.02286
- Hirschmann et al. (2015) Hirschmann, M., Naab, T., Ostriker, J. P., Forbes, D. A., Duc, P.-A., Davé, R., Oser, L., Karabal, E. 2015, MNRAS, 449, 528
- Holwerda, Blyth, Baker (2012) Holwerda, B. W., Blyth, S.-L., Baker, A. J. 2012, IAUS v.284, p.496
- Hopkins et al. (2008) Hopkins, P.F., Hernquist, L., Cox, T.J., Kereš, D. 2008, ApJS, 175, 356
- Hopkins et al. (2009) Hopkins, P. F., Somerville, R. S., Cox, T. J., Hernquist, L., Jogee, S., Kereš, D., Ma, C.-P., Robertson, B., Stewart, K. 2009, MNRAS, 397, 802
- Hopkins & Quataert (2011) Hopkins, P. F. & Quataert, E. 2011, MNRAS, 415, 1027
- Hopkins (2015) Hopkins, P.F. 2015, MNRAS, 450, 53
- Iwamoto et al. (1999) Iwamoto, K., Brachwitz, F., Nomoto, K., Kishimoto, N., Umeda, H., Hix, W. R., Thielemann, F.-K. 1999, ApJS, 125, 439
- Kaviraj et al. (2016) Kaviraj, S., Laigle, C., Kimm, T., Devriendt, J. E. G., Dubois, Y., Pichon, C., Slyz, A., Chisari, E., Peirani, S. 2016, MNRAS, submitted, arXiv:1605.09379
- Kereš et al. (2005) Kereš, D., Katz, N., Weinberg, D. H., & Davé, R. 2005, MNRAS, 363, 2
- Kewley & Ellison (2008) Kewley, L. J. & Ellison, S. L. 2008, ApJ, 681, 1183
- Khandai et al. (2015) Khandai, N., Di Matteo, T., Croft, R., Wilkins, S., Feng, Y., Tucker, E., DeGraf, C., Liu, M.-S. 2015, MNRAS, 450, 1349
- Kim et al. (2014) Kim, J.-h., Abel, T., Agertz, O., et al. 2014, ApJS, 210, 14
- Kocevski et al. (2012) Kocevski, D. D. et al. 2012, ApJ, 744, 148
- Kriek et al. (2009) Kriek, M., van Dokkum, P. G., Franx, M., Illingworth, G. D., Magee, D. K. 2009, ApJ, 705, 71
- Krumholz, McKee, & Tumlinson (2009) Krumholz, M. R., McKee, C. F., Tumlinson, J. T. 2008, ApJ, 693, 216
- Lagos et al. (2015) Lagos, C. Del P., et al. 2015, MNRAS, 459, 2632
- Lee et al. (2006) Lee, H., Skillman, E. D., Cannon, J. M., Jackson, D. C., Gehrz, R. D., Polomski, E. F., Woodward, C. E. 2006, ApJ, 647, 970
- McNamara & Nulsen (2007) McNamara, B. R. & Nulsen, P. E. J. 2007, ARA&A, 45, 117
- Mendel et al. (2013) Mendel, J. T., Simard, L., Ellison, S. L., Patton, D. R. 2013, MNRAS, 429, 2212
- Mihos & Hernquist (1996) Mihos, J. C., Hernquist, L. 1996, ApJ, 464, 641
- Mitra, Davé, & Finlator (2015) Mitra, S., Davé, R., Finlator, K. 2015, MNRAS, 452, 1184
- Mo, Mao, & White (1998) Mo, H.J., Mao, S., White, S.D.M. 1998, MNRAS, 295, 319
- Mobasher et al. (2015) Mobasher, B. 2015, ApJ, 808, 101
- Moustakas et al. (2013) Moustakas, J. et al. 2013, ApJ, 767, 50
- Muratov et al. (2015) Muratov, A.L., Kereš, D., Faucher-Giguere, C. A., Hopkins, P. F., Quataert, E., Murray, N. 2015, MNRAS, 454, 2691
- Naab et al. (2009) Naab, T., Johansson, P. H., Ostriker, J. P. 2009, ApJL, 699, L178
- Nomoto et al. (2006) Nomoto, K., Tominaga, N., Umeda, H., Kobayashi, C., Maeda, K. 2006, NuPhA, 777, 424
- Oppenheimer & Davé (2008) Oppenheimer, B. D. & Davé, R. 2008, MNRAS, 387, 577
- Oser et al. (2010) Oser, L., Ostriker, J. P., Naab, T., Johansson, P. H., Burkert, A. 2010, ApJ, 725, 2312
- Oser et al. (2012) Oser, L., Naab, T., Ostriker, J. P., Johansson, P. H. 2012, ApJ, 744, 63
- Pacifici et al. (2016) Pacifici, C. et al. 2016, ApJ, 832, 79
- Pandya et al. (2017) Pandya, V. et al. 2017, MNRAS, submitted, arXiv:1611.03869
- Patel et al. (2012) Patel, S. G., Holden, B. P., Kelson, D. D., Franx, M., van der Wel, A., Illingworth, G. D. 2012, ApJL, 748, L27
- Peng et al. (2010) Peng, Y.-J., et al. 2010, ApJ, 721, 193
- Pillepich et al. (2017) Pillepich, A. et al. 2017, MNRAS, submitted, arXiv:1703.02970
- Planck (2015) Planck Collaboration, Ade, P. A. R., Aghanim, N., et al. 2015, arXiv:1502.01589
- Rahmati et al. (2013) Rahmati, A., Pawlik, A. H., Raičević, M., Schaye, J.
- Robertson et al. (2006) Robertson, B., Bullock, J. S., Cox, T. J., Di Matteo, T., Hernquist, L., Springel, V., Yoshida, N. 2006, ApJ, 645, 986
- Sanders & Mirabel (1996) Sanders, D. B., Mirabel, I. F. 1996, ARA&A, 34, 749
- Schawinski et al. (2011) Schawinski, K., Treister, E., Urry, C. M., Cardamone, C. N., Simmons, B., Yi, S. K. 2011, ApJL, 727, L31
- Schawinski et al. (2014) Schawinski, K. et al. 2014, MNRAS, 440, 889
- Schaye & Dalla Vecchia (2008) Schaye, J. & Dalla Vecchia, C. 2008, MNRAS, 383, 1210
- Schaye et al. (2015) Schaye, J. et al. 2015, MNRAS, 446, 521
- Sijacki et al. (2007) Sijacki, D. Springel, V., Di Matteo, T., Hernquist, L. 2007, MNRAS, 380, 877
- Sijacki et al. (2015) Sijacki, D., Vogelsberger, M., Genel, S., Springel, V., Torrey, P., Snyder, G. F., Nelson, D., Hernquist, L. 2015, MNRAS, 452, 575
- Simard et al. (2011) Simard, L., Mendel, J. T., Patton, D. R., Ellison, S. L., McConnachie, A. W. 2011, ApJS, 196, 11
- Somerville et al. (2008) Somerville, R. S., Hopkins, P. F., Cox, T. J., Robertson, B. E., Hernquist, L. 2008, MNRAS, 391, 481
- Somerville & Davé (2015) Somerville, R. S., Davé, R. 2015, ARA&A, 53, 51
- Somerville, Popping, & Trager (2015) Somerville, R. S., Popping, G., Trager, S. C. 2015, MNRAS, 453, 4337
- Springel (2005) Springel, V. 2005, MNRAS, 364, 1105
- Strateva et al. (2001) Strateva, I. et al. 2001, AJ, 122, 1861
- Taylor et al. (2015) Taylor, E. N. et al. 2015, MNRAS, 446, 2144
- Thompson (2015) Thompson, R. 2015, ASCL, 1502, 12
- Tomczak et al. (2014) Tomczak, A. R. et al. 2014, ApJ, 783, 85
- Trayford et al. (2015) Trayford, J. W. et al. 2015, MNRAS, 452, 2879
- Trayford et al. (2016) Trayford, J. W., Theuns, T., Bower, R. G., Crain, R. A., Lagos, C. del P., Schaller, M., Schaye, J. 2016, MNRAS, 360, 3925
- Tremonti et al. (2004) Tremonti, C. A. et al. 2004, ApJ, 613, 898
- Tremonti, Moustakas, & Diamond-Stanic (2007) Tremonti, C. A., Moustakas, J., Diamond-Stanic, A. M. 2007, ApJL, 663, L77
- van der Wel et al. (2009) van der Wel, A., Rix, H.-W., Holden, B. P., Bell, E. F., Robaina, A. R. 2009, ApJL, 706, L120
- Vogelsberger et al. (2013) Vogelsberger, M., Genel, S., Sijacki, D., Torrey, P., Springel, V., Hernquist, L. 2013, MNRAS, 436, 3031
- Vogelsberger et al. (2014) Vogelsberger, M., Genel, S., Springel, V., Torrey, P., Sijacki, D., Xu, D., Snyder, G., Nelson, D., Hernquist, L. 2014, MNRAS, 444, 1518
- Watson (2011) Watson, D. 2011, A&A, 533, 16
- Weinberger et al. (2017) Weinberger, R. et al. 2017, MNRAS, 465, 3291
- Yang et al. (2008) Yang, Y., Zabludoff, A. I., Zaritsky, D., Mihos, J. C. 2008, ApJ, 688, 945
- Zahid et al. (2012) Zahid, H. J., Bresolin, F., Kewley, L. J., Coil, A. L., Davé, R. 2012, ApJ, 750, 120