Characterization of amylin-induced calcium dysregulation in rat ventricular cardiomyocytes
2 Department of Family & Community Nursing, University of North Carolina - Greensburo, Greensburo, NC, USA
3 Department of Pharmacology and Nutritional Sciences, University of Kentucky, Lexington, KY, USA 40506
)
Abstract
Hyperamylinemia, a condition characterized by above-normal blood levels of the pancreas-derived peptide amylin, accompanies obesity and precedes type II diabetes. Human amylin oligomerizes easily and amylin oligomers deposit in the pancreas (1), brain (2), and heart (3), where they have been associated with calcium dysregulation. In the heart, accumulating evidence suggests that human amylin oligomers form modestly cation-selective (4, 5), voltage-dependent ion channels that embed in the cell sarcolemma (SL). The oligomers increase membrane conductance in a dose-dependent manner (5), which is correlated with elevated cytosolic Ca2+. These effects can be reversed by pharmacologically disrupting amylin oligomerization (6). These findings motivated our core hypothesis that non-selective inward Ca2+ conduction afforded by human amylin oligomers increase cytosolic and sarcoplasmic reticulum (SR) Ca2+ load, which thereby magnifies intracellular Ca2+ transients. Questions remain however regarding the mechanism of amylin-induced Ca2+ dysregulation, including whether enhanced SL Ca2+ influx is sufficient to elevate cytosolic Ca2+ load (7), and if so, how might amplified Ca2+ transients perturb Ca2+-dependent cardiac pathways. To investigate these questions, we modified a computational model of cardiomyocytes Ca2+ signaling to reflect experimentally-measured changes in SL membrane permeation and decreased Sarcoplasmic/endoplasmic reticulum calcium ATPase (SERCA) function stemming from acute and transgenic human amylin peptide exposure. With this model, we confirmed the hypothesis that increasing SL permeation alone was sufficient to enhance Ca2+ transient amplitudes without recruitment of prominent SL-bound Ca2+ transporters, such as the L-type Ca2+. Our model indicated that amplified cytosolic transients are driven by increased Ca2+ loading of the sarcoplasmic reticulum and may contribute to the Ca2+-dependent activation of calmodulin. These findings suggest that increased membrane permeation induced by deposition of amylin oligomers contributes to Ca2+ dysregulation in pre-diabetes.
Introduction
Amylin, a 3.9 kilodalton peptide produced by the pancreatic cells (8), is secreted along with insulin into the blood stream (9). Increased circulation of human amylin peptide preceding the onset of type II diabetes has been correlated with amylin deposits in the heart (10). These deposits have been shown to induce diastolic dysfunction (7), hypertrophy, and dilation (6). While the amylin peptide in humans is amyloidogenic, that is, it polymerizes into amyloid-like fibrils, rodents secret a non-amyloidogenic form of amylin that does not accumulate in cells or tissue. However, rodents expressing human amylin in the pancreatic cells develop late onset type-2 diabetes (1, 10). While studies correlating human amylin depositing with the onset of pathological states typical of diabetic cardiomyopathy (11) are beginning to emerge (3), molecular mechanisms linking amylin insult with cellular dysfunction remain poorly understood. Gaining momentum, however, is the notion that amylin oligomerization in cardiac tissue may disrupt normal calcium homeostasis (7), stemming from its modestly cation-selective conductance properties. (4, 5, 12). While this conductance is small relative to predominant sarcolemma (SL) Ca2+ currents including the LCC and Na+/Ca2+ exchanger (NCX), it nevertheless exhibits largely unexplained effects on perturbing intracellular Ca2+ signals and recruiting Ca2+-dependent pathways associated with pathological, hypertrophic remodeling (13).
To motivate the interrelationship between amylin and potential Ca2+ dysregulation in the heart, we first summarize key aspects of cardiac Ca2+ signaling. In the healthy heart, the Ca2+-dependent excitation-contraction (EC) coupling cycle begins with a depolarizing action potential (AP) that modulates SL Ca2+ fluxes, including the L-type calcium channel (LCC), Na+/Ca2+ exchanger (NCX), and sarcolemmal Ca2+ leak (14). Ca2+ entry via LCC and NCX triggers (15) sarcoplasmic reticulum (SR)Ca2+ release via RyRs, leading to a rapid increase in intracellular Ca2+(Ca2+ transient) that ultimately activates and regulates competent myocyte contraction (14). The cycle completes as SR Ca2+ uptake via the Sarcoplasmic/endoplasmic reticulum calcium ATPase (SERCA), as well sarcolemmal Ca2+ extrusion via NCX and the sarcolemmal Ca2+ ATPase, collectively restore diastolic Ca2+ levels. Recently, we reported that this process was perturbed in rats transgenic for human amylin (human amylin transgenic (HIP)), as well as in isolated cardiomyocytes acutely exposed to the peptide (acute amylin-exposed rats (+Amylin)) (7). In particular, both rat models exhibited larger cytosolic Ca2+ transients and faster rates of sarcolemmal Ca2+ leak than control. Furthermore, we found that in HIP rats, SERCA function was impaired and hypertrophic remodeling associated Nuclear factor of activated T-cells (NFAT)/Histone deacetylases (HDAC) pathways were activated; both properties are strongly associated with the progression toward heart failure (13). In this study, therefore, we seek to clarify mechanisms by which human amylin-induced sarcolemmal Ca2+ leak leads to Ca2+ dysregulation in pre-diabetes and ultimately the activation of hypertrophic remodeling pathways.
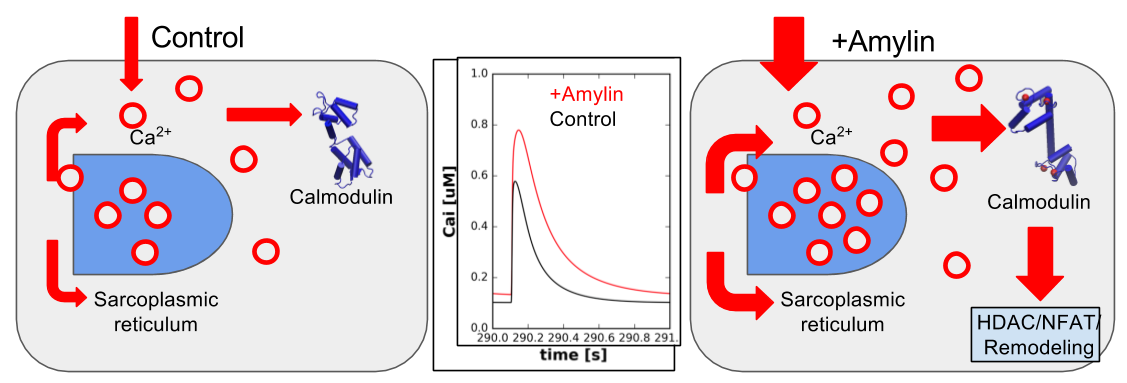
Cardiac computational models are particularly well-suited for exploring intracellular mechanisms of Ca2+ signaling and their dysregulation in cardiac tissue (16, 17, 18, 19). We extended one such model, the Shannon-Bers model of ventricular myocyte Ca2+ dynamics (20), to unravel the influence of amylin in the HIP phenotype. Specifically, the revised model reflects our experimentally-measured changes in SL membrane Ca2+ permeation as well as decreased SERCA function consistent with acutely-exposed and transgenic human amylin rats (7). We find that increased Ca2+ background leak conductance via amylin was sufficient to reproduce enhanced Ca2+ transients previously measured in HIP rats (7). These simulations implicate increased SR loading as the primary mechanism of increasing Ca2+ transient amplitude for the amylin phenotypes, which in turn elevates cytosolic Ca2+ load. Finally, we show higher propensities for calmodulin (CaM) activation under conditions of elevated diastolic Ca2+, which we speculate may trigger the CaM-dependent NFAT remodeling pathway. These findings lead to our hypothesized model of amylin-induced Ca2+dysregulation summarized in Fig. 1.
Materials and Methods
Experimental animals
N=12 Sprague-Dawley rats were used in this study. All animal experiments were performed conform to the NIH guide for the care and use of laboratory animals and were approved by the Institutional Animal Care and Use Committee at University of Kentucky. Ventricular myocytes were isolated by perfusion with collagenase on a gravity-driven Langendorff apparatus (7).
Measurements of Ca2+ transients and sarcolemmal Na+/Ca2+ leak
Myocytes were plated on laminin-coated coverslips, mounted on the stage of a fluorescence microscope and loaded with Fluo4-AM (10 mol/L, for 25 min). Ca2+transients were elicited by stimulation with external electrodes at a frequency of 1 Hz. The passive trans-sarcolemmal Ca2+ leak was measured as the initial rate of Ca2+ decline upon reducing external Ca2+from 1 to 0 mM. In these experiments, Ca2+fluxes to and from the SR were blocked by pre-treating the cells with 10 M thapsigargin for 10 min whereas the NCX and sarcolemmal Ca2+- ATPase were abolished by using 0 Na+/0 Ca2+solution (Na+ replaced with Li+) and adding 20 M carboxyeosin, respectively. The outward sarcolemmal Ca2+ leak was measured in the absence and presence of the membrane sealant poloxamer 188, which is a surfactant that stabilizes lipid bilayers and thus protects against amylin-induced sarcolemmal damage.
Na+ influx was measured as the initial rate of the increase in intracellular Na+ concentration ([Na+]i) immediately following Na+/K+ atpase (NKA) pump inhibition with 10 mM ouabain. As described previously (21), [Na+]i was measured using the fluorescent indicator SBFI (TefLabs). The SBFI ratio was calibrated at the end of each experiment using divalent-free solutions with 0, 10, or 20 mmol/L of extracellular Na+ in the presence of 10 mol/L gramicidin and 100 mol/L strophanthidin.
L-type Ca2+ current measurement
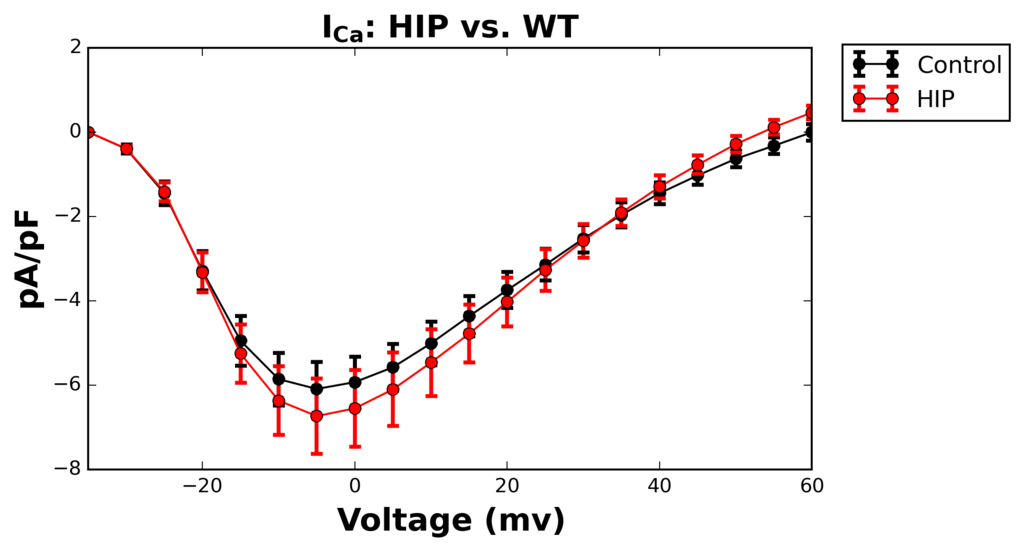
L-type Ca2+current () was measured under voltage-clamp in whole cell configuration. was determined as the nifedipine-sensitive current recorded during depolarization steps from -40 mV (where the cell was held for 50 ms to inactivate Na+ channels), to -35 to +60 mV. The patch-pipette was filled with a solution containing (in mM) 125 Cs-methanesulfonate, 16.5 TEA-Cl, 1 \chMgCl2, 10 EGTA, 3.9 \chCaCl2 , 5 Hepes, and 5 Mg-ATP (pH=7.2). The external solution contained (in mM) 150 NMDG, 1 \chCaCl2 , 5 4-aminopyridine, 1 \chMgCl2, 10 Hepes, and 10 glucose (pH=7.4).
Simulation and analysis protocols
Summary of Shannon-Bers-Morotti rat Ca2+ handling model
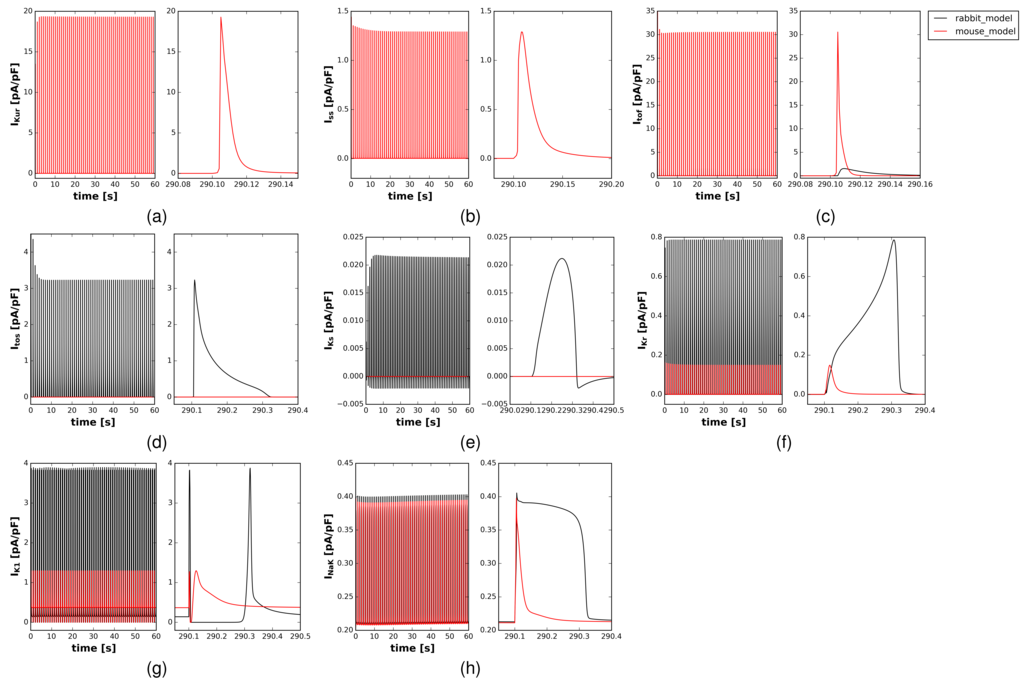
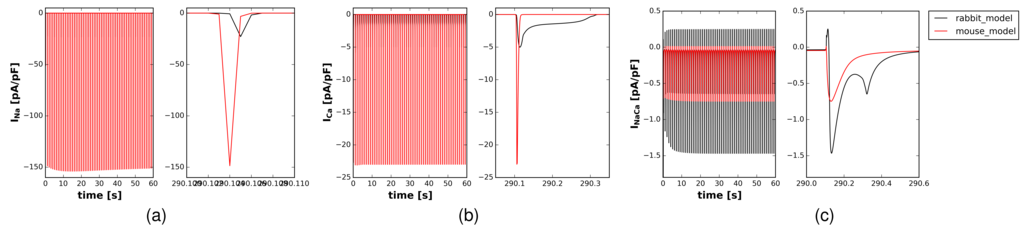
To examine the relationship between increased sarcolemmal Ca2+ entry and elevated Ca2+ transients reported in rats (7), we adapted a rabbit ventricular myocyte model of Ca2+ signaling to reflect handling terms specific to mice and rats. Our choice of a mouse model was based on the initial lack of rat-specific Ca2+ handling models available in the literature and the similar rates of Ca2+ relaxation via SERCA, NCX, and other minor contributions (sarcolemmal) shared by rat and mice (92, 8 and 1%, versus 90.3, 9.2 and 0.5%, respectively) shared by both species (22, 23). Mouse-specific parameter and potassium current changes were introduced into the Shannon-Bers rabbit cardiomyocyte Ca2+ model (20) according to Morotti et al.. (24) (summarized in Supplement). The resulting model is hereafter referred to as the Shannon-Bers-Morroti (SBM) model. Model equations, ’state’ names, current names and initial conditions are provided in the supplement. As noted in (24), four predominant changes in potassium channels were included: 1) the transient outward potassium current expression for rabbits was replaced with fast component () for mice, 2) the slowing activating delayed rectifier current was substituted with a slowly inactivating delayed rectifier current (), 3) a non-inactivating potassium steady-state current () was added 4) the inward rectifier potassium current () was reduced. Other distinctions between the two species are the elevated intracellular sodium load and sodium ion current in murine versus rabbit species, which we optimized to match experimental data collected in this study. In Fig. S1-Fig. S3, we compare metrics such as Ca2+ transients, action potentials, potassium currents and prominent Na+/Ca2+ currents for rabbits versus mice, for which we report excellent agreement with data from Morotti et al.. (24).
To reflect increased SL leak due to amylin in HIP rats, we modulated the Shannon-Bers leak model described by
| (1) |
where represents leak density, is the max conductance for Ca2+ , is voltage and is the Nernst potential of ion . In rats acutely exposed to amylin (+Amylin), amylin oligomer deposition was correlated with a roughly 70% increased rate of Ca2+ leak in hypotonic solution (see Figure 3D of Despa et al.(7)). We accordingly increased for Ca2+ by a commensurate amount (see Table S3) to reflect this observation. Although amylin pores exhibit poor cation selectivity (5), we maintained for Na+ at baseline values, given that we observed no detectable change in Na+ load (Fig. 2). Furthermore, though we assume that the increased Ca2+ influx scaled with applied voltage (), given the short duration of the action potential this approximation did not significantly affect the model. The magnitude of enhanced SL Ca2+ leak, , is depicted in Fig. S4. Lastly, we fit our model outputs Na+ transients and values to mimic the rat using a genetic algorithm (GA) (detailed in the Supplement) that varied the parameters of the NKA current and the SERCA Vmax values respectively. This fitting was necessary to capture Ca2+ and Na+ transients reported in the HIP, +Amylin and an ’activated LCC’ condition that mimics enhanced SL Ca2+ leak. We compare our predicted normalized Ca2+ transients to control data in Fig. LABEL:figshort: and report excellent agreement. For our +Amylin configuration, the GA increased NKA Vmax by 14% to maintain normal Na+ levels (see Table S3), which concurs with a study indicating agonized NKA function in skeletal muscle (25). For the human amylin transgenic model (HIP), it was observed that Ca2+ transient decay time increased by nearly 30% relative to control (7)), for which the GA determined a reduction in SERCA Vmax by 47% was necessary. Lastly, we introduced an ’LCC’ configuration for which Ca2+ permeation is increased, to elucidate potential differences between Ca2+-entry via non-selective leak as opposed to via Ca2+-selective channels (see Table S3).
Numerical model of Ca2+ handling
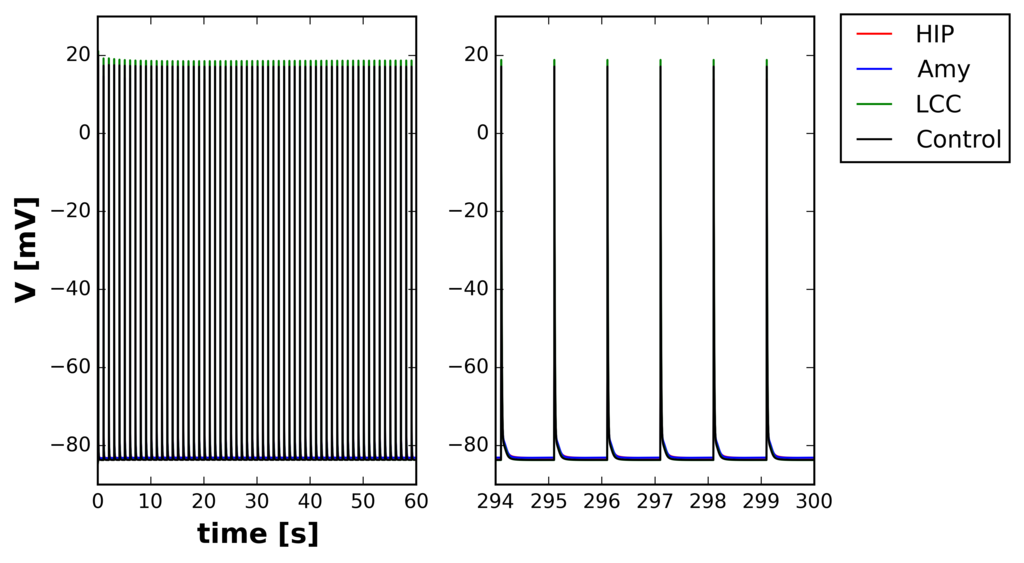
The Shannon-Bers cellML model was converted into a Python module via the Generalized ODE Translator gotran (https://bitbucket.org/johanhake/gotran). The mouse-specific alterations summarized in the previous section were implemented into the resulting module. In our numerical experiments, the SBM model was numerically integrated by the scipy function odeint, which utilizes the LSODA algorithm for stiff ordinary differential equations (26). The numerical model was integrated using a timestep of 0.1 ms for a total simulation time of up to 5 minutes. These simulations provide as output the time-dependent values of the SBM ’states’, such as intracellular Ca2+ load or the action potential, as well as ’currents’ that include major Ca2+, Na+, K+, and Cl--conducting proteins. Model fitting proceeded by a genetic algorithm (reviewed in (27)) that iteratively improved parameter values, such as LCC Ca2+ conductance, membrane leak, and NKA conductance over several generations of ’progeny’ (Fig. S18). Experimentally-measured outputs, such as Ca2+ transient decay time and amplitude, were measured for each of the progeny; those that reduced output error relative to the experimentally-measured equivalent with stored for future generations (see Sect. Genetic algorithm for fitting) for more details). To validate our implementation, we present comparisons of action potentials, intracellular Ca2+ and Na+ transients, as well as ionic currents for rabbit versus murine cardiac ventricular myocytes in Sect. Supplemental Tables, and we report good agreement. Steady-state action potentials and intracellular Ca2+ oscillations were generally observed within 6000 ms. We additionally stimulated the model at several frequencies ranging from 0.25 to 2.0 Hz, with the reference frequency at 1.0 Hz, subject to default (control) parameters as case-specific values listed in Methods. Sensitivity of Ca2+ transients to sarcolemmal leak rates and Vmax for NKA and SERCA were probed as described in Sect. Sensitivity analyses. All data processing was performed using scipy and the ipython notebook; source code will be provided at https://bitbucket.org/huskeypm/wholecell.
Analyses
To examine potential mechanisms that link increased SL Ca2+ permeation to SR-loading and elevated Ca2+ transients, we present a simple method, State Decomposition Analysis (SDA), that monitors and identifies prominent changes in key ’state’ variables (including the action potential, SR-load, channel gate probabilities among others) as well as ion channel currents, relative to control conditions. The key benefit of this approach is the automated identification of modulated EC coupling components that can motivate model refinements and additional experiments. The SDA method consists of the following steps: 1) numerically solve the time-dependent ordinary differential equations (ODE) s governing all components (the state variables) of the EC coupling model for trial and control parameter configurations 2) ’score’ the time-dependent state values according to metrics like amplitude 3) calculate percent differences between trial and control state variable scores 4) rank order states by either the percent difference with a reference state or by the amplitudes in the reference.
Results
Effects of human amylin on intracellular Ca2+ transients in rat cardiac ventricular myocytes
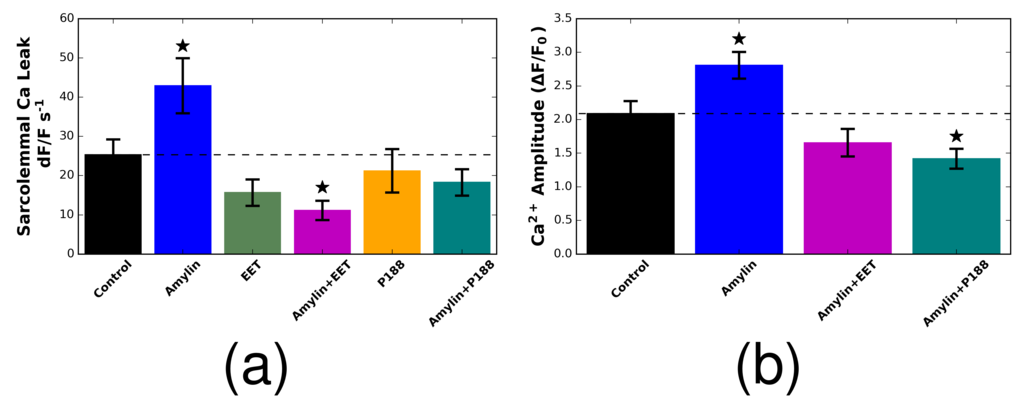
The accumulation of human amylin aggregates in rat cardiomyocyte SL was previously correlated with increased rates of sarcolemmal Ca2+ conduction and amplified Ca2+ transient amplitudes (7). Increased Ca2+ sarcolemmal conduction was originally attributed to permeation across the bilayer, as opposed to direct modulation of ion channels, based on observations of an amylin dose-dependent outward Ca2+ leak (7). This led to the hypothesis that sarcolemma-localized human amylin oligomers have the primary effect of increasing the inward Ca2+ leak, although the mechanism linking Ca2+ leak and transient amplitudes was not established. We first validate this hypothesis by measuring the effect of human amylin (50 M; 2 hours incubation) on SL Ca2+ leak and Ca2+ transient amplitude in the absence and in the presence of poloxamer 188 (P188), a surfactant that stabilizes lipid bilayers through hydrophobic interactions (28). As reported previously, human amylin significantly increased both passive SL Ca2+ leak and Ca2+ transient amplitude (Fig. 3A). When amylin was applied in the presence of P188 (50 M), however, SL Ca2+ leak and transient amplitudes were statistically comparable to control (Fig. 3). Similar behavior was observed upon co-incubation with epoxyeicosatrienoic acids (14,15-EETs; 5 M), which have anti-aggregation effects and reduce amylin deposition at the SL (6). These results support the hypothesis that amylin primarily influences myocyte Ca2+ cycling through poration of the sarcolemma.
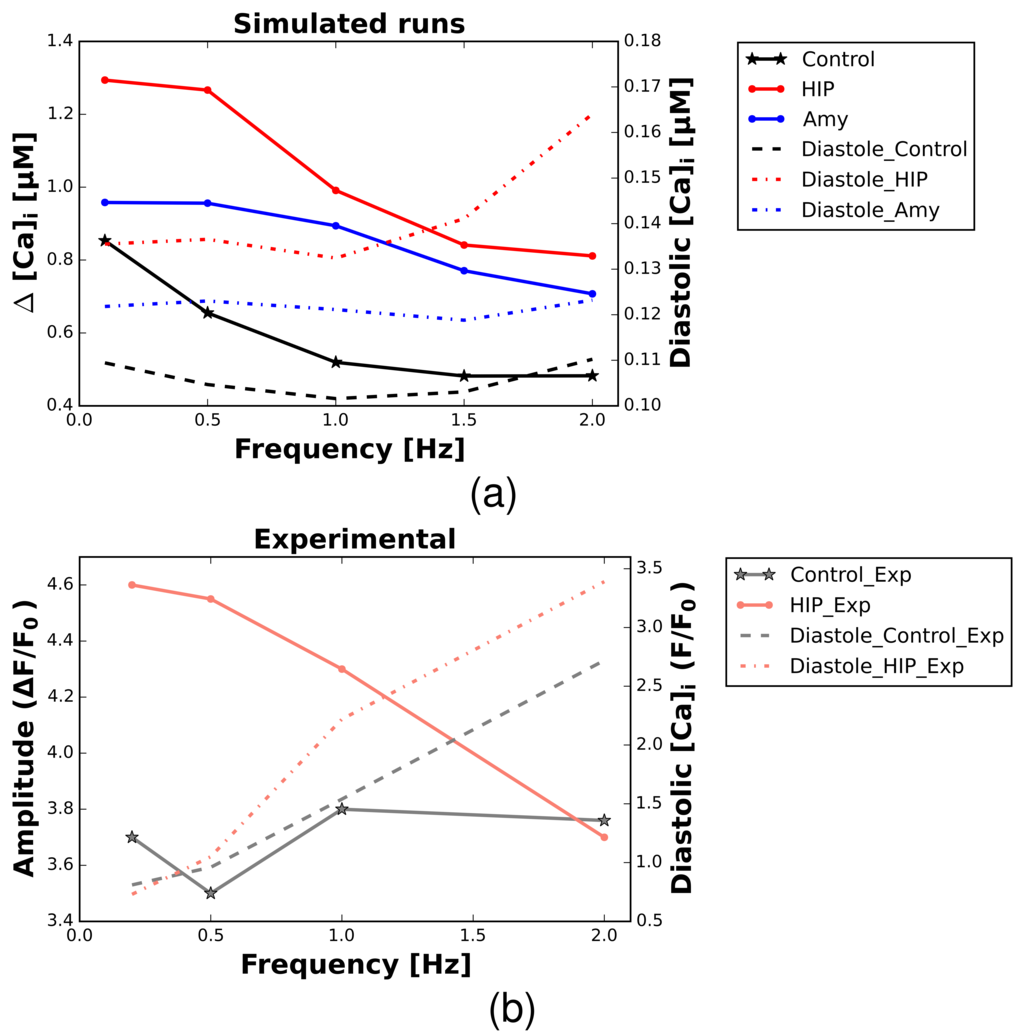
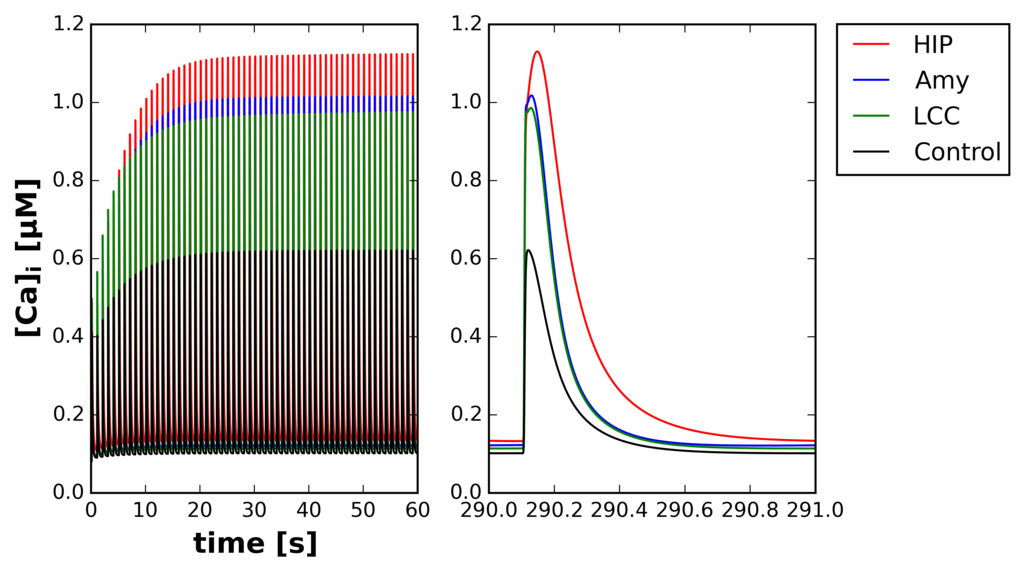
To investigate how membrane poration via human amylin leads to amplified Ca2+ transients, we numerically solved the SBM whole-cell model at 1 Hz pacing under control conditions and with enhanced SL leak (+Amylin). Our simulations confirmed that Ca2+ transients for the +Amylin configuration were 46% higher than control (Fig. 4), consistent with experiment (Fig. 3b and Fig, 3C of (7)). We further modeled the pre-diabetic (HIP) rats examined in (7) by assuming increased SL leak and decreased SERCA function. Similar to +Amylin the HIP model predicted elevated Ca2+ transient amplitudes (36% relative to control), although they were somewhat attenuated compared to the +Amylin conditions. In contrast to the +Amylin configuration, however, the HIP model presented 27% slower diastolic relaxation and a 92 % increase in diastolic intracellular Ca2+ load relative to control, as would be expected with reduced SERCA function (29). We further note that the enhancement of Ca2+ transient amplitudes for +Amylin/HIP rats relative to control diminished with increased pacing (up to 2 Hz), in accordance with experimental findings (see Fig. S6). Ca2+ transient relaxation rates remained unchanged over this range, as our model does not currently include factors governing frequency dependent acceleration of relaxation, such as the involvement of Ca2+/calmodulin-dependent protein kinase II (CaMKII) (30).
A distinctive feature of murine species is the dominant role of the SR in managing Ca2+ homeostasis, with nearly 90% of the intracellular Ca2+ transient originating from SR (14). In contrast, in higher species, sarcolemmal derived Ca2+ plays a significantly larger role; in rabbits, for instance, inward sarcolemmal Ca2+ currents account for roughly 40% of the intracellular Ca2+ transient (14). As a proof of principle, we augmented the original Shannon-Bers (SB) formulation of cardiac Ca2+ cycling in rabbits (20) with increased Ca2+ leak. In Fig. S11 , we demonstrate similar trends of increased cytosolic and SR Ca2+ load under conditions of increased sarcolemmal Ca2+ leak. ).
Effects of acute amylin-induced modulation of sarcolemmal ion handling
Cytosolic and sarcoplasmic reticulum Ca2+ load
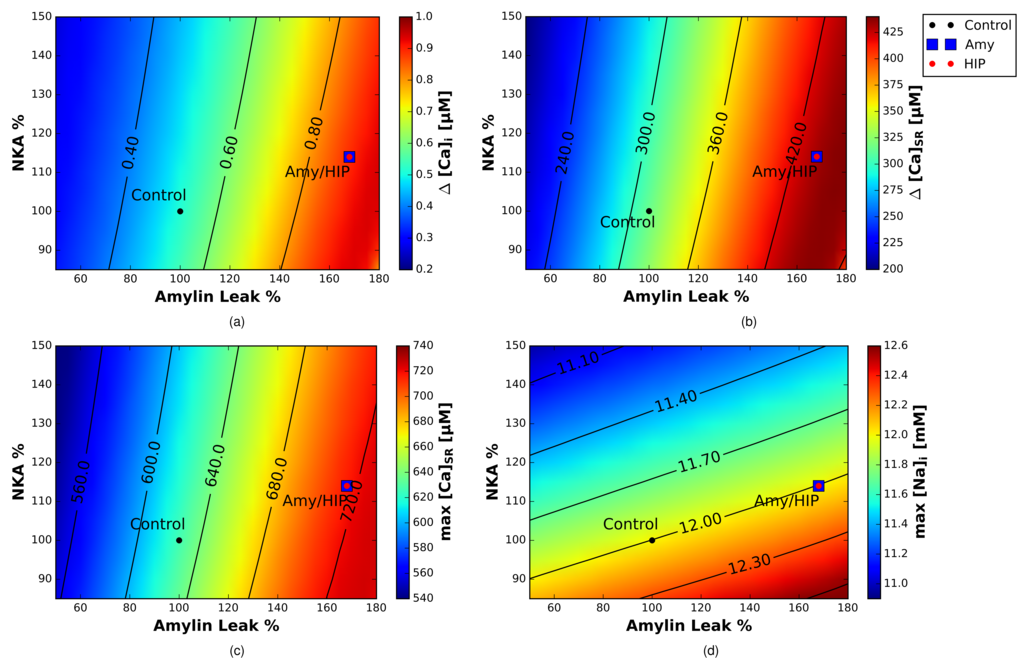
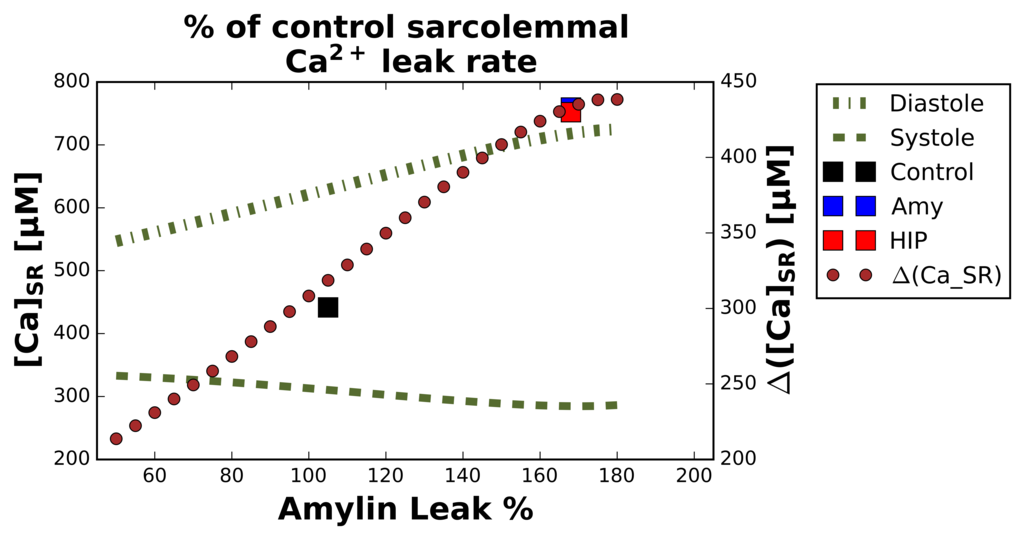
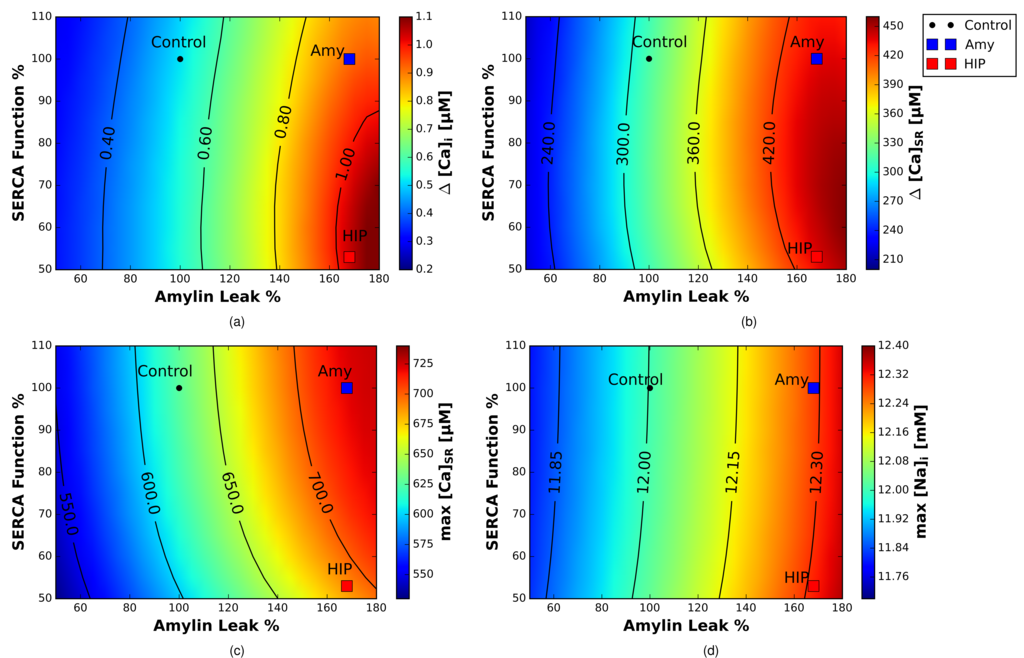
While background sarcolemmal Ca2+ leak is evidently enhanced for +Amylin and HIP, the corresponding Ca2+ current over a single beat does not contribute significantly to the total cytosol Ca2+ content. Hence, the leak alone is insufficient to directly account for the observed increase in Ca2+ amplitude for the amylin models on a beat-to-beat basis. Rather, our data indicate that the Ca2+ transients required nearly 20 seconds of pacing to reach steady state (Fig. 4), which suggests that Ca2+ transient amplification occurs through an alternative mechanism. Since the majority of the Ca2+ released on a beat-to-beat basis originates in the SR (14), we hypothesized that the increased intracellular Ca2+ transient amplitudes for the amylin rats stemmed from elevated SR Ca2+ loading owing to increased sarcolemmal Ca2+ leak. For this scenario, we would expect that Ca2+ transient amplitudes should scale proportionally with SL leak rates. Therefore, we examined how the control model responded to variations SL Ca2+ leak (Amylin Leak %), as well in SERCA function. These effects are summarized in Fig. 5a-c, for which we report predicted cytosolic Ca2+ transients (a., ), SR Ca2+ transients (b., ) and diastolic SR Ca2+ loads (c., max ). These data strongly indicate that the SR Ca2+ load is positively correlated with increasing sarcolemmal Ca2+ leak and to a lesser extent, SERCA function. More importantly, the increased sarcolemmal Ca2+ leak assumed for +Amylin and HIP relative to control largely accounted for the elevated Ca2+ transients and SR load.
In other words, SERCA appeared to play a minor role in tuning the Ca2+ transient in our amylin model, as the reduced SERCA Vmax for HIP relative to +Amylin maintained enhanced, albeit modestly reduced, Ca2+ transients and load. Instead, SERCA control the extent to which altered sarcolemmal Ca2+ leak modulates Ca2+ transient amplitude. This was most apparent as pacing rates were varied from 0.5 to 2 Hz in our model, which essentially determined the time during which SERCA could recover SR Ca2+ load following a release event. Specifically, our model predicted that amylin-induced Ca2+ transient enhancement diminished with increased pacing and nearly approached control transient amplitudes at 2 Hz (see Fig. S6). Further, the decline in transient amplitude with pacing was faster for HIP relative to +Amylin, which expectedly suggests that amylin’s inotropic effects are at least partially modulated by the efficiency of SERCA Ca2+ handling.
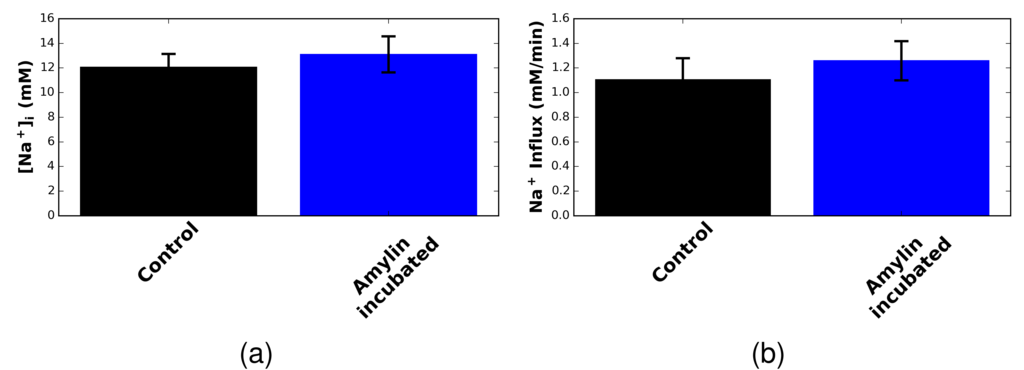
Maintenance of Na+ load in +Amylin and HIP myocytes
To determine whether amylin induced appreciable changes in cardiomyocyte Na+ handling, we measured Na+ load and influx in control and amylin-incubated myocytes following the inhibition of the NKA pump. NKA is a sarcolemma-bound ATPase that extrudes Na+ by exchanging the cation with extracellular K+, thus its inhibition would be expected to demonstrate any differences in Na+ load and influx due to +Amylin. We found that both Na+ handling metrics were indistinguishable between the control and +Amylin cells when the NKA was allowed to compensate for the Ca2+ leak (Fig. S7c). However, when we assumed NKA activity in our +Amylin model was identical to control, we found that the intracellular Na+ increased by 0.3 mM (Fig. S7c), though the predicted difference in Na+ load was likely below the limits of experimental detection. The increased Na+ load appeared to arise due to higher NCX exchange rates (Fig. 6) brought about by the elevated diastolic Ca2+ load for +Amylin. In order to maintain Na+ load at control levels for the +Amylin model, our fitting procedure revealed that the NKA current should be increased by 14%. Interestingly, it has been reported (25) that rat soleus muscle exposed to 10 amylin increased Rb cation uptake by 24% relative to control (25), which is commensurate with our predicted Vmax for maintaining cytosolic Na+ load.
To further elucidate the potential contribution of NKA exchange to Ca2+ and Na+ homeostasis, we present in Fig. S8 cytosolic and SR Ca2+ transient amplitudes as well as Na+ load as a function of sarcolemmal leak rates and NKA activity. In Fig. S8d we confirm that Na+ load decreases with increasing NKA Vmax and increases with sarcolemmal Ca2+ leak. Our model assumes amylin does not change sarcolemmal Na+ leak relative to control, therefore we attribute the positive correlation between Na+ load and sarcolemmal Ca2+ leak to NCX exchange activity. Specifically, as cytosolic Ca2+ load increases with sarcolemmal leak rates, NCX exchange of cytosolic Ca2+ with extracellular Na+ would contribute to increased intracellular Na+. Analogously, as increased NKA activity depletes cytosolic Na+, Ca2+ influx via the NCX reverse mode would be expected to decrease and thereby ultimately reduce intracellular Ca2+. Our simulated data reflect these trends for several metrics of Ca2+ transients in Fig. S8a-c, which we discuss further in the Supplement.
Ion channel activity and Ca2+ handling
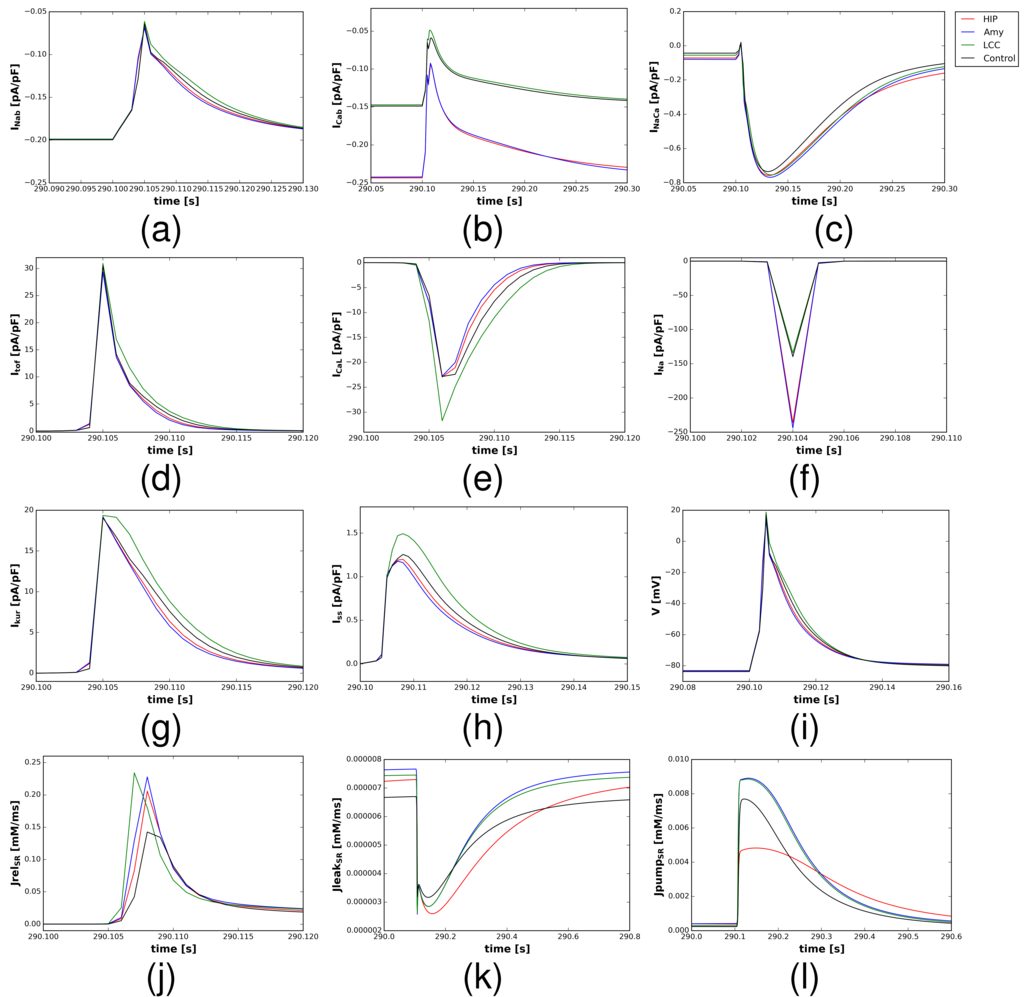
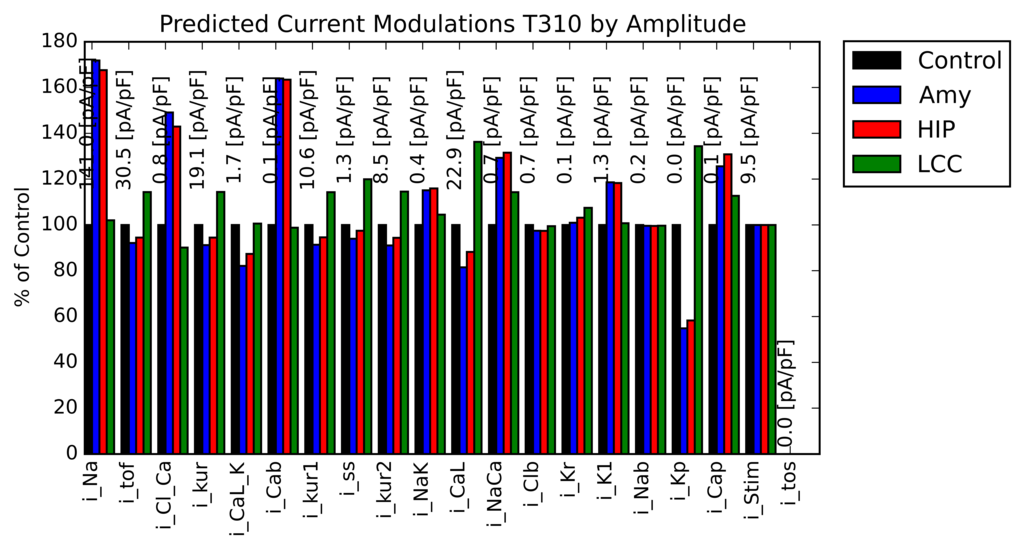
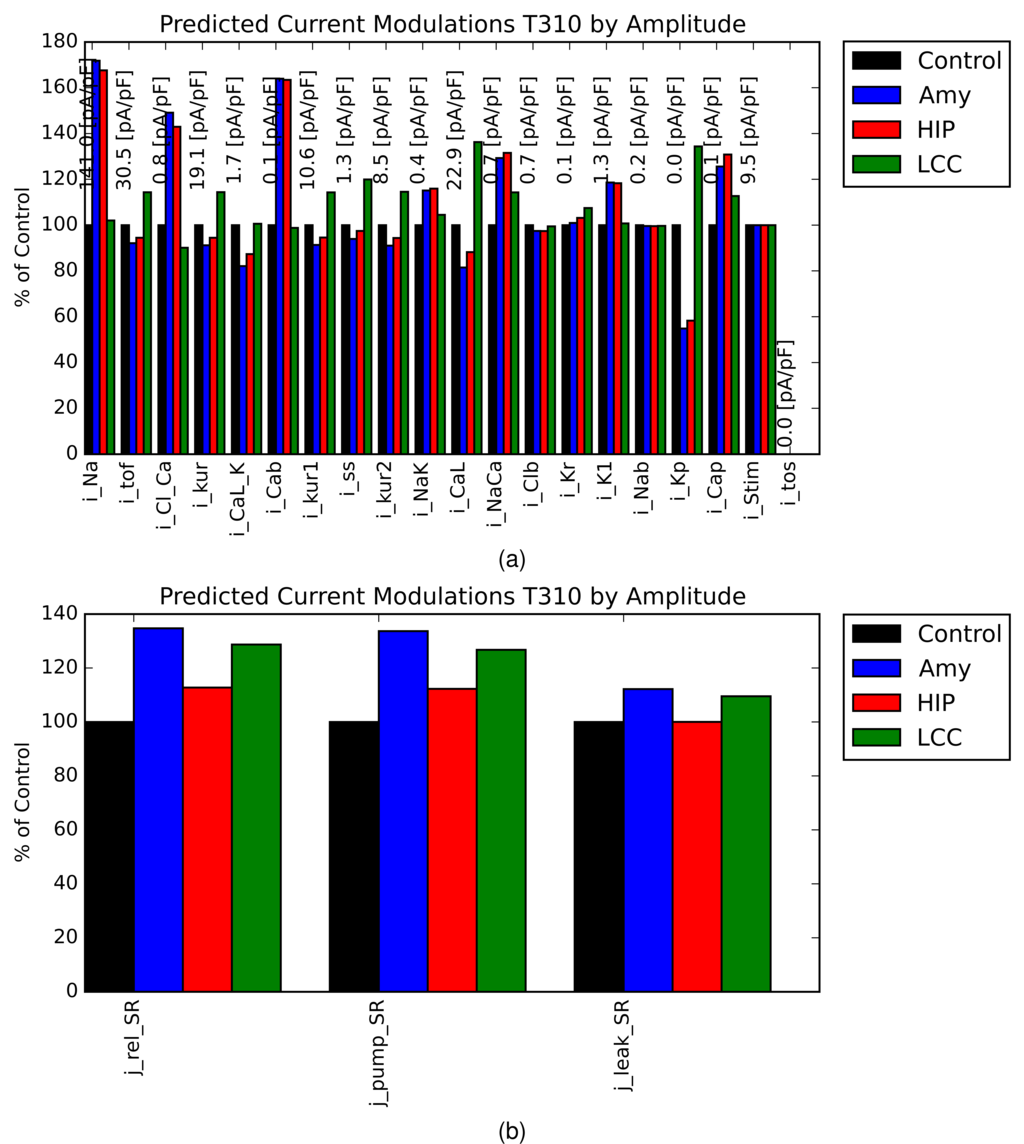
It was expected that amylin-driven increases in cytosolic and SR Ca2+ loading would culminate in the modulation of multiple downstream Ca2+-dependent signaling pathways (21). In this regard, we leveraged the computational model to systematically probe the response of its outputs, such as the activity of various Ca2+ handling components, to changes in model inputs including SL Ca2+ leak. Accordingly, we depict in Fig. 6 relative changes in all ion channel amplitudes described in the SBM model for the +Amylin and HIP configurations, ranked by their absolute magnitudes. These data expectedly reflect increased sarcolemmal Ca2+ leak () for +Amylin and HIP, as we assumed increased leak conductance parameters for both cases. Interestingly, was predicted to increase for both cases relative to control, which in principle could influence the AP upstroke velocity (31). However, in Fig. S9d we demonstrate that the AP waveform is largely unchanged in the amylin cases relative to control, thus the predicted effects on amplitude appear to be of little consequence. Beyond these currents, increased SL leak had opposing effects on the currents for the +Amylin and HIP data. For +Amylin, for instance, we observed enhanced SR release and uptake amplitudes (, and in Fig. 6) that are expected to contribute to larger cytosolic Ca2+ transients. For HIP, we found modestly higher and relative to control and +Amylin, which reflects a redistribution of sarcolemmal Ca2+ extrusion versus SR Ca2+ uptake. Similar redistributions are known to occur when SERCA function is reduced (32).
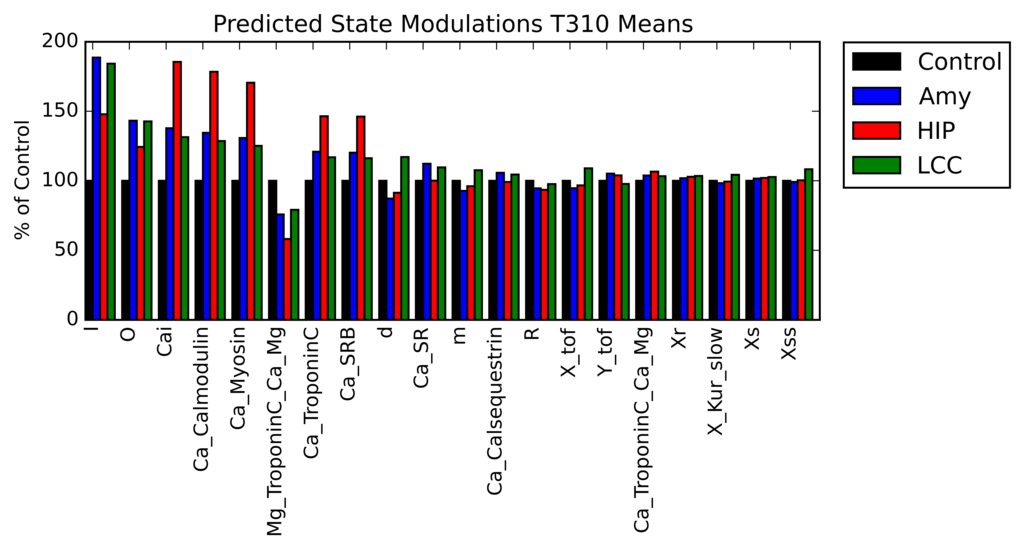
In Fig. S13 we depict the relative change in activity for the top twenty modulated model ’states’ upon increasing SL Ca2+ leak. Unique to +Amylin were nearly 2.5- and 1.5-fold increases in the inactive (I) and open (O) states of the Ryanodine receptor model (33, 34) relative to control, which is consistent with elevated dyadic junction Ca2+ that acts to both promote and terminate ryanodine receptor (RyR) opening. More importantly, the greater RyR open probability translates to an increased rate of SR Ca2+ release and commensurate increase in cytosolic Ca2+ transients. Apparent to both +Amylin and HIP conditions are 30-75% increases in states representing intracellular Ca2+ and Ca2+-bound buffers, including CaM, Troponin C (TnC), and myosin, which can be expected with Ca2+ loading.
Comparison with non-amylin-induced increases in sarcolemmal Ca2+-specific currents and sarcoplasmic reticulum Ca2+ handling
Our main hypothesis was that the +Amylin phenotype is primarily driven by non-specific SL Ca2+ leak. This mechanism would be in contrast to direct modulation of Ca2+ conducting channels, as has been demonstrated for LCC and TRPV4 in neurons (35). To investigate these hypotheses, we fit the LCC conductance to reproduce the cytosolic Ca2+ transients exhibited for +Amylin. The fitting procedure yielded an increased PCa value relative to control (180%) that in turn increased peak . These conditions, which we refer to as the LCC configuration, were found to present many of the same trends observed for the +Amylin conditions, including increased intracellular SR Ca2+ transients and SR load (see Fig. S10). Our analyses in Fig. S12 revealed some differences in sarcolemmal channel currents for LCC relative +Amylin. Firstly, the data reflect the model assumptions of higher Ca2+ leak for the +Amylin case and larger magnitude for LCC. More importantly, +Amylin and LCC were found to have different effects on , as the former indicated an amplified sodium channel current, while the for LCC was similar to control. Conversely, the most prominent K+ channel currents (, , and ) were for the most part moderately enhanced for LCC, compared to modest suppression of those current for +Amylin. Despite these opposing effects on and K+ currents, there were negligible differences in the AP relative to control (see Fig. S4i).
Discussion
Shannon-Bers-Morotti myocyte model
We revised the Shannon-Bers model of rabbit ventricular myocyte Ca2+ cycling (20) to reflect Ca2+ handling in murine species, as a close approximation to the human amylin transgenic/amylin-exposed rats used in (7). The predominant changes implemented in our model primarily entailed increasing the rates of SR Ca2+ uptake and release to mirror the larger role of SR Ca2+ handling in murine relative to higher order animals, as well as modulating potassium channel current profiles. The SBM model captured key distinguishing features of murine cardiomyocyte Ca2+ handling, including shorter AP and Ca2+ transient duration relative to rabbit, as well as a greater role of Ca2+ release and uptake via the SR, as opposed to NCX (36). When we included sarcolemmal Ca2+ leak data from Despa et al.. (7) appropriate for the +Amylin and HIP phenotypes in rats, as well as reduced SERCA Ca2+ uptake rates for HIP, the computational model reproduced the altered Ca2+ transient amplitudes across a broad range of pacing intervals. With this model, we conclude that
-
•
increased rates of Ca2+ influx through the sarcolemma, for instance as a result of amylin-induced membrane poration, promotes the amplification of cytosolic Ca2+ transients.
-
•
the increase in Ca2+ transient amplitude arises due to greater SR Ca2+ load relative to control
-
•
elevated cytosolic Ca2+ load stemming from higher rates of sarcolemmal Ca2+ influx (+Amylin), and especially when SERCA function is reduced (HIP), significantly increases the proportion of Ca2+-bound proteins. Of these proteins, CaM activation in particular may trigger remodeling via the calcineurin/NFAT pathway (37)(see Fig. 1).
-
•
the concerted relationship between amylin-induced increased sarcolemmal Ca2+ leak, intracellular Ca2+ transients, and SR loading gives rise to similar Ca2+ transient amplification in the Shannon-Bers model of EC coupling in rabbit (20), which suggests similar mechanisms of dysregulation in pre-diabetes may be manifest in higher order mammals.
Enhanced SL Ca2+ fluxes are sufficient to elevate cytosolic Ca2+ load in absence of altered SR Ca2+ handling
Recently, it was established that pre-diabetic rats transgenic for human amylin peptide presented a high density of oligomerized amylin deposits in ventricular tissue (7). Cells containing these deposits were additionally found to have greater sarcolemmal Ca2+ leak rates and amplified Ca2+ transients. These effects on sarcolemmal Ca2+ conductance and transient amplitudes were recapitulated in isolated myocytes that were incubated with human amylin, which suggested that the phenotypical changes likely precede any significant changes in protein expression that might otherwise produce similar effects. Further, disruption of amylin oligomers via increasing eicosanoid serum levels (6) and the application of membrane sealant P188 (Fig. 3) were both found to restore normal Ca2+ handling. These experiments together firmly establish the link between oligomer-induced membrane poration and Ca2+ dysregulation. Similarly, in our implementation of the Morotti-Shannon-Bers Ca2+ cycling model, we found that amplified Ca2+ transients could be induced solely by increasing the sarcolemmal Ca2+ conductance parameter (see Eq. 1).
The enhancement of intracellular Ca2+ transient amplitudes by amylin bears similarity to agonism of the sarcolemmal Ca2+ channels LCC and P2X. It is well-established, for instance, that activation of LCC via -adrenergic receptor (AR) agonists promote larger Ca2+ transients that are accompanied by elevated SR Ca2+ load (14). Further, P2X receptor activation has comparable effects on Ca2+ transients and SR load (38), albeit without the multifarious changes in Ca2+ handling associated with AR stimulation. While we defer the topic of SR load to later in the Discussion, our simulations present strong evidence that increased inward sarcolemmal Ca2+ alone is sufficient to explain amylin dose-dependent effects on Ca2+ transients in (7).
For pacing intervals at 1 Hz and greater, our predictions of the control Ca2+ transient using the SBM model (see Fig. S6) follow a neutral transient amplitude/frequency relationship, as is frequently exhibited in mice (39) and the Despa et al.rat control data (7). Further, the computational model captures the negative Ca2+ transient relationships with pacing frequency reflected in the Despa et al.HIP rat data, including the diminishing difference in transient amplitude relative to control at 2 Hz pacing. The decline in transient amplitude for HIP can be ascribed to the inability to maintain elevated SR load as pacing increases, given the reduced SERCA activity evident for these rats (7). Our data also reflect a negative transient amplitude/frequency relationship for the +Amylin conditions, which may arise because the model does not reflect phosphorylation-dependent effects on relaxation, including CaMKII activation (40). Nevertheless, given that our model captures the predominant changes in Ca2+ handling exhibited in +Amylin and HIP pre-diabetic rats (7) chiefly through modulating sarcolemmal Ca2+ leak, our simulations support the hypothesis that increased SL Ca2+ entry alone (without recruiting cation-specific channels like LCC) promotes the development of enhanced Ca2+ transients (see Fig. 1).
Contributions of SR loading to amylin phenotype
We demonstrated in Fig. S14 a positive correlation of increasing Ca2+ SL leak rates with elevated SR Ca2+ loading and transients, respectively, with preserved SERCA function. This configuration is analogous to the +Amylin conditions assumed in this study. Therefore, the predicted amplification of the cytosolic Ca2+ transients appears to be driven by Ca2+-loading of the SR, which in turn affords greater RyR Ca2+ flux per release event. We note that diastolic SR Ca2+ load was modestly increased by approximately 10% relative to control under the +Amylin conditions. The increased SR load appeared to be of little consequence, as steady-state behavior was maintained through several minutes of simulated pacing without evidence of DADs. These results concur with those of Campos et al., for which computational studies of rabbit ventricular myocytes indicated considerable tolerance to SR Ca2+ overload before abnormal AP behavior was evident (41). Further, our hypothesis is congruent with a study examining triggering of the SL Ca2+ channel P2X4, which was found to yield both elevated Ca2+ transients and SR Ca2+load (42).
An interesting finding from our simulations, is that both +Amylin and HIP rats presented amplified Ca2+ transients, despite the latter of which having predicted diastolic SR Ca2+ loads commensurate with the control (see Fig. S15). The notion that diastolic SR Ca2+ loads are comparable for HIP and control has precedent, as insignificant changes in SR load relative to control were reported in (7). We speculate that the higher diastolic cytosolic Ca2+ exhibited in HIP may amplify RyR release (Fig. S4) via Ca2+-induced Ca2+ release (43), which would ultimately yield larger Ca2+ transients despite unchanged SR Ca2+ load.
Implications of elevated cytosolic Ca2+ load
An interesting consequence of elevated Ca2+ transients and in the case of HIP, increased diastolic Ca2+ load, is the potential for activating Ca2+-dependent pathways that are normally quiescent during normal Ca2+ handling. We observed in Fig. S13 for instance, that greater levels of Ca2+-bound CaM and TnC are evident relative to control. Under normal conditions, Ca2+ activation of TnC is the critical substrate for force development in contractile tissue (44), while CaM in part regulates normal force-frequency relationships and responses to -adrenergic stimulation (45). However, it is also implicated in the activation of pathways associated with remodeling and failure (13). In particular, activation of the CaM-regulated CaMKII is attributed to cardiac remodeling via the HDAC pathway Concurrently, activation of the phosphatase calcineurin via CaM is known to promote transcriptional changes by way of NFAT activation (46), which together contribute to the hypertrophic response to dysregulated Ca2+ handling (47). Indeed, in pre-diabetic HIP there was evidence that CaMKII-HDAC and calciuneurin-NFAT remodeling were simultaneously activated (7). In this regard, while the increased Ca2+ transients stemming from amylin oligomerization may initially have beneficial inotropic effects, activation of CaM and its dependent hypertrophic pathways may contribute to cardiac decline.
Limitations
Our model was based on a rather modest set of changes in Ca2+, Na+ and K+ handling to a rabbit ventricular cardiomyocyte formulation. Further refinement of rat electrophysiology (48, 49) and implementation of a recent rat /catwo/ handling model (50), could provide improved predictive power for our model of amylin-induced dysregulation. In the greater context of diabetes, it is likely that the Ca2+ dysregulation and subsequent activation of CaMKII sets forth a cascade of maladaptive events that drive heart failure. As such, our simulation results could be improved by including the impact of altered protein kinase A (PKA) and CaMKII activity on Ca2+ handling. Here, tuning the full Morotti model (24), which explicitly considers PKA and CaMKII signaling, to reflect excitation-contraction coupling in rats may be appropriate.
Conclusions
Our predictions of elevated calcium transients under enhanced SL Ca2+ leak (via amylin oligomers) relative to control are in qualitative agreement with findings from Despa et al.(7). Further, these simulations suggest a potential mechanism linking human amylin infiltration of cardiac sarcolemma, amplification of intracellular Ca2+ transients and potential activation of CaM-dependent remodeling pathways; namely, amylin-induced increases in SL Ca2+ leak potentially dually elevate Ca2+ load in the cytosol and sarcoplasmic reticulum. Increased sarcoplasmic reticulum Ca2+ content facilitates Ca2+ release, while elevated cytosolic Ca2+ levels promote the activation of Ca2+-dependent proteins, including CaM. The latter effect may potentially contribute to the CaM-dependent activation of NFAT/HDAC pathways reported in (7). Given that human amylin oligomers have been shown to deposit in cell types including cardiac, neuronal, microglia, and beta cells (35, 10, 2, 7), the effects of amylin-induced Ca2+ dysregulation may generalize to a variety of pathologies in higher animals.
Acknowledgments
PKH thanks the University of Kentucky for pilot grant support, as well as a grant from the National Institute of General Medical Science (P20 GM103527) of the National Institutes of Health. This work was also supported by the National Institutes of Health (R01HL118474 to FD and R01HL109501 to SD) and The National Science Foundation (CBET 1357600 to FD).
References
- Westermark et al. (2011) Westermark, P., A. Andersson, and G. T. Westermark, 2011. Islet amyloid polypeptide, islet amyloid, and diabetes mellitus. Physiological reviews 91:795–826.
- Verma et al. (2016) Verma, N., H. Ly, M. Liu, J. Chen, H. Zhu, M. Chow, L. B. Hersh, and F. Despa, 2016. Intraneuronal Amylin Deposition, Peroxidative Membrane Injury and Increased IL-1 Synthesis in Brains of Alzheimer’s Disease Patients with Type-2 Diabetes and in Diabetic HIP Rats. Journal of Alzheimer’s Disease 53:259–272.
- Liu et al. (2016) Liu, M., N. Verma, X. Peng, S. Srodulski, A. Morris, M. Chow, L. B. Hersh, J. Chen, H. Zhu, M. G. Netea, K. B. Margulies, S. Despa, and F. Despa, 2016. Hyperamylinemia Increases IL-1 Synthesis in the Heart via Peroxidative Sarcolemmal Injury. Diabetes 65:2772–83.
- Sciacca et al. (2012) Sciacca, M. F. M., S. A. Kotler, J. R. Brender, J. Chen, D.-k. Lee, and A. Ramamoorthy, 2012. Two-step mechanism of membrane disruption by A through membrane fragmentation and pore formation. Biophysical journal 103:702–10.
- Mirzabekov et al. (1996) Mirzabekov, T. A., M. C. Lin, and B. L. Kagan, 1996. Pore formation by the cytotoxic islet amyloid peptide amylin. Journal of Biological Chemistry 271:1988–1992.
- DESPA et al. (2014) DESPA, S., S. Sharma, T. R. Harris, H. Dong, N. Li, N. Chiamvimonvat, H. Taegtmeyer, K. B. Margulies, B. D. Hammock, and F. Despa, 2014. Cardioprotection by Controlling Hyperamylinemia in a ”Humanized” Diabetic Rat Model. Journal of the American Heart Association 3:e001015–e001015.
- Despa et al. (2012) Despa, S., K. B. Margulies, L. Chen, A. A. Knowlton, P. J. Havel, H. Taegtmeyer, D. M. Bers, and F. Despa, 2012. Hyperamylinemia contributes to cardiac dysfunction in obesity and diabetes: a study in humans and rats. Circulation Research 110:598–608.
- Cooper et al. (1987) Cooper, G. J., A. C. Willis, A. Clark, R. C. Turner, R. B. Sim, and K. B. Reid, 1987. Purification and characterization of a peptide from amyloid-rich pancreases of type 2 diabetic patients. Proceedings of the National Academy of Sciences of the United States of America 84:8628–32.
- Pieber et al. (1993) Pieber, T. R., D. T. Stein, A. Ogawa, T. Alam, M. Ohneda, K. McCorkle, L. Chen, J. D. McGarry, and R. H. Unger, 1993. Amylin-insulin relationships in insulin resistance with and without diabetic hyperglycemia. The American journal of physiology 265:E446–53.
- Haataja et al. (2008) Haataja, L., T. Gurlo, C. J. Huang, and P. C. Butler, 2008. Islet amyloid in type 2 diabetes, and the toxic oligomer hypothesis. Endocrine reviews 29:303–16.
- Bugger and Abel (2014) Bugger, H., and E. D. Abel, 2014. Molecular mechanisms of diabetic cardiomyopathy. Diabetologia 57:660–671.
- Schauerte et al. (2010) Schauerte, J. A., P. T. Wong, K. C. Wisser, H. Ding, D. G. Steel, and A. Gafni, 2010. Simultaneous Single-Molecule Fluorescence and Conductivity Studies Reveal Distinct Classes of A Species on Lipid Bilayers. Biochemistry 49:3031–3039.
- Roderick et al. (2007) Roderick, H. L., D. R. Higazi, I. Smyrnias, C. Fearnley, D. Harzheim, and M. D. Bootman, 2007. Calcium in the heart: when it’s good, it’s very very good, but when it’s bad, it’s horrid. Biochemical Society transactions 35:957–961.
- Bers (2001) Bers, D. M., 2001. Excitation-Contraction Coupling, volume 1. Kluwer Academic Publishers, Kluwer Academic Publishers.
- Litwin et al. (1998) Litwin, S. E., J. Li, and J. H. B. Bridge, 1998. Na-Ca Exchange and the Trigger for Sarcoplasmic Reticulum Ca Release: Studies in Adult Rabbit Ventricular Myocytes. Biophysical Journal 75:359–371.
- Gong et al. (2017) Gong, J. Q., J. V. Shim, E. Núñez-Acosta, and E. A. Sobie, 2017. I love it when a plan comes together: Insight gained through convergence of competing mathematical models. Journal of Molecular and Cellular Cardiology 102:31–33.
- Hake et al. (2014) Hake, J., P. Kekenes-Huskey, and A. McCulloch, 2014. Computational modeling of subcellular transport and signaling. Current Opinion in Structural Biology 25:92–97.
- Winslow et al. (2012) Winslow, R. L., N. Trayanova, D. Geman, and M. I. Miller, 2012. Computational Medicine: Translating Models to Clinical Care. Science Translational Medicine 4:158rv11–158rv11.
- Li et al. (2010) Li, L., S. A. Niederer, W. Idigo, Y. H. Zhang, P. Swietach, B. Casadei, and N. P. Smith, 2010. A mathematical model of the murine ventricular myocyte: a data-driven biophysically based approach applied to mice overexpressing the canine NCX isoform. AJP: Heart and Circulatory Physiology 299:H1045–63.
- Shannon et al. (2004) Shannon, T. R., F. Wang, J. Puglisi, C. Weber, and D. M. Bers, 2004. A mathematical treatment of integrated Ca dynamics within the ventricular myocyte. Biophysical Journal 87:3351–3371.
- Despa et al. (2002) Despa, S., M. A. Islam, C. R. Weber, S. M. Pogwizd, and D. M. Bers, 2002. Intracellular Na(+) concentration is elevated in heart failure but Na/K pump function is unchanged. Circulation 105:2543–8.
- Li et al. (1998) Li, L., G. Chu, E. G. Kranias, and D. M. Bers, 1998. Cardiac myocyte calcium transport in phospholamban knockout mouse: relaxation and endogenous CaMKII effects. The American journal of physiology 274:H1335–H1347.
- Bassani et al. (1994) Bassani, J. W., R. A. Bassani, and D. M. Bers, 1994. Relaxation in rabbit and rat cardiac cells: species-dependent differences in cellular mechanisms. The Journal of Physiology 476:279–293.
- Morotti et al. (2014) Morotti, S., A. G. Edwards, A. D. McCulloch, D. M. Bers, and E. Grandi, 2014. A novel computational model of mouse myocyte electrophysiology to assess the synergy between Na+ loading and CaMKII. The Journal of physiology 592:1181–97.
- Clausen (2004) Clausen, T., 2004. Effects of amylin and other peptide hormones on Na +-K +transport and contractility in rat skeletal muscle. The Journal of Physiology 527:121–130.
- Petzold (1983) Petzold, L., 1983. Automatic Selection of Methods for Solving Stiff and Nonstiff Systems of Ordinary Differential-Equations. Siam Journal on Scientific and Statistical Computing 4:136–148.
- Srinivas and Patnaik (1994) Srinivas, M., and L. M. Patnaik, 1994. Genetic Algorithms: A Survey. Computer 27:17–26.
- Collins et al. (2007) Collins, J. M., F. Despa, and R. C. Lee, 2007. Structural and functional recovery of electropermeabilized skeletal muscle in-vivo after treatment with surfactant poloxamer 188. Biochimica et biophysica acta 1768:1238–46.
- Pereira et al. (2006) Pereira, L., J. Matthes, I. Schuster, H. H. Valdivia, S. Herzig, S. Richard, and A. M. Gomez, 2006. Mechanisms of [Ca2+](i) transient decrease in cardiomyopathy of db/db type 2 diabetic mice. Diabetes 55:608–615.
- DeSantiago et al. (2002) DeSantiago, J., L. S. Maier, and D. M. Bers, 2002. Frequency-dependent acceleration of relaxation in the heart depends on CaMKII, but not phospholamban. Journal of molecular and cellular cardiology 34:975–984.
- Lowe et al. (2008) Lowe, J. S., O. Palygin, N. Bhasin, T. J. Hund, P. A. Boyden, E. Shibata, M. E. Anderson, and P. J. Mohler, 2008. Voltage-gated Nav channel targeting in the heart requires an ankyrin-G dependent cellular pathway. The Journal of cell biology 180:173–86.
- Bovo et al. (2014) Bovo, E., P. P. de Tombe, and A. V. Zima, 2014. The Role of Dyadic Organization in Regulation of Sarcoplasmic Reticulum Ca2+ Handling during Rest in Rabbit Ventricular Myocytes. Biophysical Journal 1–8.
- Stern et al. (1999) Stern, M. D., L. S. Song, H. Cheng, J. S. Sham, H. T. Yang, K. R. Boheler, and E. Ríos, 1999. Local control models of cardiac excitation-contraction coupling. A possible role for allosteric interactions between ryanodine receptors. The Journal of general physiology 113:469–89.
- Stern et al. (1997) Stern, M. D., G. Pizarro, and E. Ríos, 1997. Local control model of excitation–contraction coupling in skeletal muscle. The Journal of general physiology 110:415.
- Zhang et al. (2017) Zhang, N., S. Yang, C. Wang, J. Zhang, L. Huo, Y. Cheng, C. Wang, Z. Jia, L. Ren, L. Kang, and W. Zhang, 2017. Multiple target of hAmylin on rat primary hippocampal neurons. Neuropharmacology 113:241–251.
- Bers (2002) Bers, D. M., 2002. Cardiac excitation-contraction coupling. Nature 415:198–205.
- Wilkins and Molkentin (2004) Wilkins, B. J., and J. D. Molkentin, 2004. Calcium–calcineurin signaling in the regulation of cardiac hypertrophy. Biochemical and Biophysical Research Communications 322:1178–1191.
- Shen (2006) Shen, J.-B., 2006. Extracellular ATP-stimulated current in wild-type and P2X4 receptor transgenic mouse ventricular myocytes: implications for a cardiac physiologic role of P2X4 receptors. The FASEB Journal 20:277–284.
- Antoons et al. (2002) Antoons, G., K. Mubagwa, I. Nevelsteen, and K. R. Sipido, 2002. Mechanisms underlying the frequency dependence of contraction and [Ca(2+)](i) transients in mouse ventricular myocytes. The Journal of physiology 543:889–98.
- Bassani et al. (1995) Bassani, R. A., A. Mattiazzi, and D. M. Bers, 1995. CaMKII is responsible for activity-dependent acceleration of relaxation in rat ventricular myocytes. The American journal of physiology 268:H703–12.
- Campos et al. (2015) Campos, F. O., Y. Shiferaw, A. J. Prassl, P. M. Boyle, E. J. Vigmond, and G. Plank, 2015. Stochastic spontaneous calcium release events trigger premature ventricular complexes by overcoming electrotonic load. Cardiovascular research 107:175–183.
- Shen and Chen (2007) Shen, L., and Z. Chen, 2007. Critical review of the impact of tortuosity on diffusion. Chemical Engineering Science 62:3748–3755.
- Zahradníková et al. (1999) Zahradníková, A., I. Zahradník, I. Györke, and S. Györke, 1999. Rapid activation of the cardiac ryanodine receptor by submillisecond calcium stimuli. The Journal of general physiology 114:787–98.
- Gordon et al. (2000) Gordon, A. M. A. M., E. E. Homsher, and M. M. Regnier, 2000. Regulation of contraction in striated muscle. Physiological Reviews 80:853–924.
- Maier and Bers (2002) Maier, L. S., and D. M. Bers, 2002. Calcium, calmodulin, and calcium-calmodulin kinase II: heartbeat to heartbeat and beyond. Journal of molecular and cellular cardiology 34:919–39.
- Heineke and Ritter (2012) Heineke, J., and O. Ritter, 2012. Cardiomyocyte calcineurin signaling in subcellular domains: from the sarcolemma to the nucleus and beyond. Journal of molecular and cellular cardiology 52:62–73.
- Bers (2008) Bers, D. M., 2008. Calcium cycling and signaling in cardiac myocytes. Annual review of physiology 70:23–49.
- Demir (2004) Demir, S. S., 2004. Computational modeling of cardiac ventricular action potentials in rat and mouse: review. The Japanese journal of physiology 54:523–30.
- Hintz et al. (2002) Hintz, K. K., F. L. Norby, J. Duan, M. a. Cinnamon, V. a. Doze, and J. Ren, 2002. Comparison of cardiac excitation-contraction coupling in isolated ventricular myocytes between rat and mouse. Comparative biochemistry and physiology. Part A, Molecular & integrative physiology 133:191–8.
- Gattoni et al. (2016) Gattoni, S., Å. T. Røe, M. Frisk, W. E. Louch, S. A. Niederer, and N. P. Smith, 2016. The calcium-frequency response in the rat ventricular myocyte: an experimental and modelling study. The Journal of Physiology 594:4193–4224.
- Dybkova et al. (2011) Dybkova, N., S. Sedej, C. Napolitano, S. Neef, A. G. Rokita, M. Hünlich, J. H. Brown, J. Kockskämper, S. G. Priori, B. Pieske, and L. S. Maier, 2011. Overexpression of CaMKIIc in RyR2R4496C+/− Knock-In Mice Leads to Altered Intracellular Ca2+ Handling and Increased Mortality. Journal of the American College of Cardiology 57:469–479.
- Louch et al. (2010) Louch, W. E., K. Hougen, H. K. Mørk, F. Swift, J. M. Aronsen, I. Sjaastad, H. M. Reims, B. Roald, K. B. Andersson, G. Christensen, and O. M. Sejersted, 2010. Sodium accumulation promotes diastolic dysfunction in end-stage heart failure following <i>Serca2</i> knockout. The Journal of Physiology 588:465–478.
- Despa and Bers (2013) Despa, S., and D. M. Bers, 2013. Na⁺ transport in the normal and failing heart - remember the balance. Journal of molecular and cellular cardiology 61:2–10.
- Altamirano et al. (2006) Altamirano, J., Y. Li, J. DeSantiago, V. Piacentino, S. R. Houser, and D. M. Bers, 2006. The inotropic effect of cardioactive glycosides in ventricular myocytes requires Na + -Ca 2 + exchanger function. The Journal of Physiology 575:845–854.
- Swift et al. (2008) Swift, F., J. A. K. Birkeland, N. Tovsrud, U. H. Enger, J. M. Aronsen, W. E. Louch, I. Sjaastad, and O. M. Sejersted, 2008. Altered Na+/Ca2+-exchanger activity due to downregulation of Na+/K+-ATPase alpha2- isoform in heart failure. Cardiovascular Research 78:71–78.
- Sipido et al. (1997) Sipido, K. R., M. Maes, and F. Van de Werf, 1997. Low efficiency of Ca2+ entry through the Na(+)-Ca2+ exchanger as trigger for Ca2+ release from the sarcoplasmic reticulum. A comparison between L-type Ca2+ current and reverse-mode Na(+)-Ca2+ exchange. Circulation research 81:1034–44.
- Sobie et al. (2008) Sobie, E. A., M. B. Cannell, and J. H. B. Bridge, 2008. Allosteric Activation of Na+-Ca2+ Exchange by L-Type Ca2+ Current Augments the Trigger Flux for SR Ca2+ Release in Ventricular Myocytes. Biophysical Journal 94:L54–L56.
- Kekenes-Huskey et al. (2012) Kekenes-Huskey, P. M., Y. Cheng, J. E. Hake, F. B. Sachse, J. H. Bridge, M. J. Holst, J. A. McCammon, A. D. McCulloch, and A. P. Michailova, 2012. Modeling effects of L-type ca(2+) current and na(+)-ca(2+) exchanger on ca(2+) trigger flux in rabbit myocytes with realistic T-tubule geometries. Frontiers in physiology 3:351.
- Shorten et al. (2007) Shorten, P. R., C. D. McMahon, and T. K. Soboleva, 2007. Insulin Transport within Skeletal Muscle Transverse Tubule Networks. Biophysical Journal 93:3001–3007.
- Lambert et al. (2015) Lambert, R., S. Srodulski, X. Peng, K. B. Margulies, F. Despa, and S. Despa, 2015. Intracellular Na + Concentration ([Na + ] i ) Is Elevated in Diabetic Hearts Due to Enhanced Na + –Glucose Cotransport. Journal of the American Heart Association 4:e002183.
- Kim and Rhim (2011) Kim, S., and H. Rhim, 2011. Effects of Amyloid-B peptides on voltage-gated L-Type Ca v1.2 and Ca v1.3 Ca 2+ channels. Molecules and Cells 32:289–294.
Supplement
Supplemental Results
Validation of murine SB model
Potassium channel equations
Among the most significant changes in the murine-specific Morotti model relative to the Shannon-Bers rabbit ventricular myocyte system are the phenomological representations of K+ channel currents. In Fig. S2 we compare time-dependent current profiles for nine of the prominent K+ channels. Nearly all channels required minor parameter changes to correspond to murine species (,,,,, , and , of which the latter two were inactive in mice); however, two channels, and , were not included in the Shannon-Bers model and are thus implemented here. Following Morotti et al. (24), (Eq. S19) and (Eq. S1) were parameterized as follows:
IKur
{dgroup}
| (S1) |
| (S2) |
| (S3) |
| (S4) |
| (S5) |
| (S6) |
| (S7) |
Xkur_gate
{dgroup}
| (S8) |
| (S9) |
| (S10) |
Ykur_gate
{dgroup}
| (S11) |
| (S12) |
| (S13) |
| (S14) |
| (S15) |
Xss_gate
{dgroup}
| (S16) |
| (S17) |
| (S18) |
| (S19) |
In Fig. S1, we summarize several key predicted outputs for the Shannon-Bers (rabbit) and SBM (mouse) models: cytosolic and SR Ca2+ transients (a-b), as well as sodium load (c) and action potential (d). The SBM implementation exhibits, for instance, modestly higher Ca2+ transients in both the cytosol and SR, higher intracellular Na+ load and a significantly shorter AP, in comparison to data predicted for rabbit Ca2+ handling. The decreased action potential largely stems from reparameterization of the potassium currents defined above, the currents of which we summarize in Fig. S2. These model predictions are in quantitative agreement with corresponding current profiles presented in the Morotti et al. supplemental data (24), which were based on transient data from Dybkova et al.(51). We present analogous current data for , , and , which again are in quantitative agreement with Morotti et al.. Altogether, these predictions indicate that our implementation of the Morotti model faithfully reproduces the murine electrophysiology and Ca2+ handling. This implementation serves as the basis for our further refinement to reflect the rat Ca2+ dynamics.
Maintenance of sodium load
In the context of Ca2+ handling, Na+ serves an important role in both extruding cytosolic Ca2+ in its ’forward’ mode, as well as promoting Ca2+ influx during its brief ’reverse’ mode (14). Sodium load exceeding normal physiological ranges (approximately 9-14 mM in rodents), for instance, can contribute to diastolic dysfunction (52, 53), predominantly by impairing NCX Ca2+ extrusion (54). Conversely, the NCX reverse mode may leverage Na+ gradients to amplify sarcolemmal Ca2+ transients and thereby prime SR Ca2+ release (55, 15, 56, 57, 58).While our measurements of Na+-load in +Amylin rats indicated that intracellular Na+ was within normal ranges, numerical predictions suggested that loading may be elevated under conditions of increased sarcolemmal Ca2+ leak with constant NKA function. Therefore to maintain predicted Na+ transients within control levels, a modest increase in NKA Vmax was predicted. On one hand, there is precedent for small peptides like insulin partitioning into the rat skeletal transverse tubule system (59), as well agonism of NKA activity due to amylin (25). However, for rat cardiac ventricular tissues, these changes in NKA function may be non-existent or below the limits of experimental detection at least in fully-developed diabetes (60).
Up-regulated SL currents (via LCC) have dissimilar phenotype to amylin action
The dominant effect of amylin appears to be its enhancement of non-selective SL Ca2+ currents, although there are reports that amyloidogenic peptides can alter LCC regulation (61). To delineate this contribution from secondary agonism of SL Ca2+ channel activity, we performed simulations using an amplified sufficient to reproduce the Ca2+ transients observed for enhanced SL Ca2+ leak. We emphasize here that LCC current/voltage relationship is indeed preserved in HIP rats (as shown in Fig. S16). Similar to +Amylin, increased LCC current yielded increased intracellular Ca2+ transients, elevated SR Ca2+ load, and increased diastolic Ca2+ load. Nevertheless, we identified distinct patterns of modulated channel activity for increased LCC relative to those presented for the +Amylin configuration. Namely, our models indicate amylin-induced Ca2+ leak amplifies , whereas in contrast, increased LCC conductance inflates the amplitudes of several prominent K+ channels. While the predicted channel currents have a complex dependence on ion-sensitive gating probabilities, these findings raise interesting possibilities that different modes of Ca2+ entry could in principle yield distinct influences on channels controlling the action potential. Nevertheless, under the conditions considered in this study, our modeling data (see Fig. S9 and Fig. S15) suggest that the modest perturbations in ion channel conductance under the +Amylin and LCC configurations did not appreciably impact the action potential duration (APD). These findings are consistent with preserved APD upon P2X stimulation reported in Fig 6 of (42).
Genetic algorithm for fitting
In order to optimize model fitting to the experimentally measured cases, a genetic algorithm was written to fit the model to various cases. For example, in regards to the Amylin case, we randomized the NKA current parameter to find what value that gave the closest steady state value of 12 mM for the intracellular Na+ over 30s of simulation time. A starting value for NKA current (5 ) was given with a generous starting standard deviation (0.5) to randomize within. The standard deviation value was done as a lognormal distribution to ensure that reductions and increases of N% were equally probable. A total of 30 random draws were made. Once the random draws were made, they were submitted to be run using CPUs. After the job finished, an error value was calculated for comparing an output of the system (in this case intracellular Na+) against the experimentally determined value by squaring the result minus the experiment value.
This gave a ”job fitness” score that was used to determine which random draw was the best.
| (S20) |
The job that had the best ”job fitness” score was now selected as the new starting value to have jobs randomized around for the next iteration. The standard deviation was then adjusted by multiplying the input standard deviation by e to the negative iteration number times a scaler.
| (S21) |
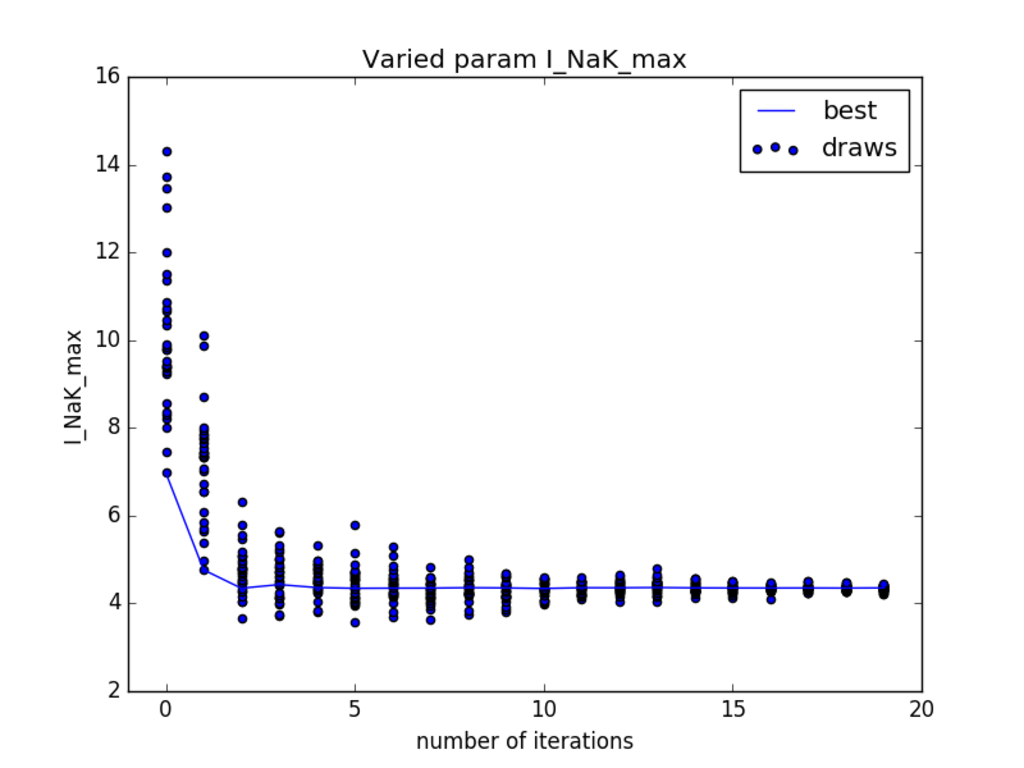
This new standard deviation determined the range of random draws around the new starting value given from the first iteration of the code. This process was then continued for several different iterations (20) to converge to a single value of the NKA current which would also give an output value for intracellular Na+ to match that of the experimentally given value. An example plot of the convergence of the NKA current value over number of iterations can be seen in Fig. S18. The graph shows how after the amount of iterations increased, the value of the NKA current converged. This value of the NKA current was then used within the simulation and the intracellular Na+ value was compared to the baseline case to match experiment. This plot can be see in Fig. S9. Since the value found for the NKA current using the genetic algorithm gave an intracellular Na+ comparable to that of experiment, it can be seen that the generic algorithm worked as expected.
Comparison of parameter sensitivity
Sensitivity analyses
We determined the sensitivity of SBM model outputs including Ca2+ amplitude, cytosolic Na+, SR Ca2+, diastolic Ca2+, APD, and Ca2+ transient decay () to the model parameters, by randomizing model parameters temperature, background Ca2+leak, background Na+ leak, SERCA function, NKA function, and PCa. Each parameter was randomized independently, while holding all other parameters at their default values for the rat model.
The random draw was done within a standard deviation value of 10% of the given input value based on the baseline rat data. This was done for a total of 10 times to get 10 random draws for the parameter. Once the 10 random draws were done for the chosen parameter, the program moved to a new parameter and repeated the process. This lead to a total of 60 jobs that were run. Descriptive statistics (mean (M), standard deviation (SD), median (med)) and plots (boxplots, scatterplots with LOESS curves) were initially performed to assess distributional characteristics and bivariate relationships. Multivariate multiple regression (Rencher & Christensen, 2012) was performed to assess the simultaneous effects of each input on all outputs jointly. If multivariate Wilks’ tests for any associations with any output were significant, then tests for associations for individual outputs were performed in a step-down fashion. All analyses were performed in SAS v9.4 (SAS Institute, Cary, NC). A two-sided p-value 0.05 was considered statistically significant.
Sensitivity results
Inputs that had at least one significant association with any of the outputs included: Background Ca2+leak ( = 0.039, F(5,49) = 242.804, = 0.961), background Na+leak ( = 0.009, F(5,49) = 1,097.591, = 0.991), NKA Vmax ( = 0.001, F(5,49) = 12,009.757, = 0.999), PCa ( = 0.002, F(5,49) = 5,906.809, = 0.998), T ( = 0.002, F(5,49) = 5,145.939, = 0.998), and SERCA Vmax ( = 0.014, F(5,49) = 708.322, = 0.986). Thus, inputs respectively accounted for 96% or more variation in the best linear combination of outputs (all 0.96). Specifically for increasing Background Ca2+leak and increasing background Na+leak, there was only a significant association with increasing Nai (partial () = 0.568, p 0.001 for CaBk and = 0.829, p 0.001 for NaBk, respectively). Similar results were found for NKA Vmax. Here, decreasing Nai was the only output that was significantly associated with increasing NKA Vmax ( = 0.981, p 0.001). Increased PCa was significantly associated with both increased Nai ( = 0.929, p 0.001) and increased APD ( = 0.694, p 0.001). For T, higher Nai again was the only output significantly predicted by increasing T ( = 0.951, p 0.001), while T was also marginally significantly associated with SR Ca2+ ( = 0.058, p = 0.076). Increased SERCA Vmax was significantly associated with increased APD ( = 0.166, p = 0.002), increased SR Ca2+ ( = 0.138, p = 0.005), and decreased Nai ( = 0.354, p 0.001).
Supplemental Tables
| Parameter [units] | Name | Rabbit | Mouse | Rat |
|---|---|---|---|---|
| Membrane capacitance [F] | - | |||
| Cell volume [L] | (24) | - | ||
| Intracellular Na+[mM] | 8.80853 | 11.1823 | 12.0 | |
| Free concentration of Ca2+ | 1.8 | 1.0 | - | |
| in extracellular compartment [mM] | ||||
| Maximal conductance of flux for | 16 | 10 | - | |
| fast Na+ current [] | ||||
| Junctional partitioning | junction | 0.11 | 0.19 | - |
| Sarcolemmal partitioning | sarcolemmal | 0.89 | 0.81 | - |
| Background Na+ leak [] | - | |||
| K_m of Na+ - Ca2+ exchanger for Na+ [mM] | 11 | 19 | - | |
| Max current of the Na+ - K+ pump [] | 1.90719 | 5.0 | * | |
| Slow activating delayed rectifier current | 1.0 | 0.0 | - | |
| Slow inactivating delayed rectifier current 1 [] | N/A | 0.176 | - | |
| Slow inactivating delayed rectifier current 2 [] | N/A | 0.14 | - | |
| conductance [] | N/A | 0.15 | - | |
| Velocity max for Na+ - Ca2+ exchanger [] | 9 | 1 | - | |
| Allosteric Ca2+ activation constant [mM] | - | |||
| Background Ca2+ leak [] | - | |||
| SR Ca2+ concentration dependent | ||||
| activation of SR Ca2+ release [mM] | 0.45 | 0.5 | - | |
| Passive leak in the SR membrane [] | - | |||
| Velocity max for SR Ca2+ pump flux [] | * | * | ||
| SR Ca2+ pump forward mode [mM] | - | |||
| SR Ca2+ pump reverse mode [mM] | 1.7 | 2.1 | - | |
| L-type Ca2+ channel Ca2+ permeability [] | - | |||
| L-type Ca2+ channel Na+ permeability [] | - | |||
| L-type Ca2+ channel K+ permeability [] | - | |||
| Background Ca2+ leak [] | - |
| Model term | Description |
|---|---|
| Ca2+-activated chloride current | |
| Background \chCl current | |
| SL-Ca2+ pump | |
| Background Ca2+ leak | |
| Background Na+ leak | |
| NKA current | |
| fast Cardiac transient outward potassium | |
| slow Cardiac transient outward potassium | |
| the ’rapid’ delayed rectifier current | |
| slowly activating K+ current | |
| inward rectifier K+ current | |
| plateau potassium current | |
| slowly inactivating outward | |
| non-inactivating steady-state K+ current | |
| LCC channel current | |
| NCX current | |
| Na+ current | |
| SL Na+ | |
| JSR Na+ | |
| I | RyR inactive gate |
| O | RyR open gate |
| Cai | cytosolic Ca2+ |
| V | Action potential |
| Case | Sarcolemmal leak | SERCA | NKA | PCa |
|---|---|---|---|---|
| (mS/F) | (mM/ms) | (A/F) | ||
| control | II | IV | III3.85 | |
| +Amylin | III, (168%) | III | III4.40, (114%) | |
| HIP | III, (168%) | III,(53%) | III4.40, (114%) | |
| LCC | II | IV | III3.85 | III,(180%) |
Supplemental Figures