11email: asanna@mpifr-bonn.mpg.de 22institutetext: INAF, Osservatorio Astrofisico di Arcetri, Largo E. Fermi 5, 50125 Firenze, Italy 33institutetext: INAF, Osservatorio Astronomico di Cagliari, via della Scienza 5, 09047, Selargius, Italy 44institutetext: JIVE, Joint Institute for VLBI in Europe, Postbus 2, 7990 AA Dwingeloo, The Netherlands 55institutetext: European Southern Observatory, Alonso de Cordova 3107, Casilla 19001, Santiago 19, Chile 66institutetext: Ural Federal University, 51 Lenin Str., Ekaterinburg 620000, Russia
Planar infall of CH3OH gas around Cepheus A HW2
Abstract
Aims. In order to test the nature of an (accretion) disk in the vicinity of Cepheus A HW2, we measured the three-dimensional velocity field of the CH3OH maser spots, which are projected within 1000 au of the HW2 object, with an accuracy of the order of 0.1 km s-1.
Methods. We made use of the European VLBI Network (EVN) to image the 6.7 GHz CH3OH maser emission towards Cepheus A HW2 with 4.5 milli-arcsecond resolution (3 au). We observed at three epochs spaced by one year between 2013 and 2015. During the last epoch, on mid-march 2015, we benefited from the new deployed Sardinia Radio Telescope.
Results. We show that the CH3OH velocity vectors lie on a preferential plane for the gas motion with only small deviations of away from the plane. This plane is oriented at a position angle of east of north, and inclined by with the line-of-sight, closely matching the orientation of the disk-like structure previously reported by Patel et al. (2005). Knowing the orientation of the equatorial plane, we can reconstruct a face-on view of the CH3OH gas kinematics onto the plane. CH3OH maser emission is detected within a radius of 900 au from HW2, and down to a radius of about 300 au, the latter coincident with the extent of the dust emission at 0.9 mm. The velocity field is dominated by an infall component of about 2 km s-1 down to a radius of 300 au, where a rotational component of 4 km s-1 becomes dominant. We discuss the nature of this velocity field and the implications for the enclosed mass.
Conclusions. These findings bring direct support to the interpretation that the high-density gas and dust emission, surrounding Cepheus A HW2, trace an accretion disk.
Key Words.:
ISM: kinematics and dynamics – Masers – Stars: formation – Stars: individual: Cepheus A HW21 Introduction
Cepheus A is the second nearest high-mass star-forming region (after Orion), located at a trigonometric distance of 700 pc from the Sun (Moscadelli et al. 2009; Dzib et al. 2011) in the Cepheus OB3 complex (e.g., Fig. 27 of Kun et al. 2008). The region has an IR luminosity in the range 2–3 (e.g., Mueller et al. 2002; De Buizer et al. 2016) and hosts a tight ( 7000 au) cluster of young stellar objects (YSOs) associated with radio continuum emission. Half of the bolometric luminosity is attributed to the brightest radio source in the field, named “HW2” after Hughes & Wouterloot (1984, see also ), which would correspond to a ZAMS star with an early-B spectral type and a mass in excess of 10 M⊙. The HW2 object drives one of the best examples of radio thermal jets in the literature (e.g., Rodriguez et al. 1994; Curiel et al. 2006), which excites several shocked layers of H2O maser emission (e.g., Torrelles et al. 2011). At the origin of the radio jet, Patel et al. (2005) resolved a dense core of dust and gas in the 345 GHz band of the SMA (see also Torrelles et al. 2007). The core emission is flattened in the direction perpendicular to the radio jet, with an aspect ratio near 2 between its major and minor axes. Assuming the core is tracing a circumstellar disk, Patel et al. showed that the aspect ratio of the core emission implies a disk inclination of with the line-of-sight. On the plane of the sky, the major axis of the disk, with an outer radius larger than (or 560 au), is oriented at a position angle (P.A.) of (east of north). Despite the fact that this simple picture would support a scenario of disk-mediated accretion onto HW2, the environment around HW2 is significantly more complex than that of an isolated YSO, showing the presence of perhaps more than 5 objects within a radius of 1000 au (e.g., Fig. 1 of Jiménez-Serra et al. 2009). Because of this multiplicity, the disk scenario has been questioned as due to a chance superposition of different hot cores (e.g., Brogan et al. 2007; Comito et al. 2007).
| Absolute Position ( mas) | ||||||||
| Epochsa𝑎aa𝑎aThe EVN operated with 8 antennas at the first two epochs (EF, WB, JB, ON, MC, NT, TR, YS), with the addition of SR during the last epoch. | run | R.A. (J2000) | Dec. (J2000) | HPBW | rms | |||
| (gg/mm/aa) | (hr) | MHz | (km s-1) | (km s-1) | (h m s) | ( ′ ′′) | (mas) | (mJy beam-1) |
| 01/03/13 – 28/02/14 – 13/03/15 | 8 | 6668.5 | 0.04 | –1.73 | 22:56:17.9089 | 62:01:49.527 | 4.5 | 4–6 |
By directly measuring the velocity field of gas belonging to the putative disk, we can provide a critical test to the disk-like scenario. Compact maser emission centers, of the order of a few au in size, are ideal test particles to probe the local, three-dimensional, gas kinematics, by combining their proper motion vectors (i.e., their displacement on the plane of the sky) with the Doppler shift of the maser lines (e.g., Moscadelli et al. 2011; Torrelles et al. 2011). Towards Cepheus A, bright CH3OH maser emission at 6.7 GHz was firstly reported by Menten (1991) and imaged at milli-arcsecond resolution by Sugiyama et al. (2008a, b) and Torstensson et al. (2008). Individual CH3OH masers are projected within 1000 au of the HW2 object, and outline a filamentary distribution with LSR velocities redshifted, by less than 5 km s-1, with respect to the systemic velocity of the region (around km s-1). Following this evidence, it has been proposed that the CH3OH masers are tracing a contracting circular ring with radius of about 680 au, centered on HW2, and oriented nearly edge-on with respect to the observer (Torstensson et al. 2008; Vlemmings et al. 2010; Torstensson et al. 2011; Sugiyama et al. 2014). Based on the detection of an ordered polarization field through the CH3OH maser emission, Vlemmings et al. (2010) also suggested that the maser motions might be driven by magnetic forces.
In order to test the disk-like scenario, we exploited the high sensitivity of the European VLBI Network (EVN) to observe at different epochs the 6.7 GHz CH3OH masers in HW2, with the aim of eventually tracing proper motions with an accuracy of 0.1 km s-1. We present the details of the EVN observations in Sect. 2. In Sect. 3, we report about the proper motion measurements and the kinematic properties of the maser distribution. In Sect. 4, we model the full-space velocity field of the CH3OH gas, and discuss the implications for the disk-like scenario in Cepheus A HW2. Conclusions are drawn in Sect. 5.
2 Observations and calibration
We performed multi-epoch, phase-referencing, EVN observations of the A+ CH3OH maser transition towards Cepheus A HW2, and correlated all 4 polarization combinations (RR, LL, RL, LR). At each epoch, we observed three calibrators together with the maser target. First, the reference polarization calibrator, J 13313030, was observed at the beginning of the experiment to register the systematic rotation of the linear polarization angle () in the EVN dataset. Second, J 22024216 was observed as a fringe finder calibrator every hour to correct both the instrumental phase delay and the polarization leakage. Third, we observed the reference position calibrator J 23026405, which is in the International Celestial Reference Frame (ICRF) catalog, and is offset by from Cepheus A. Scans on the maser target and the position calibrator were alternated over a cycle of 5 min. The EVN data were processed with the SFXC software correlator (Keimpema et al. 2015) at the Joint Institute for VLBI in Europe by using an averaging time of 2 s and two frequency setups. A high spectral sampling (0.98 kHz) over a narrow band (2 MHz) was used to accurately sample the maser linewidth. A course spectral sampling (15.6 kHz) over a wide band of 16 MHz was used to improve on the continuum sensitivity of the calibrators maps. Observation information is summarized in Table 1.
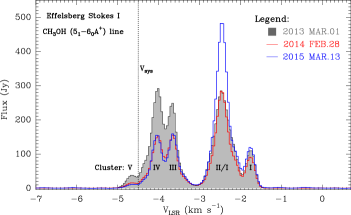
Data were reduced with the NRAO Astronomical Image Processing System (AIPS) following standard procedures. Fringe fitting and self calibration were performed on a strong maser channel at an LSR velocity of –1.73 km s-1 at each epoch. We produced total intensity (Stokes ) maps of the maser emission to image an area of radius around HW2. At each epoch, we set a restoring beam size of 4.5 mas (round), equal to the geometrical average of the clean beam size obtained with ROBUST 0 weighting (task IMAGR of AIPS). Figure 1 shows the Effelsberg spectra of the CH3OH maser emission towards Cepheus A HW2 at each epoch.
We postpone the analysis of the polarization information to a subsequent paper. Recently, Lankhaar et al. (2016) presented a theoretical derivation of the hyperfine structure of the methanol molecule. They show that a number of hyperfine transitions, close in frequency, might contribute to the 6.7 GHz CH3OH maser emission. In order to account for this multiplicity, a new pumping model for the 6.7 GHz CH3OH masers is required. These findings might have an influence on the modeling of the polarized maser emission (Vlemmings et al. 2010) which is under review (Lankhaar et al. 2017, in prep.; Vlemmings et al. 2018, in prep.).
3 Kinematic properties of the maser distribution
We detected 64 individual maser emission centers, or cloudlets222Hereafter, we make use of the following convention: • a maser spot is a compact emission, at milli-arcsecond scale, detected on a single channel map and best-fitted with an elliptical Gaussian brightness distribution; • a maser cloudlet, elsewhere referred to as “feature”, is an individual gas condensation which is composed by a cluster of contiguous spots, both, in space ( HPBW, typically), and LSR velocity ( FWHM, based on an average linewidth of 0.2–0.3 km s-1). , above a threshold of 7 . For strong maser channels, this threshold is typically set by the limited dynamical range of the images. In Table LABEL:tab2, we list the relative position of each maser cloudlet with respect to the peak of the reference maser channel (used to calibrate the visibilities). The absolute position of this maser spot is determined with an accuracy of mas and is given in Table 1. The centroid position of each CH3OH cloudlet is determined by an intensity-weighted average of the spots’ distribution within a beam, following Sanna et al. (2010). For cloudlets brighter than 1 Jy beam-1, positional uncertainties are typically better than 0.1 mas.
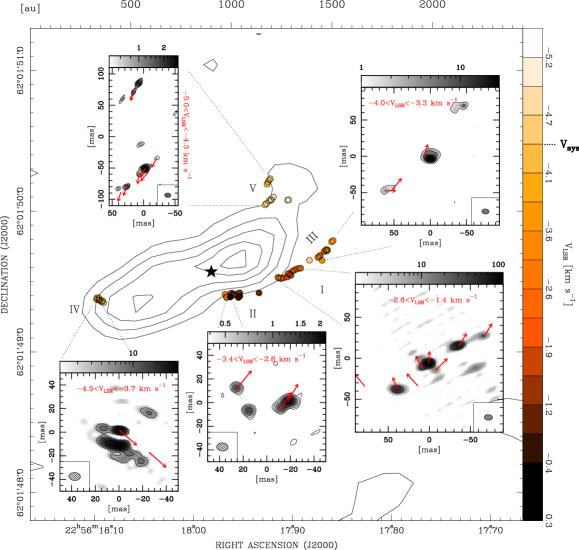
Maser cloudlets are spread within a projected radius of 1000 au from the HW2 object and are arranged in five clusters by position (Fig. 2). These clusters have been labeled, from I to V, after Sugiyama et al. (2008a). The clusters I and II, which project closer to the HW2 object, show the most red-shifted emission and span a range of LSR velocities between 0 and km s-1. The three clusters, III, IV, and V, projected further away from HW2, are centered at LSR velocities (intensity-weighted) of , , and km s-1, respectively, and each one emits over a narrow range of velocities (ca. 0.7 km s-1). The five insets of Fig. 2 show the details of the maser emission, summed over the relevant LSR velocity ranges, at the position of each cluster (from the first epoch data). These maps were produced after a boxcar smoothing of three velocity channels of the initial dataset, and by imaging the new dataset with an – tapering of 15 M. At variance with the integrated maser flux, which shows significant variations among the epochs (up to a factor of 2), the relative positions among the clusters, and their ranges of LSR velocities, have remained constant during the last 10 years, since the first high resolution observations by Torstensson et al. (2011, their Fig. 1) on November 2004.
In order to provide proper motion measurements accurate to a few 0.1 km s-1, we studied the spatial and spectral distribution of the maser spots within each cloudlet detected at the three epochs (e.g., Sanna et al. 2010, their Fig. 6). At a distance of 700 pc, a proper motion of 1 km s-1 corresponds to a displacement of 0.6 mas every 2 years. We do not report proper motions for cloudlets which changed their internal spots’ distribution over the epochs so that their centroid position shifted by more than 0.3 mas. Given that we expect proper motions of a few km s-1, based on the LSR velocity dispersion of the maser emission, this criterion allows us to exclude proper motions severely affected by the internal cloudlet structure. We selected a sub-sample of 24 maser cloudlets that satisfy this condition and calculated their relative proper motion vectors, with respect to the reference cloudlet at zero offset (num. 2), by interpolating their positions among the epochs with a linear regression fit (e.g., Moscadelli et al. 2010, their Fig. 3). Proper motions were referred to the reference system of the gas at rest by subtracting the average velocity vector of the whole sample. In columns 6 and 7 of Table LABEL:tab2, we list the eastward and northward velocity components of the corrected proper motions. Their magnitude does not exceed 5 km s-1 and has an average value of 1.7 km s-1. The mean uncertainty per velocity component is 0.2 km s-1. In each inset of Fig. 2, we plot the direction of the proper motion vectors at each measured position (red arrows). The proper motion magnitude gives the position that would be reached by a maser cloudlet, moving at the average velocity of 1.7 km s-1, after a time of 40 years.
4 Discussion
4.1 Preferential plane of gas motion
Because CH3OH molecules are (mainly) formed on grain surfaces and are evaporated in the gas phase at a temperature (100–300 K; Herbst & van Dishoeck 2009) well below the dust sublimation temperature (1500 K), we do expect that the presence of CH3OH gas should be coupled with the presence of dust condensation. The spatial distribution of dust continuum emission and high-density molecular lines towards Cepheus A HW2 has been interpreted as the silhouette of an accretion disk with a radius of several 100 au. As a comparison, in Fig. 2 we overlap the distribution of the CH3OH maser cloudlets with an integrated velocity map of the HC3N emission in the = 1 excited state (from Jiménez-Serra et al. 2009). The CH3OH maser transition at 6.7 GHz is inverted by IR radiation, in the range 20–30 m, which is enhanced in the dusty environment heated by a young massive star (e.g., Cragg et al. 2005). Similarly, the HC3N vibrationally excited states are populated by radiative pumping due to an IR field at wavelengths of a few 10 m (Goldsmith et al. 1982). Figure 2 emphasizes the spatial correlation between the dense molecular envelope surrounding HW2 and the loci of CH3OH maser emission.
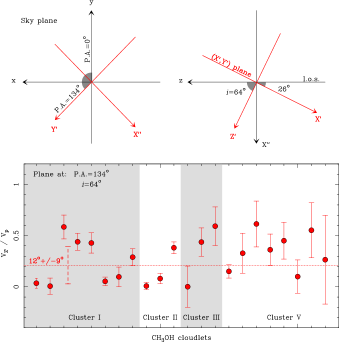
Having on hand the information of the full-space motion of the CH3OH gas, we searched for the existence of a preferential plane of gas motion, as it would be expected in the presence of a disk. With reference to the upper panel of Fig. 3, we made two consecutive rotations of the original reference system in equatorial coordinates (R.A. x, Dec. y): 1) we projected the maser proper motions on the () reference system, rotated by an angle “P.A.” on the plane of the sky; 2) taking into account also the LSR velocity components, we followed a second projection onto the reference system (), obtained by rotating the coordinates () around the axis by an angle “i”. We iteratively explored the full range of () plane orientations varying “P.A.” and “i” in the ranges 0–360 and 0–90, respectively. At each run, we calculated the ratio between the maser velocity components perpendicular () and parallel () to the plane (), in order to estimate how well the velocity vectors accommodate into the () plane. The upper panel of Fig. 3 shows the orientation of the best plane (in red) which minimizes the weighted average ratio for the maser sample of 24 cloudlets. This plane intersects the plane of the sky along a line at P.A. of 134 and it is inclined by 26 with respect to the line-of-sight. In the lower panel of Fig. 3, we plot the ratio 1 for each maser cloudlet separately (dots and errorbars). We do not plot the two masers belonging to Cluster IV, because they have motions of less than 0.5 km s-1 and high relative uncertainties. The weighted average of the sample is drawn with a dashed horizontal line in the lower panel of Fig. 3, and corresponds to a residual inclination of 12 9 with respect to the plane (). Alternatively, this inclination corresponds to an average velocity component of 0.5 km s-1 away from the plane.
The best-fit plane (hereafter, the equatorial plane), over which CH3OH masers move, is coincident with the orientation of the flattened core observed by Patel et al. (2005) within about (“P.A.” and “i” of 121 and 62, respectively). It is also worth noting that the orientation of the radio jet, at a P.A. near (Curiel et al. 2006, their Table 2), coincides with the minor axis of the equatorial plane as projected onto the sky ( in Fig. 3). These findings support the interpretation that the core emission imaged by Patel et al. belongs to a continuous structure, which extends along the equatorial plane of gas motion. In the next section, we analyze the gas motion in the equatorial plane and show that maser cloudlets participate of a global infall towards HW2.
4.2 Analysis of the planar motion around HW2
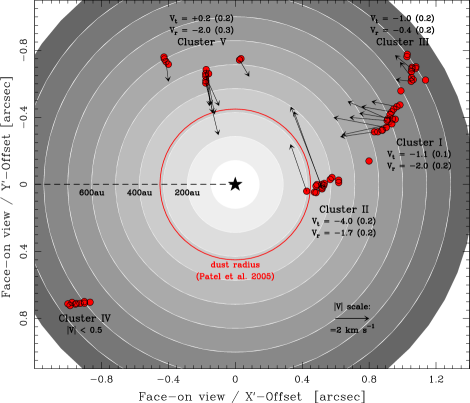
Knowing the orientation of the equatorial plane, we can produce a face-on view of the CH3OH maser velocities in this plane. In Fig. 4, we plot the position of the CH3OH cloudlets (red dots) projected onto the equatorial plane. We set the origin of the plot at the position of HW2 as defined by Curiel et al. (2006). Each cluster of maser emission is labeled according to Fig. 2 for comparison. The result shown in Fig. 4 is independent of any assumption about the maser geometry. Individual centers of maser emission do not origin at a same distance from the star. Maser emission is excited over a range of radii between 300 au and 900 au from HW2. The inner radius coincides with the extent of the dust emission (hereafter, the dust radius) at a wavelength of 0.9 mm (red circle in Fig. 4). A disk radius of about 300 au also marks the boundary where hydrogen density might exceeds a threshold of 108 cm-3 (Kuiper et al. 2015, their Fig. 9), above which the CH3OH maser transition at 6.7 GHz is quenched (Cragg et al. 2005).
The black arrows in Fig. 4 give the magnitude and direction of the velocity vectors in the equatorial plane. Since maser cloudlets belonging to a given cluster show ordered velocity vectors, for each cluster we derived a group motion in the radial () and tangential () directions with respect to HW2. These values are reported together with the cluster labels in Fig. 4. A negative radial velocity corresponds to an inward motion towards HW2; a negative tangential velocity indicates a counterclockwise rotation around HW2. For radii between 300 au and 800 au (clusters I, II, and V), maser velocities have an average inward component of about km s-1 within an uncertainty of 0.2 km s-1. We explicitly note that the existence of a planar infall toward HW2 supports, in turn, the existence of an accretion disk. At the loci sampled by the maser emission, the magnitude of the infalling motions appears to be almost constant with the distance from the star within the uncertainties. Outside a radius of 800 au (clusters III and IV), the radial component is more than four times slower (0.5 km s-1) than in the inner regions. On the other hand, there is no clear pattern for the tangential velocity outside a radius of 300 au from the star: clusters I and III have a consistent tangential component of about km s-1, clusters IV and V have a tangential component near zero, and cluster II has the faster tangential component of km s-1. We do not have enough maser points around the star to study the dependence (if any) of the tangential velocity with the azimuthal angle.
4.3 Estimate of the central mass of HW2
Interestingly, the maser cluster (II) closer to the star exhibits the higher value of tangential velocity. If we assume that this tangential component represents an ordered rotational motion around HW2, we can evaluate the enclosed mass within the dust radius. Assuming Keplerian rotation, for a rotational velocity of 4 km s-1 and a radius of 315 au, derived from the deconvolved size of the dust continuum map of Patel et al. (2005), one infers a central mass of 5.5 M⊙. A ZAMS star with a mass of 6 M⊙ and a radius of 3 R⊙ has a bolometric luminosity of 1 (e.g., Schaller et al. 1992), one tenth of the bolometric luminosity associated with the HW2 object. An additional contribution to the total luminosity might come from accretion. We make use of the infalling motion measured with the masers to estimate the mass infall rate onto the star. In spherical symmetry, for an hydrogen density of 108 cm-3 at a distance of 300 au from the central object, an infall velocity of 2 km s-1 implies an accretion rate of 3 yr-1. If the same infall rate reaches the star surface, the accretion luminosity of 9 would dominate the total luminosity. Taking into account that the infalling mass is channeled through the disk onto the star within a small solid angle, the accretion rate might be reduced by a factor 0.1 for a flared disk with opening angle of . Under these conditions, the total budget of stellar and accretion luminosities would account for a bolometric luminosity of about 2 .
Different lines of evidence suggest the presence of an ordered magnetic field in the inner 1000 au of HW2, which might reconcile the kinematic estimate of the stellar mass with a bolometric luminosity of the order of 1 . Recently, Fernández-López et al. (2016) reported about CARMA dust polarization observations at 1.3 mm in the vicinity of HW2. The dust polarization vectors align in a direction (57 6) roughly parallel to the minor axis of the accretion disk on the plane of the sky ( in Fig. 3). If the main cause of polarized emission is grain alignment via magnetic forces, Fernández-López et al. propose a scenario where an uniform magnetic field is threading the accretion disk of HW2. At the scale of individual pockets of gas of a few au in size, the linearly polarized emission of the OH, H2O, and CH3OH masers still shows coherent polarization vectors either parallel or perpendicular to the same axis of Fig. 3 (Bartkiewicz et al. 2005; Vlemmings et al. 2006, 2010). The presence of a magnetic field might result in rotational velocities less than half the expected Keplerian velocity at a given radius, as depicted in Fig. 7 of Seifried et al. (2011). In the case of HW2, if the tangential velocity measured with the masers were (magnetically) reduced by a factor as small as of the pure Keplerian rotation, the revised mass estimate would amount to 10 M⊙ and would imply a ZAMS luminosity of about 1 (e.g., Eq. 13 of Hosokawa et al. 2010).
4.4 Comparison with previous models
In order to explain the CH3OH maser distribution around HW2, previous models assumed that the maser emission arises along a circular ring (Torstensson et al. 2008; Vlemmings et al. 2010; Torstensson et al. 2011; Sugiyama et al. 2014). Maser positions were fitted by an elliptical ring on the plane of the sky, with free parameters the major (2 a) and minor axes of the ellipse, the position angle of the major axis (P.A.ell), and the center of the ellipse. If the ellipse is the projection of a circular ring tilted with respect to the line-of-sight, the inclination (i) of the circular ring is determined from the ratio of the minor-to-major axes of the ellipse. Since the molecular outflow entrained by the radio jet has the blueshifted lobe to the NE, and the free-free optical depth of the radio jet favors the brightest masers to be on the near side of the ring, Torstensson et al. first argued that maser clusters I and II have to lie on the near side of the ring. Under these conditions, the plane of the circular ring would be oriented at a position angle (P.A.ell) between 99 and 110, with an inclination (i) betwen 68 and 73; the ring radius (a) would range between 650 au and 680 au (Vlemmings et al. 2010; Torstensson et al. 2011; Sugiyama et al. 2014). The position angle of the equatorial plane derived in Sect. 4.1 differs by about 30 w.r.t. the plane of the circular ring; the radius of the circular ring approximates the average distance of the maser cloudlets w.r.t. HW2 (Fig. 4).
To explain the three-dimensional magnetic field configuration around HW2, as inferred from the 6.7 GHz maser emission, Vlemmings et al. also proposed that the maser cloudlets might be detached by a few 100 au from the equatorial plane. Maser cloudlets would move along the magnetic field lines at the edge of the disk, where the lines warp towards the central core (Fig. 6 of Vlemmings et al. 2010). This picture might still hold even if the maser emission does not arise at a constant radius, since the toroidal magnetic field lines would thread the disk plane at different radii from the central star. The current analysis does not rule out that the maser cloudlets may lie at small heights (h) above the equatorial plane (h 100 au), provided that the velocity field is still mainly planar (e.g., Fig. 9 of Seifried et al. 2011).
Torstensson et al. compared the line-of-sight velocities of the maser emission with those expected for a circular ring either in Keplerian rotation or with a dominant radial motion. They inferred negligible Keplerian rotation and proposed that the ring itself is contracting towards HW2 with a velocity of the order of 1 km s-1. Sugiyama et al. also measured the 6.7 GHz maser proper motions with the Japanese VLBI Network (JVN). They modeled the three-dimensional velocity field of the CH3OH gas as the composition of a radial and tangential velocity with respect to the ring, and derived a global infalling motion of 2.0 0.6 km s-1 and a rotational velocity near zero. These results generally agree with our analysis when the group velocities of each cluster are averaged all together (Fig. 4). It is worth noting that the EVN observations have a beam size 2 times smaller than the JVN observations, and 4 times better spectral resolution, which eventually allow us to obtain proper motion measurements about 3 times more accurate than the JVN measurements. On the one hand, since we measure a constant radial motion between radii of 300 au and 800 au, this finding explains why Sugiyama et al. inferred a similar infalling velocity at constant radius. On the other hand, by removing the constraint of constant radius, we are able to distinguish different tangential velocities associated with the five maser clusters.
5 Conclusions
We tested the existence of an equatorial plane of gas motion around Cepheus A HW2 by measuring the three-dimensional velocity vectors of the 6.7 GHz CH3OH maser cloudlets. Maser velocities are measured with an accuracy of a few 0.1 km s-1. Our results can be summarized as follow:
-
1.
We show that the motions of the CH3OH maser cloudlets are dominated by a planar component. Its plane is inclined by 26 with the line-of-sight, and intersects the plane of the sky along a line at a P.A. of 134. The orientation of this plane coincides, within about 10, with that of the core emission imaged by Patel et al. (2005), after assuming that dust and high-density gas move on circular orbits. This result supports the interpretation that the core emission surrounding HW2 represents a continuous structure, rather than being a projection of different hot cores along the line-of-sight.
-
2.
The three-dimensional velocity field of the CH3OH masers shows that the CH3OH gas is contracting towards HW2 at a velocity of about 2 km s-1, between radii of 300 and 900 au from HW2. This velocity component implies an accretion rate of the order of yr-1 at a distance of 300 au from the star. The existence of a planar infall toward HW2 supports, in turn, the existence of an accretion disk.
-
3.
At a radius of 300 au from HW2, we measure a rotational component of about 4 km s-1. The simple assumption of pure Keplerian rotation would result into a central mass of 5–6 M⊙, which would account for only a minor fraction of the bolometric luminosity of the HW2 object. If the rotational velocities measured with the masers were sub-Keplerian by a factor as small as , as it can be expected under the influence of a weak magnetic field, that could reconcile the values of the (kinematic) stellar mass and luminosity. The presence of a magnetic field is supported by the recent detection of an ordered dust polarization field surrounding HW2, and can be tested with the 6.7 GHz maser observations once a new model for the polarized emission of this maser transition will be available.
Acknowledgements.
The European VLBI Network is a joint facility of independent European, African, Asian, and North American radio astronomy institutes. Scientific results from data presented in this publication are derived from the following EVN project code(s): ES071. Comments from an anonymous referee are gratefully acknowledged. Financial support by the Deutsche Forschungsgemeinschaft (DFG) Priority Program 1573 is gratefully acknowledged. A.M. Sobolev is financially supported by the Russian Science Foundation (project no. 15-12-10017). We thank W.H.T. Vlemmings for fruitful discussions in preparation. We are grateful to I. Jiménez-Serra for providing us with the HC3N map shown in Fig.2.References
- Bartkiewicz et al. (2005) Bartkiewicz, A., Szymczak, M., Cohen, R. J., & Richards, A. M. S. 2005, MNRAS, 361, 623
- Brogan et al. (2007) Brogan, C. L., Chandler, C. J., Hunter, T. R., Shirley, Y. L., & Sarma, A. P. 2007, ApJ, 660, L133
- Comito et al. (2007) Comito, C., Schilke, P., Endesfelder, U., Jiménez-Serra, I., & Martín-Pintado, J. 2007, A&A, 469, 207
- Cragg et al. (2005) Cragg, D. M., Sobolev, A. M., & Godfrey, P. D. 2005, MNRAS, 360, 533
- Curiel et al. (2006) Curiel, S., Ho, P. T. P., Patel, N. A., et al. 2006, ApJ, 638, 878
- De Buizer et al. (2016) De Buizer, J. M., Liu, M., Tan, J. C., et al. 2016, ArXiv e-prints [arXiv:1610.05373]
- Dzib et al. (2011) Dzib, S., Loinard, L., Rodríguez, L. F., Mioduszewski, A. J., & Torres, R. M. 2011, ApJ, 733, 71
- Fernández-López et al. (2016) Fernández-López, M., Stephens, I. W., Girart, J. M., et al. 2016, ApJ, 832, 200
- Garay et al. (1996) Garay, G., Ramirez, S., Rodriguez, L. F., Curiel, S., & Torrelles, J. M. 1996, ApJ, 459, 193
- Goldsmith et al. (1982) Goldsmith, P. F., Snell, R. L., Deguchi, S., Krotkov, R., & Linke, R. A. 1982, ApJ, 260, 147
- Herbst & van Dishoeck (2009) Herbst, E. & van Dishoeck, E. F. 2009, ARA&A, 47, 427
- Hosokawa et al. (2010) Hosokawa, T., Yorke, H. W., & Omukai, K. 2010, ApJ, 721, 478
- Hughes & Wouterloot (1984) Hughes, V. A. & Wouterloot, J. G. A. 1984, ApJ, 276, 204
- Jiménez-Serra et al. (2009) Jiménez-Serra, I., Martín-Pintado, J., Caselli, P., et al. 2009, ApJ, 703, L157
- Keimpema et al. (2015) Keimpema, A., Kettenis, M. M., Pogrebenko, S. V., et al. 2015, Experimental Astronomy [arXiv:1502.00467]
- Kuiper et al. (2015) Kuiper, R., Yorke, H. W., & Turner, N. J. 2015, ApJ, 800, 86
- Kun et al. (2008) Kun, M., Kiss, Z. T., & Balog, Z. 2008, Star Forming Regions in Cepheus, ed. B. Reipurth, 136
- Lankhaar et al. (2016) Lankhaar, B., Groenenboom, G. C., & van der Avoird, A. 2016, J. Chem. Phys., 145, 244301
- Menten (1991) Menten, K. M. 1991, ApJ, 380, L75
- Moscadelli et al. (2009) Moscadelli, L., Reid, M. J., Menten, K. M., et al. 2009, ApJ, 693, 406
- Moscadelli et al. (2011) Moscadelli, L., Sanna, A., & Goddi, C. 2011, A&A, 536, A38
- Moscadelli et al. (2010) Moscadelli, L., Xu, Y., & Chen, X. 2010, ApJ, 716, 1356
- Mueller et al. (2002) Mueller, K. E., Shirley, Y. L., Evans, II, N. J., & Jacobson, H. R. 2002, ApJS, 143, 469
- Patel et al. (2005) Patel, N. A., Curiel, S., Sridharan, T. K., et al. 2005, Nature, 437, 109
- Rodriguez et al. (1994) Rodriguez, L. F., Garay, G., Curiel, S., et al. 1994, ApJ, 430, L65
- Sanna et al. (2010) Sanna, A., Moscadelli, L., Cesaroni, R., et al. 2010, A&A, 517, A71
- Schaller et al. (1992) Schaller, G., Schaerer, D., Meynet, G., & Maeder, A. 1992, A&AS, 96, 269
- Seifried et al. (2011) Seifried, D., Banerjee, R., Klessen, R. S., Duffin, D., & Pudritz, R. E. 2011, MNRAS, 417, 1054
- Sugiyama et al. (2008a) Sugiyama, K., Fujisawa, K., Doi, A., et al. 2008a, PASJ[arXiv:0804.4623]
- Sugiyama et al. (2008b) Sugiyama, K., Fujisawa, K., Doi, A., et al. 2008b, PASJ[arXiv:0710.4872]
- Sugiyama et al. (2014) Sugiyama, K., Fujisawa, K., Doi, A., et al. 2014, A&A, 562, A82
- Torrelles et al. (2011) Torrelles, J. M., Patel, N. A., Curiel, S., et al. 2011, MNRAS, 410, 627
- Torrelles et al. (2007) Torrelles, J. M., Patel, N. A., Curiel, S., et al. 2007, ApJ, 666, L37
- Torstensson et al. (2008) Torstensson, K., van Langevelde, H. J., Vlemmings, W., & van der Tak, F. 2008, in The role of VLBI in the Golden Age for Radio Astronomy, 39–44
- Torstensson et al. (2011) Torstensson, K. J. E., van Langevelde, H. J., Vlemmings, W. H. T., & Bourke, S. 2011, A&A, 526, A38
- Vlemmings et al. (2006) Vlemmings, W. H. T., Diamond, P. J., van Langevelde, H. J., & Torrelles, J. M. 2006, A&A, 448, 597
- Vlemmings et al. (2010) Vlemmings, W. H. T., Surcis, G., Torstensson, K. J. E., & van Langevelde, H. J. 2010, MNRAS, 404, 134
| Feature | VLSR | Fpeak | Vx | Vy | ||
|---|---|---|---|---|---|---|
| # | (km s-1) | (Jy beam-1) | (mas) | (mas) | (km s-1) | (km s-1) |
| Cluster I: mean LSR velocity of –2.31 km s-1 | ||||||
| 1 | –1.68 | 1.04 (3rd) | … | … | ||
| 2 | –1.73 | 22.84 (1st) | ||||
| … | … | … | … | |||
| … | … | … | … | |||
| 3 | –1.90 | 0.57 (1st) | ||||
| 4 | –2.03 | 1.81 (1st) | … | … | ||
| 5 | –2.17 | 4.07 (1st) | ||||
| 6 | –2.30 | 52.18 (1st) | ||||
| … | … | … | … | |||
| … | … | … | … | |||
| 7 | –2.30 | 3.09 (1st) | … | … | ||
| 8 | –2.47 | 32.57 (1st) | ||||
| … | … | … | … | |||
| … | … | … | … | |||
| 9 | –2.47 | 24.08 (1st) | ||||
| … | … | … | … | |||
| 10 | –2.65 | 6.43 (1st) | … | … | ||
| … | … | … | … | |||
| 11 | –2.82 | 7.65 (1st) | ||||
| … | … | … | … | |||
| … | … | … | … | |||
| 12 | –2.91 | 0.94 (1st) | ||||
| 13 | –2.91 | 0.20 (3rd) | … | … | ||
| 14 | –3.00 | 0.25 (1st) | … | … | ||
| 15 | –3.00 | 0.15 (3rd) | … | … | ||
| Cluster II: mean LSR velocity of –2.44 km s-1 | ||||||
| 16 | –0.10 | 0.08 (3rd) | … | … | ||
| 17 | –0.45 | 0.78 (3rd) | … | … | ||
| 18 | –0.45 | 0.08 (3rd) | … | … | ||
| 19 | –0.94 | 0.13 (1st) | … | … | ||
| 20 | –1.20 | 0.21 (3rd) | … | … | ||
| 21 | –1.33 | 0.07 (3rd) | … | … | ||
| 22 | –1.81 | 1.67 (3rd) | … | … | ||
| 23 | –2.17 | 1.65 (3rd) | … | … | ||
| 24 | –2.42 | 9.42 (3rd) | … | … | ||
| 25 | –2.61 | 7.59 (3rd) | … | … | ||
| 26 | –2.69 | 1.67 (3rd) | … | … | ||
| 27 | –2.78 | 1.25 (1st) | ||||
| 28 | –2.82 | 0.86 (1st) | ||||
| 29 | –3.18 | 0.78 (1st) | ||||
| 30 | –3.22 | 0.68 (1st) | … | … | ||
| 31 | –3.44 | 0.59 (1st) | … | … | ||
| Cluster III: mean LSR velocity of –3.63 km s-1 | ||||||
| 32 | –3.35 | 0.41 (1st) | … | … | ||
| 33 | –3.44 | 2.37 (1st) | ||||
| 34 | –3.52 | 0.37 (3rd) | … | … | ||
| 35 | –3.53 | 2.52 (1st) | ||||
| 36 | –3.61 | 0.83 (3rd) | … | … | ||
| 37 | –3.62 | 1.49 (2nd) | … | … | ||
| 38 | –3.66 | 10.84 (1st) | … | … | ||
| 39 | –3.66 | 5.38 (1st) | … | … | ||
| 40 | –3.66 | 3.02 (1st) | ||||
| 41 | –3.66 | 2.60 (1st) | … | … | ||
| 42 | –3.70 | 1.45 (1st) | … | … | ||
| 43 | –4.49 | 0.10 (2nd) | … | … | ||
| Cluster IV: mean LSR velocity of –4.05 km s-1 | ||||||
| 44 | –3.88 | 5.88 (1st) | … | … | ||
| 45 | –3.88 | 3.42 (1st) | … | … | ||
| 46 | –3.92 | 5.28 (1st) | … | … | ||
| 47 | –4.01 | 19.93 (1st) | ||||
| 48 | –4.01 | 5.28 (1st) | … | … | ||
| 49 | –4.05 | 13.62 (1st) | … | … | ||
| 50 | –4.19 | 17.16 (1st) | … | … | ||
| … | … | … | … | |||
| 51 | –4.27 | 1.36 (1st) | … | … | ||
| 52 | –4.32 | 3.19 (1st) | ||||
| Cluster V: mean LSR velocity of –4.54 km s-1 | ||||||
| 53 | –4.36 | 1.55 (1st) | ||||
| 54 | –4.36 | 1.10 (1st) | … | … | ||
| 55 | –4.41 | 1.30 (1st) | … | … | ||
| 56 | –4.41 | 0.24 (3rd) | … | … | ||
| 57 | –4.54 | 0.26 (1st) | ||||
| 58 | –4.58 | 0.90 (1st) | ||||
| 59 | –4.67 | 0.51 (1st) | ||||
| 60 | –4.71 | 1.78 (1st) | ||||
| 61 | –4.80 | 0.29 (1st) | ||||
| 62 | –4.80 | 0.29 (1st) | ||||
| 63 | –4.93 | 0.18 (1st) | ||||
| 64 | –4.93 | 0.07 (1st) | … | … | ||