Exponential profiles from stellar scattering off interstellar clumps and holes in dwarf galaxy discs
Abstract
Holes and clumps in the interstellar gas of dwarf irregular galaxies are gravitational scattering centers that heat field stars and change their radial and vertical distributions. Because the gas structures are extended and each stellar scattering is relatively weak, the stellar orbits remain nearly circular and the net effect accumulates slowly over time. We calculate the radial profile of scattered stars with an idealized model and find that it approaches an equilibrium shape that is exponential, similar to the observed shapes of galaxy discs. Our models treat only scattering and have no bars or spiral arms, so the results apply mostly to dwarf irregular galaxies where there are no other obvious scattering processes. Stellar scattering by gaseous perturbations slows down when the stellar population gets thicker than the gas layer. An accreting galaxy with a growing thin gas layer can form multiple stellar exponential profiles from the inside-out, preserving the remnants of each Gyr interval in a sequence of ever-lengthening and thinning stellar subdiscs.
keywords:
galaxies:evolution — galaxies: kinematics and dynamics1 Introduction
The origin of the exponential radial profile for surface brightness and mass surface density in galaxy discs is not well understood (van der Kruit & Freeman, 2011). Cosmological collapse models get exponential discs without fine tuning (Sánchez-Blázquez, 2009; Cooper, 2013; Aumer & White, 2013; Aumer et al., 2013; Stinson et al., 2013; Martig, et al., 2014; Herpich et al., 2015; Minchev et al., 2016; Rathaus & Sternberg, 2016), so the angular momentum distribution of the gas in the halo is one important factor (Mestel, 1963; Freeman, 1970). This may explain why the exponential profile is established early on, out to redshift in Fathi et al. (2012) and in clumpy discs at (Elmegreen et al., 2005), and why it is also present in extended outer gas discs today, where there has been little star formation (Bigiel & Blitz, 2012; Wang et al., 2014).
Other processes move stars radially in the disc after they form. Wet major mergers in the simulations by Athanassoula (2016) formed a Type I disc in the reaccreted remnants (Type I is a single, continuous exponential profile, see Freeman, 1970). Mergers in Borlaff et al. (2014) selected from a hydrodynamic N-body database to resemble S0s tended to have Type III exponentials (i.e., profiles with two exponential segments, the outer one shallower than the inner one; Pohlen & Trujillo, 2006). Stars also scatter outward with bar torques (Hohl, 1971; Debattista et al., 2006) forming type II (a double exponential with a steeper outer segment) or Type III exponentials (Head et al., 2015), with breaks between the two components at bar or bar+spiral resonances (Muñoz-Mateos et al., 2013; Laine et al., 2014). Stars churn back and forth through corotation in spiral arms (Sellwood & Binney, 2002), causing radial migration when there are recurrent transient spirals (Roškar et al., 2008; Minchev et al., 2012; D’Onghia et al., 2013; Vera-Ciro, et al., 2014; Grand et al., 2015a; Berrier & Sellwood, 2015) and mixing stars with different elemental abundances (Roškar et al., 2008) in agreement with observations (Edvardsson et al., 1993). Satellite galaxies (Grand et al., 2015b), and giant gaseous clumps in the disc (Bournaud et al., 2007) also move stars radially.
The question we wish to address here is why these relocated stars settle into an exponential form, or a piecewise exponential form for the Types II and III. For example, it seems remarkable that galaxies with U-shaped color (Bakos et al., 2008; Yoachim et al., 2012) or age (Roediger et al., 2012; Ruiz-Lara et al., 2016) profiles can have a mass profile that is a single exponential even if the light profile is Type II (Zheng et al., 2015). How does the disc mass know it should have an exponential form when the two parts form in different ways, the inner part by star formation with spiral and bar torques, and the outer part by radial migration? Why should both parts of the broken profiles in Types II and III be exponential, regardless of whether the stars were put there by bars, spirals, interactions, or star formation? There is something fundamental about the exponential shape in a galaxy disc. In Elmegreen & Struck (2013, hereafter Paper I), we considered the driver to be random scattering itself, regardless of the source. A theoretical stochastic model for scattering with this property was discussed in Elmegreen & Struck (2016).
A good laboratory for studying these questions is a dwarf Irregular (dIrr) galaxy, which has no spirals and often no bar or obvious companions (Hunter et al., 2006), and yet it has an exponential or piecewise exponential radial profile in optical through infrared light and in mass (Hunter et al., 2011; Herrmann et al., 2013, 2016). If stellar scattering is important for establishing or maintaining this profile, then the scattering masses cannot be spirals or bars. Their stellar discs are usually smooth. Even the stellar clusters and OB associations that make them look irregular in H and blue light have little mass compared to the underlying discs (Zhang et al., 2012).
Stellar scattering off of gas irregularities in dIrr galaxies may be a good alternative to scattering off of spirals and bars. The surface densities of many dIrrs are dominated by gas, especially in their outer parts. For example, figures 24-27 in Leroy et al. (2008) show the radial profiles of surface mass density for gas and stars in 4 dIrr galaxies. The gas dominates the stars by a factor from 1.4 in the inner parts to over 8 in the outer parts in DDO 154, it dominates by a factor of 5 throughout Ho I, and by a factor up to in the main disks and outer parts of the other two dIrrs. Also, the middle column of figure 8 and table 2 in Elmegreen & Hunter (2015) compare gas and stellar surface density profiles in 20 local dIrr galaxies in the LITTLE THINGS survey. The average surface density for stars ranges from pc-2 to pc-2 between the center and 4 disk scale lengths in these 20 galaxies, while the average surface density for gas ranges from pc-2 to pc-2 over the same radial range. Thus the gas ranges between a factor of 2 higher surface density than the stars in the inner part to a factor of 10 higher in the outer part for these dIrrs. Similarly, in a survey of 148 isolated dwarf galaxies in the stellar mass range from to (the upper limit is approximately the mass of the Large Magellanic Cloud; James & Ivory, 2011), the median atomic gas fraction among baryons is and the gas fraction inversely correlates with stellar surface density (Bradford et al., 2015). Gas-rich dwarfs like this are distinct from dwarf Spheroidals. Local group dwarfs in the stellar mass range are gas poor inside the virial radii of the Milky Way and M31, presumably because of environmental effects (Spekkens et al., 2014; Weisz et al., 2014).
Extensive observations show that the gas is highly irregular in gas-rich dIrrs. There are large clouds of atomic gas (Hunter et al., 2001; Kim et al., 2007) and numerous shells and holes that result from star formation feedback (Yang & Skillman, 1993; Kim et al., 1999; Lozinskaya, et al., 2009; Egorov et al., 2010; Warren et al., 2011; Bagetakos et al., 2011; Kaczmarek, Jane F.; Wilcots, 2012; Pokhrel et al., 2016; Egorov et al., 2016). These structures extend for tens to hundreds of parsecs. The largest may contain a total mass or mass displacement amounting to one percent of the galaxy stellar mass. For example, the dIrr galaxy IC 2574 has a dynamical mass of and contains HI holes with the largest displacing of gas and 7 others displacing over of gas (Walter & Brinks, 1999). Similarly, Ho II has a dynamical mass of and a largest hole displacement of in gas; 11 others displace over (Puche et al., 1992).
Interstellar gas irregularities of this magnitude should deflect the orbits of field stars (Spitzer & Schwarzschild, 1953). The origin of the irregularities themselves is not important. Giant clouds could form in the compressed regions between shells and supershells, for example, (e.g., Chernin et al., 1995; Yamaguchi et al., 2001; Inutsuka et al., 2015), especially if the Toomre parameter is too large for gravitational instabilities to be active (as observed by Elmegreen & Hunter, 2015). If a particular irregularity lasts for a shear time (Bagetakos et al., 2011), then that would be long enough to have a significant cumulative effect on stars for some distance away. This distance can be determined as follows. Consider stars a distance away from a cloud, measured in the plane, and moving at a speed that is the stellar velocity dispersion, . If is the angular rotation rate of the galaxy and is its radial derivative, then the time for shear to move parts of the cloud further from the star than the distance is . The time for the star to move past the cloud is . For significant scattering by that one cloud, we need the first time to exceed the second, or . For a rotation curve , this limit becomes . Rotation curves in dIrr galaxies are slowly rising, so is significantly larger than 0, e.g., . Also, the rotation speeds are slow so or more. Then can be large, like 0.8 or 1, which means that a significant number of stars have time to react to the force of the cloud before it shears away.
The transient nature of interstellar clouds and holes does not matter much for stellar scattering anyway. As long as clouds and holes are present on a steady-state basis, with new structures replacing old structures regularly, there will always be the types of perturbations that we model here, even if the individual forcings change with time. If one cloud starts to scatter a particular star and then a younger cloud takes over after a short time, the star is still scattered. The most important property of scattering is that it changes stellar orbits from approximately circular at birth, owing to the low velocity dispersion of the gas, to increasingly eccentric after the star random walks for a while among numerous scattering centers. Also, because the cloud and hole perturbation masses are much larger than a star’s mass, each scattering event approximately conserves stellar orbital energy. The result is a net loss of angular momentum for an increasingly eccentric orbit at constant energy. Thus scattering like this has a net bias toward smaller radius, and then the exponential radial profiles follows mathematically as an equilibrium solution to the stochastic process (Elmegreen & Struck, 2016).
Large clouds and holes in dIrrs are soft mass perturbations that scatter stars by relatively small amounts with each interaction. They are like flocculent spiral arms in this respect (Vera-Ciro, et al., 2014). Still, their cumulative effect can be important for the long-term rearrangement of orbits (Paper I). This situation differs from the case of young galaxies where interstellar clumps are more massive compared to the galaxy, and stellar scattering is faster (Bournaud et al., 2007). It also differs from stellar scattering in a time-changing central potential (Governato et al., 2012; El-Badry et al., 2015), which is rapid too. In both cases the resulting orbits are eccentric, as observed today in the Milky Way thick disc (Liu & van de Ven, 2012), which formed at these early times (Bournaud et al., 2009; Bird et al., 2013; Robin et al., 2014; Comerón et al., 2014; Aumer et al., 2016).
Here we show that large, low-density perturbations with a range of masses comparable to what is observed for interstellar clumps and holes in dIrr galaxies can make an exponential profile from a uniform initial profile in only Gyr. This initial profile is arbitrary, selected as an extreme case of a non-exponential shape only to show the speed of the profile adjustment. If the distributions of halo angular momentum and disc torques give a different initial profile for stars, or if a disruptive event changes the profile, then cloud and hole scattering will return the disc to an exponential.
Stellar scattering off interstellar clouds has long been viewed as a mechanism to increase the stellar velocity dispersion (Spitzer & Schwarzschild, 1953; Lacey, 1984). Observations of the dIrr galaxy WLM (Leaman et al., 2012) and theoretical considerations (e.g., Gustafsson et al., 2016; Aumer et al., 2016) support this model. These studies did not consider the influence of cloud-star scattering on the stellar radial profile, however, and that is the purpose of the present work. We also illustrate that interstellar holes are as effective in scattering stars as interstellar clouds. In a real dwarf Irregular galaxy, both holes and clouds should act together to increase the stellar velocity dispersion and form or maintain the exponential radial profile.
2 Models
We wish to isolate the physical process of greatest interest here, which is stellar scattering from mass structures in the disc of a galaxy. We do not want these processes to be confused with additional things that happen in galaxies, such scattering from bars and spirals. This isolation of pure scattering is a great simplification – not unlike the simplification made for analytical models of star-GMC scattering (Lacey, 1984) except that here we can study the redistribution of stars in radius too. The approximation is also reasonable for dIrr galaxies because they have no spirals.
The model is based on a numerical integration of the motion of approximately 15,600 test particle ‘stars’ using the MATLAB Runge-Kutta routine ‘ode23.’ These particles are initially placed in circular orbits in a fixed gravitational potential and allowed to interact gravitationally with some finite number of scattering objects (clouds or holes).
We extend our previous two-dimensional models in several ways. First, the new models are computed in three dimensions to account for saturation effects when the disc gets thick (Sec. 3.3). Second, we use diffuse clumps in one case and holes in another case. Both clumps and holes perturb the orbits of stars. Third, we use three-part mass and size spectra to represent these perturbations, following observations in Kim et al. (2007), Oey & Clarke (1997), Bagetakos et al. (2011) and others. These spectra seem to have a universal slope in galaxies. Analytical models show that the stellar heating rate from cloud scattering depends on the product of the cloud surface density and the cloud mass (Lacey, 1984). For a power law cloud mass spectrum, the rate depends on the integral over this spectrum. If the slope of the mass spectrum is shallower than on a log-log plot, then this integral is dominated by the mass of the largest cloud, and the spectral slope enters only weakly as a coefficient. The same argument applies to star-hole scattering. This is the case here, so the results do not depend much on the mass spectra.
We begin with the parameters used to scale the (dimensionless) calculations. In Paper I we used two sets of scaling parameters, one for a typical spiral disc and another for a dwarf galaxy disc. Here we are most interested in the latter case and adopt the scaling factors used for it. Specifically, these include a gravitational or halo scale length kpc, and a corresponding velocity of km s-1. Then we have a time scaling of Myr, a mass scale of and a rotation period at of Myr.
We use a (dark halo) gravitational acceleration of the form,
| (1) |
where the 0.2 factor is an arbitrary softening constant, and is the central radius in three dimensions. In this potential the disc has a circular velocity that increases gradually as , where is the projected radius within the disc, and a gravitational mass within a radius of . This slowly rising rotation curve is comparable to that observed in dIrr galaxies (Oh et al., 2015). We choose an initial maximum disc size of 9 units, which equals kpc in the adopted scaling and has a halo mass enclosed within that radius of . We estimate the baryonic mass as about one-tenth of this, and the gas mass as about 40% of that, or . These values are not based on any specific model, but are consistent with the observations of IC 2574 (Walter & Brinks, 1999).
An additional force is added in the vertical () direction to roughly represent the local disc gravity. The adopted form of this acceleration is linear in , and with a magnitude that allows a reasonably thick disc, as observed in dIrrs (Elmegreen & Hunter, 2015). Specifically,
| (2) |
Other forms of vertical acceleration were tested, including a constant and one that scales as . These altered the disc thickness, but did not significantly change other results described below.
As in Elmegreen & Struck (2013) the perturbing clumps or holes are initially distributed uniformly in radius (giving a surface density profile) and at random azimuths on circular orbits. Clumps or holes of all different sizes (see below) are distributed in the same manner. Realistically, the larger clumps and holes might be more confined to the central regions, in which case we are over-estimating, or speeding up, scattering in the outer regions. The clumps follow circular orbits at their initial radii for the whole of the simulation. This circularity is another approximation because real clumps and holes should grow and disperse over time, possibly also changing their positions in the disc. We showed above that shear is too slow to affect the results as long as the number density of the irregularities is about constant in time. Chance alignments of the scattering centers generate small stellar wakes.
The fiducial clouds model uses a clump mass spectrum with a slope of in a log-log distribution. This is similar to the observed cloud mass spectrum in a the Milky Way (Heyer et al., 2001) and LMC (Kim et al., 2007). Then, with of the most massive clouds, each of mass units , we use intermediate-mass clouds with each, and low-mass clouds with each. This adds up to a total of ; any additional gas is assumed to be in a smooth form that does not scatter stars.
The corresponding cloud radii are: units pc, 200 pc and 100 pc, respectively, which implies that the size spectrum has an average slope of on a log-log plot. The cloud radius is simulated as a smoothing length for the equation of force between the cloud and the star particles. The star particles do not interact with each other, so there is no smoothing length needed for star-star gravity. Also because the stars are non-interacting, their number in the simulation does not matter for the result except to make a smooth enough distribution that the disc evolution can be seen.
For the holes models, we assume hole sizes and masses like the clump sizes and masses of the previous paragraph, but with negative mass. For comparison, Oey & Clarke (1997) observed a hole size spectrum for the Small Magellanic Cloud with a slope on a log-log plot of , while Bagetakos et al. (2011) observed a slope of , in agreement with our value. In order to estimate the mass that can be evacuated from specified holes we need a rough model of the gas disc. We assume that the gas surface density profile also has an approximately exponential form,
| (3) |
where subscript ‘1’ denotes the inner radius, e.g., . Then,
| (4) |
and,
| (5) |
where subscript ‘2’ denotes the outer radius, and is the total gas mass. With the scalings adopted above, and assuming that units ( kpc), this latter equation yields pc cm-2. This column density declines to about cm-2 at the outer edge of the disc. If we assume an inner disc thickness of about pc, then the volume density corresponding to the column density there is about cm-3.
There is a lower limit to the negative mass of the hole particles because the total density cannot go negative. The sizes and masses in the fiducial clump are close to this limit. For example, if we want a hole in the inner disc with an equivalent mass of , then using the density estimates of the previous paragraph, the size of the hole must be about pc, which is comparable to the pc assumed. In the other two the appropriate minimum hole sizes for the given masses are: pc and 40 pc. These minima should be larger by a factor of in the outer disc where the density is lower.
3 Model Results
3.1 Formation of the Exponential
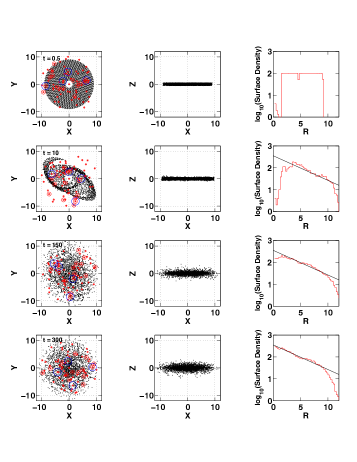
The results are summarized in Figures 1 to 3. Figure 1 shows that scattering from large gravitationally soft clumps can convert an initially flat stellar density profile into an exponential profile in a relatively short time. The times given in the left-hand panels are in units of 9.8 Myr. The straight lines in the right-hand panels are all the same and meant to guide the eye.
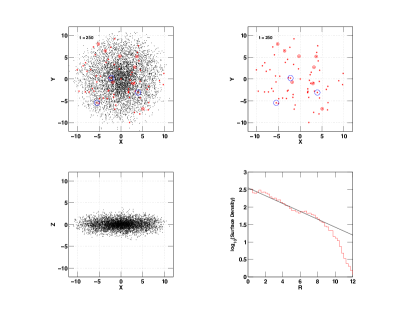
Figure 2 comes from a model with holes, rather than clumps, and shows that holes in an otherwise smooth disc form exponential stellar profiles in essentially the same way as clumps. Real discs contain clumps, shells, and holes on a variety of scales, but regardless of the structural details, our results suggest that an exponential stellar profile is a general outcome. This confirms the primary result of Elmegreen & Struck (2013), and generalizes it to the cases of softer scatterers, a spectrum of scatterers, and to scattering in three dimensions.
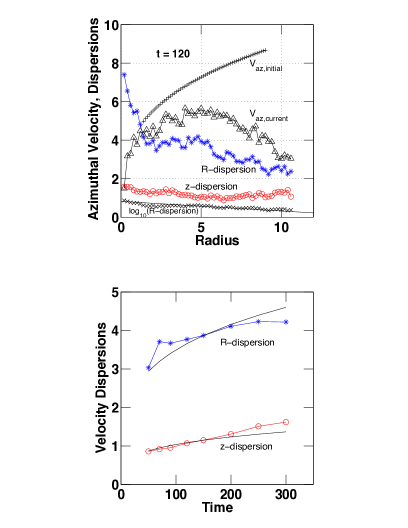
The top panel of Figure 3 shows the initial rotation curve of the clump model (Fig. 1), using the gravitational potential with no random motions, and it shows the actual stellar azimuthal speed and velocity dispersion profiles at a time of Gyr. By this time, the exponential surface density profile is well developed, the stellar rotation curve rises in the centre and then falls in the outer disc where the scattered stars are, and the velocity dispersion profile falls with radius.
The radial component of the dispersion can be approximately fit by an exponential, as in Martinsson et al. (2013). This fit is shown by the x-marks at the bottom of the figure, which are plotted on a log-linear scale. The eccentricity of the stellar orbits depends on the softness of the scattering structures. For the soft scatterers here, the exponential profile, the highly eccentric orbits and the resulting velocity dispersion all build up more slowly than in Elmegreen & Struck (2013).
The bottom panel of Figure 3 shows the time evolution of the two dispersions. Specifically, the dispersions were averaged over the radial interval of (4.0, 6.0) at selected times. Early times, dominated by transient waves, were not included. Both dispersions are negligible at the start of the run. The radial dispersion grows rapidly and evidently saturates at late times. The vertical () dispersion grows more slowly, but steadily. As shown in Figure 3 both dispersions can be approximated by a function, which was derived analytically for molecular cloud scattering by Lacey (1984). However, the fit is not particularly good, and the z-dispersion growth is better fit by a straight line.
3.2 Eccentricities of Stellar Orbits
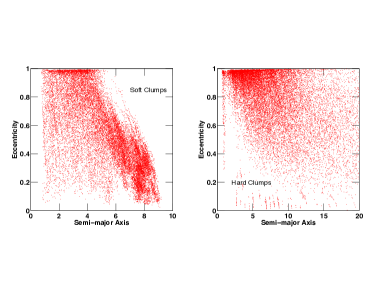
Figure 4 shows the orbital eccentricity distributions as a function of semi-major axis size for the cases of hard and soft clump scattering. (Eccentricity is defined here as the difference between the maximum and minimum orbital radii divided by their sum.) The hard clump case is taken from the rising rotation curve model of Elmegreen & Struck (2013). The soft clump case has parameters like those of the models discussed above, except it is run in two dimensions for consistency with the hard clump model, and has the same number of test particles as that model. In both cases the orbital parameters were estimated by using the average of several of the largest and smallest radii reached by each test particle over a time of 30 units from a starting time of 150 units. This procedure is a compromise because it averages over less than a whole orbit for the particles with the largest orbital radii, but can average over orbital changes for particles with the smallest orbital radii. Thus, the derived orbital parameters are only estimates.
Figure 4 shows important differences between the soft and hard scattering cases. The most apparent is that the soft scattering case has a large population of particles with small to moderate eccentricities, while the hard scattering case has many fewer of these particles. In the soft scattering case these moderate eccentricity particles are found at all radii, although they are concentrated at the larger radii. This is true even from early times in that run. Note that the x-axis in the hard scattering case has twice the range of the soft-scattering case. In the hard scattering case, there are very few particles with semi-major axes less than and eccentricities less than . Thus, the soft-scattering models greatly decrease the number of high eccentricity orbits relative to the hard scattering models of Elmegreen & Struck (2013).
In both cases there is a concentration of particles on orbits with small radii and large eccentricities. In part, this may be an artifact of the initial conditions, where massive clumps are simply placed among the test particles, rather than having a chance to scatter more mildly while growing. However, a part of this population of eccentric orbits would likely develop in any case. These orbits are strongly scattered, and in reality that likely result in a component out of the disc. In that case, these would be viewed as bulge or halo stars.
If, on these grounds, we exclude the particles with high eccentricities (e.g., ), then the eccentricity distribution in the soft scattering solution is qualitatively similar to N-body/hydrodynamic model results shown in Figure 9 of Inoue & Saitoh (2014). These latter simulations model the evolution of clumpy discs in particular, and so provide a comparison to our simple scattering models, though comparisons are complicated by the fact that they also include accretion from a cooling halo. Specifically, the Inoue & Saitoh (2014) models produce thick discs after a time of several Gyr, like the model of Figure 1.
The dependence of the stellar velocity dispersion and orbital eccentricity on the hardness of the scattering centers suggests a possible variation in the relative thicknesses of dIrr disks and in the ratios of the rotation speeds to the dispersions. The models in figure 3 with soft scattering centers have azimuthal velocities that are % larger than the radial dispersions and larger than the vertical dispersions. Figure 4 suggests that these ratios could be smaller with harder scattering centers. Dwarf Spheroidal galaxies have small velocity ratios, as mentioned above, but they are more evolved than anything considered here. The small local dIrr WLM has a rotation-to-dispersion ratio for stars of order unity, which the observers, Leaman et al. (2012), also suggest is a result of star-cloud scattering.
3.3 Three Phases of Evolution
Figure 1 shows three evolutionary phases in our models. In the first, the initially circular orbits are strongly disrupted by scattering and form transient waves. The organization of these waves depends on the accidental coherent forcing from the initial distribution of the large clumps. They generally decay in the second phase, though they can be re-generated by a fortuitous conjunction of scattering centres. Examination of their early evolution suggests that they originate in the strong backward pull on particles orbiting ahead of the most massive clumps (or forward pull in the hole model). If their self-gravity were included these waves would serve as additional soft-scattering structures (Toomre & Kalnajs, 1991) to amplify the gravity of the original ISM irregularities and shorten the evolution timescale.
In the second phase, which occurs between 50 and 150 time units (500 to 1500 Myr), the transient waves diminish while the surface density, velocity dispersion, and disc thickness evolve slowly. Early in this phase, the surface profile is approximately a double exponential with a break near the initial disc radius, but by the end of phase 2, the outer part comes up and a single exponential appears out to a disc edge. Throughout this phase the kinematics are dominated by rotation, but the radial and vertical velocity dispersions grow to the levels shown in Figure 3.
In the third phase, the development of the exponential slows. The radial dispersion and azimuthal drift of the rotation curve have increased to the point where the dispersion dominates the rotation, and these quantities continue to increase after that. Then the disc becomes more like a discy elliptical, dwarf Spheroidal, or E/S0 galaxy, with hot kinematics like those observed in the Sauron (Emsellem et al., 2004), ATLAS3D (Krajnović et al., 2013) and SLUGGS (Arnold et al., 2014) surveys, or the dispersion-dominated dwarf discs of Wheeler et al. (2015). In fact, the feedback processes that generate large holes and clumps in our simulations may be reduced before this dispersion-dominated phase appears if the gas is consumed by star formation or cleared out by feedback or ram pressure stripping.
The result that stars eventually scatter to a thicker disc is consistent with much previous work (e.g., Wielen & Fuchs, 1985) and with the observation that the rotation speed of stars is lower off the midplane (Comerón et al., 2015). Because of dissipation, gas should have more circular orbits than scattered stars and faster rotation speeds in the potential well of the galaxy. This should be the case especially in the outer regions if scattering makes the stellar orbits eccentric.
Comparison of the lower two rows of Figure 1 shows that the profile evolution has largely saturated by this time, evolving very slowly. The growth of the disc thickness has also slowed (as occurs in the case of scattering by giant molecular clouds, see e.g., Lacey 1984). Two scattering processes affect this result. The first is that, as noted in Elmegreen & Struck (2013) and confirmed in additional simulations, the stellar profile tends to grow outward in flat or falling rotation curve potentials, but to be pulled inward in near solid-body potentials. In both cases these tendencies slow after a couple Gyr. In intermediate potentials like that used here, the change of the radial extent and exponential scale length is small at all times after the exponential form is established. Secondly, in three-dimensional models, as stars are scattered and spend more time away from the disc plane, the scattering interactions weaken. Depending on these processes, and others like wave-induced migration, continued accretion, or galaxy interactions, the evolution of single-age populations may be complex.
4 Multiple Superposed Exponentials with Different Ages
Modern galaxies appear to consist of several near-exponential profiles that are nested together and superposed to make the overall mass profile. Each mono-age subsystem of stars, observed within an age range of about one or a few Gyr, may have its own profile, with a trend toward longer scale lengths and smaller scale heights over time, i.e., for younger and younger populations. This trend has been found in numerical simulations of Milky Way type galaxies (Sánchez-Blázquez, 2009; Stinson et al., 2013; Bird et al., 2013; Martig, et al., 2014; Minchev et al., 2016). Mono-abundance populations have been observed with a similar evolution in the Milky Way (Bovy et al., 2012, 2016), although mono-abundance does not necessarily translate directly into mono-age, e.g., see Minchev et al. (2016). Moreover, the Milky Way is not a dwarf galaxy, the focus of this paper, and there are no comparable observations of dwarf discs. However, Zhang et al. (2012) did find that the redder components in a sample of dwarf discs are more extensive than young, blue components. Although not discussed in that work, this could result from scattering as in the models above.
We expect this type of multi-component structure to result from stellar scattering off interstellar structures because, as shown in Section 3.3, the evolution of the disc slows down when it gets thick. The entire process of going from circular orbits to saturated high-dispersion orbits takes only a few Gyr in our models. Thus each new generation of stars formed in newly accreted disc gas has about a Gyr to heat up, during which time it will make its own equilibrium exponential profile starting from the initial extent of the star-forming region. Here we show that stellar scattering off of interstellar irregularities does not mix these different-age populations together and make a single exponential. Rather, each Gyr period of scattering thickens whatever disk there is at that time, and gives it an exponential profile with a scale length proportional to the current disk size.
The roughly Gyr timescale comes also from the analytic theory in Lacey (1984). Consider equations (54) and (57) in that paper, where characteristic timescales are given for the cases where the stellar scale height is less than and greater than the cloud scale height, respectively. In the first case, the basic timescale for stellar heating is where is the initial stellar velocity dispersion and is from equation (53) using evaluations from Table 2. In the second case, where is from equation (56). Using pc-2 for cloud surface number density and characteristic mass , using km s-1 for initial stellar velocity dispersion, using pc for the cloud scale height, and using , we get Gyr and Gyr.
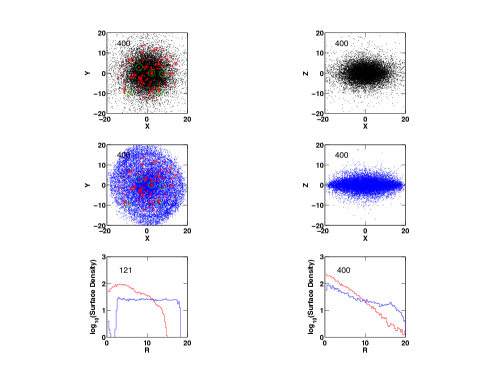
To compare mono-age population discs with the results of this study, we carried out an extension of the scattering models described above to the case of two generations of stars. This model was initiated with the same stellar population and scattering centres as the run shown in Figure 1, but at a time of 120 units (1.2 Gyr). Added to this was a second (young) stellar population with equal numbers of stars (31,288 total). The second population was also assumed to have a flat initial density profile (see Fig. 5) to facilitate the study of how it evolved relative to the older population. This second population was assumed to extend out to twice the initial radius of the older population (compare the first row of Figure 1 to the young star density profile in the first row of Figure 5). In addition to the second generation of stars, 40 more scattering centres were added at larger radii than the previous distribution (with the same mass spectrum and radial profile) to enable scattering in the outer disc. These inhomogeneities would be expected to result from cloud formation and feedback with the new stellar generation. Modeling these inhomogeneities in the same way as for the first generation of stars may not be realistic, but the stellar profile evolution does not depend much on the nature of the scattering centres.
The other graphs in Figure 5 show the stellar and scattering centre distributions at a later time of 400 units (3.9 Gyr). Both old and new stellar discs evolve over this time interval by smoothing and expanding in the vertical direction. The profiles of both generations continue to evolve their exponential forms. Even by this later time, however, the two exponential profiles are not the same. The different vertical distributions suggest different vertical velocity dispersions as well. Generally, we would expect different mean metallicities in these two populations, so they should be observationally distinguishable by metallicity and age despite their overlap in radius (see the simulations of Loebman et al. 2011).
We note that if, as in this model, the older population dominates in the inner regions, while the younger does in the outer regions, then that would give rise to a color gradient. This effect is the result of the shallow initial profiles here, and the steady evolution to a steeper profile for a longer time in the old population. Subject to the initial conditions, this provides a possible explanation for the observed distributions of mono-age populations. That is, each new population evolves into an exponential profile on a timescale of a Gyr because of scattering off of interstellar clouds and holes, while all of the older populations continue to evolve more slowly in the presence of the same scattering sites. In reality, other processes, including misaligned cosmological infall, can complicate the picture.
5 Conclusions
Scattering from gaseous structures like clumps and holes in a dIrr galaxy disc produce exponential surface density profiles in the stellar population. With reasonable assumptions about the scattering masses and sizes, the timescale for a rearrangement of a disc from an initially flat profile to a exponential with several complete scale lengths is about 1 Gyr. Soft scatterers like low-density clouds and big holes slow the development of highly eccentric orbits compared to hard scatterers like dense clouds (Fig. 4). As a result, the stellar velocity dispersion increases more slowly with soft scatterers even though the exponential disc develops quickly. Evidently the exponential profile emerges with only moderate stellar orbit changes.
Our simulations isolated stellar scattering in order to avoid the confusion of collective processes that occur in real galaxy discs. Similarly, Sellwood & Binney (2002) examined how spiral waves drive radial migration from near the corotation resonance. This is a continuous process for the duration of the wave and does not produce high eccentricity orbits. On the other hand, the hard scattering by dense objects (Elmegreen & Struck, 2013) is impulsive. Both produce exponential discs.
We propose that an exponential disc that is moderately disrupted (e.g., by interaction with a small companion) can restore itself by ISM scattering, making a new exponential or piece-wise exponential on a Gyr timescale and erasing the most obvious remnants of that disruption. Relatively massive interstellar structures are common in dIrr galaxies, possibly resulting from star formation feedback. They seem to be the main driver of the continuous evolution toward stellar exponential profiles, especially in dwarf galaxies.
We defined three phases of disc evolution (primarily in dwarf galaxies) under the action of persistent weak scattering. The boundary between the first and second phases was roughly defined by the morphological transition from initial transient waves to smooth nascent exponential profiles. Phase 1 depends on the coldness of the initial conditions and may not occur in real galaxies if they are continuously heated by accretion and feedback. The boundary between the second and third phases was defined by the kinematic transition between domination by ordered rotation versus dispersion. Figure 1 indicates that a relatively thick disc is preserved through these transitions, and if the sources of scattering persist, may generate a discy, early-type galaxy.
Another feature of our models is that the radial velocity dispersion is generally greater than the vertical dispersion except in the outermost regions at late times. Part of this larger radial dispersion is due to the fact that an early planar scattering event from a circular orbit creates a radial velocity component and changes the angular momentum simultaneously, while a vertical impulse does not have this double effect. More importantly, since the stars are initially close to the mid-plane where the gas and star formation are, the first scattering events are dominantly planar. Later scattering events are less frequent because stellar orbits have been perturbed away from the scattering clumps, and weaker because their orbits are no longer similar to those of the clumps. The models suggest that the dispersion builds up over a long timescale, while the radial dispersion appears quickly, and then evolves more slowly.
The thickening of the stellar disc because of scattering causes the evolution into an exponential to slow down. This implies that new stars scatter somewhat independently of old stars and make their own exponential profiles. A superposition of two exponential profiles with different ages was demonstrated.
Acknowledgments
We acknowledge use of NASA’s Astrophysics Data System ADS. We also acknowledge discussions with J. Bird and S. Loebman, and many helpful suggestions from the anonymous referee.
References
- Arnold et al. (2014) Arnold, J. A., et al. 2014, ApJ, 791, 80
- Athanassoula (2016) Athanassoula, E., Rodionov, S.A., Peschken, N. & Lambert, J.C. 2016, ApJ, 821, 90
- Aumer & White (2013) Aumer, M. & White, S.D.M. 2013, MNRAS, 428, 1055
- Aumer et al. (2013) Aumer, M. & White, S.D.M., Naab, T., & Scannapieco, C. 2013, MNRAS, 434, 3142
- Aumer et al. (2016) Aumer, M., Binney, J., & Schönrich, R. 2016, MNRAS, 459, 3326
- Bagetakos et al. (2011) Bagetakos, I., Brinks, E., Walter, F., de Blok, W.J.G., Usero, A., Leroy, A. K., Rich, J. W., & Kennicutt, R. C., Jr. 2011, AJ, 141, 23
- Bakos et al. (2008) Bakos, J., Trujillo, I., & Pohlen, M. 2008, ApJ, 683, L103
- Berrier & Sellwood (2015) Berrier, J. C., Sellwood, J. A., 2015, ApJ, 799, 213
- Bigiel & Blitz (2012) Bigiel, F. & Blitz, L. 2012, ApJ, 756, 183
- Bird et al. (2013) Bird, J.C., Kazantzidis, S., Weinberg, D.H., Guedes, J., Callegari, S., Mayer, L., & Madau, P. 2013, ApJ, 773, 43
- Borlaff et al. (2014) Borlaff, A., Carmen Eliche-Moral, M., Rodríguez-Pérez, C., Querejeta, M., Tapia, T., Pérez-González, P.G., Zamorano, J., Gallego, J., & John Beckman, J. 2014, A&A 570, A103
- Bournaud et al. (2007) Bournaud, F., Elmegreen, B.G., & Elmegreen, D.M. 2007, ApJ, 670, 237
- Bournaud et al. (2009) Bournaud, F., Elmegreen, B.G., & Martig, M. 2009, ApJL, 707, L1
- Bovy et al. (2012) Bovy, J., Rix, H.-W., Liu, C., Hogg, D.W., Beers, T.C., & Lee, Y.S.2012, ApJ, 753, 148
- Bovy et al. (2016) Bovy, J., Rix, H.-W., Schlafly, E.F., Nidever, D.L., Holtzman, J.A., Shetrone, M., Beers, T.C. 2016, ApJ, 823, 30
- Bradford et al. (2015) Bradford, J.D., Geha, M.C., Blanton, M.R. 2015, ApJ, 809, 146
- Chernin et al. (1995) Chernin, A.D., Efremov, Y.N., Voinovich, P.A. 1995, MNRAS, 275, 313
- Comerón et al. (2014) Comerón, S., Elmegreen, B.G., Salo, H., Laurikainen, E., Holwerda, B.W., & Knapen, J.H. 2014, A&A 571, 58
- Comerón et al. (2015) Comerón, S., Salo, H., Janz, J., Laurikainen, E., & Yoachim, P. 2015, A&A, 584A, 34
- Cooper (2013) Cooper, A.P., D Souza, R., Kauffmann, G., Wang, J., Boylan-Kolchin, M., Guo, Q., Frenk, C.S., & White, S.D.M. 2013, MNRAS, 434, 3348
- Debattista et al. (2006) Debattista V. P., Mayer L., Carollo C. M., Moore B., Wadsley J., & Quinn T., 2006, ApJ, 645, 209
- D’Onghia et al. (2013) D’Onghia, E., Vogelsberger, M., Hernquist, L. 2013, ApJ, 766, 34
- Edvardsson et al. (1993) Edvardsson B., Andersen J., Gustafsson B., Lambert D. L., Nissen P. E., Tomkin J., 1993, A&A, 275, 101
- Egorov et al. (2010) Egorov, O. V., Lozinskaya, T. A., & Moiseev, A. V. 2010, ARep, 54, 277
- Egorov et al. (2016) Egorov, O.V., Lozinskaya, T.A., Moiseev, A.V., Shchekinov, Y.A. 2016, MNRAS, tmp1468
- El-Badry et al. (2015) El-Badry, K., Wetzel, A. R., Geha, M., Hopkins, P. F., Kerĕs, D., Chan, T. K., & Faucher-Giguère, C.-A., 2015, arXiv 151201235
- Elmegreen et al. (2005) Elmegreen, B.G., Elmegreen, D.M., Vollbach, D.R., Foster, E.R., & Ferguson, T.E. 2005, ApJ, 634, 101
- Elmegreen & Hunter (2015) Elmegreen, B.G., & Hunter, D.A. 2015, ApJ, 805, 145
- Elmegreen et al. (2012) Elmegreen, B.G. Zhang, H.-X., & Hunter, D.A. 2012, ApJ, 747, 105
- Elmegreen & Struck (2013) Elmegreen, B.G., & Struck, C. 2013, ApJL, 775, L35 (Paper I)
- Elmegreen & Struck (2016) Elmegreen, B.G., & Struck, C. 2016, ApJ, 830, 115
- Emsellem et al. (2004) Emsellem, E., et al. 2004, MNRAS, 352, 721
- Fathi et al. (2012) Fathi K., Gatchell, M., Hatziminaoglou, E., & Epinat, B. 2012., MNRAS, 423, L112
- Freeman (1970) Freeman, K. C. 1970, ApJ, 160, 811
- Governato et al. (2012) Governato, F., Zolotov, A., Pontzen, A., Christensen, C., Oh, S. H., Brooks, A. M., Quinn, T., Shen, S., & Wadsley, J. 2012, MNRAS, 422, 1231
- Grand et al. (2015a) Grand, R. J. J., Bovy, J., Kawata, D., Hunt, J. A. S., Famaey, B., Siebert, A., Monari, G., & Cropper, M. 2015, MNRAS, 453, 1867
- Grand et al. (2015b) Grand, R. J. J., Springel, V., Gómez, F. A., Marinacci, F., Pakmor, R., Campbell, D. J. R., & Jenkins, A. 2015, arXiv 151202219
- Gustafsson et al. (2016) Gustafsson, B., Church, R., Davies, M.B., & Rickman, H. 2016 arXiv 160502965
- Head et al. (2015) Head, J.T.C.G., Lucey, J.R., & Hudson, M.J. 2015, MNRAS, 453, 3729
- Herpich et al. (2015) Herpich, J., Stinson, G.S., Dutton, A.A., Rix, H.-W., Martig, M., Roškar, R., Macciò, A.V., Quinn, T.R., & Wadsley, J. 2015, MNRAS, 448, L99
- Herrmann et al. (2013) Herrmann, K.A., Hunter, D.A., & Elmegreen, B.G. 2013, AJ, 146, 104
- Herrmann et al. (2016) Herrmann, K.A., Hunter, D.A., & Elmegreen, B.G. 2016, AJ, 151, 145
- Heyer et al. (2001) Heyer, M. H., Carpenter, J. M., Smell, R. L., et al. 2001, ApJ, 551, 852
- Hidalgo et al. (2013) Hidalgo, S.L., Monelli, M., Aparicio, A., Gallart, C., Skillman, E.D., Cassisi, S., Bernard, E.J., Mayer, L., Stetson, P., Cole, A., & Dolphin, Andrew 2013, ApJ, 778, 103
- Hohl (1971) Hohl, F. 1971, ApJ, 168, 343
- Hunter et al. (2001) Hunter, D.A., Elmegreen, B.G., & van Woerden, H. 2001, ApJ, 556, 773
- Hunter et al. (2006) Hunter, D.A. & Elmegreen, B.G. 2006, ApJS, 162, 49
- Hunter et al. (2011) Hunter, D.A., Elmegreen, B.G., Oh, S.-H., Anderson, E., Nordgren, T.E., Massey, P., Wilsey, N., & Riabokin, M. 2011 AJ, 142, 121
- Inoue & Saitoh (2014) Inoue, S., & Saitoh, T. R. 2014, MNRAS, 441, 243
- Inutsuka et al. (2015) Inutsuka, S.-i., Inoue, T., Iwasaki, K., Hosokawa, T. 2015, A&A, 580A, 49
- James & Ivory (2011) James P. A., Ivory C. F., 2011, MNRAS, 411, 495
- Kaczmarek, Jane F.; Wilcots (2012) Kaczmarek, J.F., & Wilcots, E.M. 2012, AJ, 144, 67
- Kim et al. (1999) Kim, S., Dopita, M.A., Staveley-Smith, L., & Bessell, M.S. 1999, AJ, 118, 2797
- Kim et al. (2007) Kim, S., Rosolowsky, E., Lee, Y. et al. 2007, ApJS, 171, 419
- Krajnović et al. (2013) Krajnović, D., et al. 2013, MNRAS, 432, 1768
- Lacey (1984) Lacey, C. G. 1984, MNRAS, 208, 687
- Laine et al. (2014) Laine, J., Laurikainen, E., Salo, H. et al. 2014, MNRAS, 441, 1992
- Leaman et al. (2012) Leaman, R., Venn, K.A., Brooks, A.M., Battaglia, G., Cole, A.A., Ibata, R.A., Irwin, M.J., McConnachie, A.W., Mendel, J.T., & Tolstoy, E. 2012, ApJ, 750, 33
- Leroy et al. (2008) Leroy, A.K., Walter, F., Brinks, E., Bigiel, F., de Blok, W. J. G., Madore, B., & Thornley, M. D. 2008, AJ, 136, 2782
- Liu & van de Ven (2012) Liu, C., & van de Ven, G. 2012, MNRAS, 425, 2144
- Loebman et al. (2011) Loebman, S. R., Roškar, R., Debattista, V. P., Željko, I., Quinn, T. R., & Wadsley, J. 2011, ApJ, 737, 8
- Lozinskaya, et al. (2009) Lozinskaya, T. A., Egorov, O. V., Moiseev, A. V., & Bizyaev, D.V. 2009, AstL, 35, 730
- Martig, et al. (2014) Martig, M., Minchev, I. & Flynn, C. 2014, MNRAS, 442, 2474
- Martinsson et al. (2013) Martinsson, T. P. K., Verheijen, M. A. W., Westfall, K. B., Bershady, M. A., Schechtman-Rook, A., Andersen, D. R., & Swaters, R. A. 2013, A&A, 557, A130
- Mestel (1963) Mestel L. 1963, MNRAS, 126, 553
- Minchev et al. (2012) Minchev, I., Famaey, B., Quillen, A. C., et al. 2012, A&A, 548, 127
- Minchev et al. (2016) Minchev, I., Steinmetz, M., Chiappinni, C., Martig, M., Anders, F., Matijevic, G., & de Jong, R.S., 2016, arxiv:1608.04737
- Minchev et al. (2016) Minchev, I., Martig, M., Streich, D., Scannapieco, C., de Jong, R.S., & 2015, ApJL, 804, L9
- Muñoz-Mateos et al. (2013) Muñoz-Mateos, J.C., Sheth, K., Gil de Paz, A., et al. 2013, ApJ, 771, 59
- Oey & Clarke (1997) Oey, M. S., & Clarke, C. J. 1997, MNRAS, 289, 570
- Oh et al. (2015) Oh, S.-H., Hunter, D.A., Brinks, E., Elmegreen, B.G., Schruba, A., Walter, F., Rupen, M.P., Young, L.M., Simpson, C.E., Johnson, M.C., and 6 coauthors, 2015, AJ, 149, 180
- Pohlen & Trujillo (2006) Pohlen, M., & Trujillo, I. 2006, A&A, 454, 759
- Pokhrel et al. (2016) Pokhrel, N.R., Simpson, C.E., and the LITTLE THINGS Team 2016, AAS, 22711105
- Puche et al. (1992) Puche, D., Westpfahl, D., Brinks, E., & Roy, J-R. 1992, AJ, 103, 1841
- Rathaus & Sternberg (2016) Rathaus, B., & Sternberg, A. 2016, MNRAS, in press
- Robin et al. (2014) Robin, A.C., Reyle, C., Fliri, J., Czekaj, M., Robert, C.P., & Martins, A.M.M. 2014, A&A, 569, A13
- Roediger et al. (2012) Roediger, J.C., Courteau, S., Sánchez-Blázquez, P., & McDonald, M. 2012, ApJ, 758, 41
- Roškar et al. (2008) Roškar R.,Debattista, V. P., Stinson, G. S., Quinn T.R., Kaufmann T., Wadsley, J., 2008, ApJ, 675, L65
- Roškar et al. (2013) Roškar, R., Debattista, V. P., & Loebman, S. R., 2013, MNRAS, 433, 976
- Ruiz-Lara et al. (2016) Ruiz-Lara, T.,Pérez, I., Florido, E. et al. 2016, MNRAS, 456, L35
- Sánchez-Blázquez (2009) Sánchez-Blázquez, P., Courty, S., Gibson, B.K., & Brook, C.B. 2009, MNRAS, 398, 901
- Sellwood & Binney (2002) Sellwood, J. A.., & Binney, J. J. 2002, MNRAS, 336, 785
- Shapley (2011) Shapley, A.E. 2011, ARA&A, 49, 525
- Spekkens et al. (2014) Spekkens, K., Urbancic, N., Mason, B.S., Willman, B., Aguirre, J.E. 2014, ApJ, 795, L5
- Spitzer & Schwarzschild (1953) Spitzer, L., Jr., & Schwarzschild, M.1953, ApJ, 118, 106
- Stinson et al. (2013) Stinson, G.S., Bovy, J., Rix, H.W., Brook, C., Roškar, R., Dalcanton, J.J., Macciò, A.V., Wadsley, J., Couchman, H.M.P., & Quinn, T.R. 2013, MNRAS, 436, 625
- Toomre & Kalnajs (1991) Toomre, A., & Kalnajs, A. J. 1991, in Dynamics of disc Galaxies, ed. B. Sundelius (Gothenburg: Göteborgs Univ.), 341
- van der Kruit & Freeman (2011) van der Kruit, P. C., & Freeman, K. C. 2011, ARA&A, 49, 301
- Vera-Ciro, et al. (2014) Vera-Ciro, C., D Onghia, E., Navarro, J., & Abadi, M. 2014, ApJ, 794, 173
- Walter & Brinks (1999) Walter, F. & Brinks, E. 1999, AJ, 118, 273
- Wang et al. (2014) Wang, J., Fu, J., Aumer, M., Kauffmann, G., Józsa, G.I.G., Serra, P., Huang, M.-l., Brinchmann, J., van der Hulst, T., Bigiel, F. 2014, MNRAS, 441, 2159
- Warren et al. (2011) Warren, S.R., Weisz, D.R., Skillman, E.D., et al. 2011, ApJ, 738, 10
- Weisz et al. (2014) Weisz, D.R., Dolphin, A.E., Skillman, E.D., Holtzman, J., Gilbert, K.M., Dalcanton, J.J., Williams, B.F. 2014, ApJ, 789, 147
- Wheeler et al. (2015) Wheeler, C., Pace, A. B., Bullock, J. S., Boylan-Kolchin, M., Oñorbe, J., Fitts, A., Hopkins, P. F., & Kereš, D. arXiv 1511.01095
- Wielen & Fuchs (1985) Wielen, R., & Fuchs, B. 1985, in IAU Symp. 106, The Milky Way Galaxy, ed. H. van Woerden, R. J. Allen, & W. B. Burton (Dordrecht: Reidel), 481
- Yamaguchi et al. (2001) Yamaguchi, R., Mizuno, N. Onishi, T., Mizuno, A., & Fukui, Y. 2001, PASJ, 53, 959
- Yang & Skillman (1993) Yang, H., & Skillman, E.D. 1993, AJ, 106, 1448
- Yoachim et al. (2012) Yoachim, P., Roškar, R., & Debattista, V.P. 2012, ApJ, 752, 97
- Zhang et al. (2012) Zhang, H.X., Hunter, D.A., Elmegreen, B.G., Gao, Y., & Schruba, A. 2012, AJ 143, 47
- Zheng et al. (2015) Zheng, Z., Thilker, D.A., Heckman, T.M. et al. 2016, ApJ, 800, 120