Deadly dark matter cusps vs faint and extended star clusters:
Eridanus II and Andromeda XXV
Abstract
The recent detection of two faint and extended star clusters in the central regions of two Local Group dwarf galaxies, Eridanus II and Andromeda XXV, raises the question of whether clusters with such low densities can survive the tidal field of cold dark matter haloes with central density cusps. Using both analytic arguments and a suite of collisionless N-body simulations, I show that these clusters are extremely fragile and quickly disrupted in the presence of central cusps with . Furthermore, the scenario in which the clusters were originally more massive and sank to the center of the halo requires extreme fine tuning and does not naturally reproduce the observed systems. In turn, these clusters are long lived in cored haloes, whose central regions are safe shelters for . The only viable scenario for hosts that have preserved their primoridal cusp to the present time is that the clusters formed at rest at the bottom of the potential, which is easily tested by measurement of the clusters proper velocity within the host. This offers means to readily probe the central density profile of two dwarf galaxies as faint as and , in which stellar feedback is unlikely to be effective.
1 Introduction
The distribution of matter on cosmological scales is very successfully reproduced by the standard cold dark matter (DM) model: the agreement with measurements of both the cosmic microwave background and the baryonic acoustic oscillation feature (e.g., Planck Collaboration et al., 2014; Anderson et al., 2014; Frenk & White, 2012) is impressive. However, these tests only probe the DM linear power spectrum at scales 10 Mpc. At the scales of galaxies and below alternative DM models make different predictions, which provides means to differentiate among them.
Cold, non relativistic DM particles virialize in haloes characterized by a central density distribution which diverges as (Dubinski & Carlberg, 1991; Navarro et al., 1996), and containing a fraction of about 10% of their mass in substructure, in the form of bound sub-haloes (Diemand et al., 2008; Springel et al., 2008). Warm(-er) DM particles allow for less power at small scales: the subhalo mass function is suppressed below some model-dependent minimum mass and the total mass fraction in substructure is lowered (e.g., Bode et al., 2001; Menci et al., 2012; Lovell et al., 2014; Bose et al., 2016); halo concentration, additionally, becomes a non-monotonic function of halo mass (e.g., Ludlow et al., 2016). Models allowing for self-interactions also imply a reduction in the small-scale power, but additionally feature haloes with centrally cored density profiles (e.g., Spergel & Steinhardt, 2000; Vogelsberger et al., 2012; Elbert et al., 2015), with the size of the core depending on the strength of the interaction itself (Zavala et al., 2013; Lin & Loeb, 2016). Central density cores are also predicted in the ‘fuzzy’ DM scenario (Press et al., 1990; Hu et al., 2000; Hui et al., 2017), in which DM is made of light scalar particles that manifest their quantum properties at astrophysical scales. Cores sizes are dictated by the mass of the axion-particle and recent numerical studies are beginning to provide definite predictions for the process of cosmological structure formation within this model (Schive et al., 2014, 2016; Mocz & Succi, 2015; Du et al., 2017).
Establishing sound astrophysical tests for dark matter models on dwarf galaxy scales and below has proven especially hard so far. Recently, probing the mass function of halo substructure, with either strong lensing (e.g. Kochanek & Dalal, 2004; Vegetti et al., 2014; Hezaveh et al., 2016) or thin stellar streams (e.g., Johnston et al., 2002; Ibata et al., 2002; Erkal et al., 2016) is establishing itself as a promising venue. Here, however, I concentrate on those complimentary tests based on the detailed properties of the density profile of low-mass, dark matter dominated galaxies (virial mass ).
On the theoretical side, the predictions for the halo density profile mentioned above do not take into account the impact of baryons, and the complex hydrodynamical processes that accompany galaxy formation. Radiation and winds from young stars and supernovae, often globally referred to as stellar feedback, are an important ingredient in the formation of dwarf galaxies (e.g., Dekel & Silk, 1986; Navarro et al., 1996; Mashchenko et al., 2006; Pontzen & Governato, 2014). However, a consensus has yet to be reached on how feedback can or cannot sculpt cores into the central regions of originally cuspy dwarf galaxy haloes (e.g., Governato et al., 2012; Zolotov et al., 2012; El-Badry et al., 2016; Sawala et al., 2016; Fattahi et al., 2016). Simple energetic arguments (Peñarrubia et al., 2012; Amorisco et al., 2014) and some sub-grid implementations of the feedback processes in hydrodynamical simulations (e.g., Di Cintio et al., 2014; Oñorbe et al., 2015) suggest that core-creation is suppressed in faint enough galaxies (). Dwarfs with these luminosities should preserve their primordial cusps and represent perfect targets to test the nature of dark matter. However, a different numerical implementation (Read et al., 2016) suggests that cores can emerge also in the faintest galaxies. This motivates even more strongly the need for reliable measurements of the inner density profile of low mass haloes. Even before probing the nature of DM, these measurements are crucial to understand the feedback processes themselves.
On the observational side, however, such measurements remain extremely challenging. Decades of debate have shown that this is the case for galaxies supported by rotation (e.g., Persic & Salucci, 1991; Flores & Primack, 1994; de Blok et al., 2008; Oh et al., 2011; Adams et al., 2014; Oman et al., 2015). In addition, systems that are faint enough to have possibly preserved a pristine cusp are pressure supported systems. Close enough dwarfs are the satellite galaxies of the Local Group; these include the ‘classical’ dwarf Spheroidals (dSphs, ) and the Ultrafaints (UFs, , e.g., McConnachie, 2012). As for all pressure supported systems, their kinematic modelling is plagued by marked degeneracies, which manifest themselves when line-of-sight kinematics alone is available. These degeneracies make it impossible to measure the galaxy’s density profile, and only allow for the determination of a mass scale (Walker et al., 2009; Wolf et al., 2010; Amorisco & Evans, 2011; Agnello et al., 2014), substantially complicating the analysis of datasets collected with painstaking effort (e.g., Battaglia et al., 2008; Walker et al., 2009). This difficulty was partially overcome by the realization that chemo-dynamically distinct stellar subpopulations can occur in Local Group dSphs (e.g., Tolstoy et al., 2004; Battaglia et al., 2006; Walker & Peñarrubia, 2011; Kordopatis et al., 2016) and can be used jointly to constrain the gravitational potential in which all stars reside. This kind of analysis can break the degeneracy between mass and anisotropy typical of pressure supported systems. Two classical dSphs, Sculptor and Fornax, could be studied with this technique. In both cases, this is found to weakly disfavor a cusp (Battaglia et al., 2008; Walker & Peñarrubia, 2011; Amorisco & Evans, 2012; Agnello & Evans, 2012; Amorisco et al., 2013; Zhu et al., 2016), but the statistical significance of this result has been contended (e.g. Breddels & Helmi, 2013; Richardson & Fairbairn, 2014; Strigari et al., 2017). Alternative methods proposed in the literature to probe the central dark matter profile of local dwarf galaxies include: (i) the survival time of unbound kinematic substructure (Kleyna et al., 2003; Sánchez-Salcedo & Lora, 2010); (ii) the dynamical friction timescale of massive Globular Clusters (e.g., Hernandez & Gilmore, 1998; Sánchez-Salcedo et al., 2006; Goerdt et al., 2006; Cole et al., 2012); (iii) the internal kinematics of dwarf galaxy streams (Errani et al., 2015); (iv) the survival of loosely bound binary stars (Peñarrubia et al., 2016).
Motivated by the recent discovery of extended, low-mass star clusters in two Local Group dwarfs, in this paper I seek to establish what are the constraints that their survival to the present day puts on the DM profile of their host haloes. Extended clusters have been observed before in M31 (e.g., Huxor et al., 2011), where they are though to have been deposited by disrupted dwarfs (e.g., Mackey et al., 2010; Hurley & Mackey, 2010; Huxor et al., 2013). The two recently discovered systems are particularly extreme: as I will show, the combination of their stellar mass and size, together with the short orbital times and current projected locations make for an almost inescapable threat to their survival. This represents the main difference from a previous study, Peñarrubia et al. (2009), dedicated to the dynamical evolution of the star clusters of the Fornax and Sagittarius dSphs. Together with dense clusters, both these dwarf galaxies currently harbor diffuse star clusters, namely F1 in Fornax, Arp2 and Ter8 in Sagittarius. As shown by Peñarrubia et al. (2009), these would easily be disrupted by the tides if they were to orbit close enough to the center. However, such fragile GCs are observed to lie at significant projected distances, where at the same time (i) they are currently safe and (ii) dynamical friction is inefficient. As a consequence, as recognized by Peñarrubia et al. (2009), they are long lived. This is not the case for the systems I explore in this paper.
The dwarf galaxies considered here are Eridanus II (EriII, Koposov et al., 2015; Bechtol et al., 2015) in the periphery of the Milky Way, and Andromeda XXV (AndXXV, Richardson et al., 2011; Cusano et al., 2016), around M31. Each of them contains an extended, low mass star cluster which, given its structural properties, is extremely susceptible to the tidal field. Still, in both systems, the cluster is observed to reside – in projection – in the central regions of the galaxy, where the tides are strongest in cold DM haloes. Using both analytical arguments and collisionless numerical simulations I systematically explore the evolution scenarios that could allow the extended star clusters in EriII and AndXXV to survive to the present day. Predictions for the internal kinematics of the clusters are also discussed, providing means to to distinguish between the different scenarios, and therefore to infer the density profiles of the two host galaxies. Section 2 presents the two systems; Section 3 puts the dynamical problem into context; Section 4 describes the numerical setup; Section 5 describes possible scenarios for cuspy haloes; Section 6 concentrates on cored haloes; Section 7 discusses results and presents the Conclusions.
2 The clusters and their hosts
2.1 Eridanus II
At a distance of kpc, EriII is a UF satellite of the MW, with a luminosity of , a projected half-light radius of 280 pc, a quite high ellipticity and no evidence for the presence of gas (Crnojević et al., 2016). Using Magellan/IMACS spectroscopy Li et al. (2017) have recently targeted EriII and confirmed 28 member stars. They find a velocity dispersion of kms-1, a mean metallicity of , and can exclude the presence of young stars in the system.
A round overdensity of stars near the center of EriII was already spotted in the discovery data (Koposov et al., 2015), and subsequent deep imaging (Crnojević et al., 2016) has confirmed the presence of an extremely faint and quite extended star cluster. This has a luminosity of
| (1) |
and a projected half-light radius of
| (2) |
As such, EriII is the least luminous galaxy known to posses a stellar cluster, which has prompted the suggestions that other distant Milky Way GCs might in fact be hosted by yet undiscovered low surface brightness galaxies (Zaritsky et al., 2016). The stellar clusters is projected very close to the inferred center of the stellar distribution of EriII, but has a measurable offset of pc. The resolved stars in the cluster would suggest its stellar population is old, and consistent with the old population of EriII ( Gyr).
2.2 Andromeda XXV
AndXXV sits at a projected distance of kpc from the center of M31 and has a luminosity of (Richardson et al., 2011; McConnachie, 2012; Martin et al., 2016), approaching the lower edge of the range of ‘classical’ dSphs. Its projected half light radius is quite large for its luminosity, but also quite uncertain as a consequence of a chip gap in the available imaging data (Richardson et al., 2011; Martin et al., 2016), with literature values ranging between 550 and 700 pc. The internal kinematics of AndXXV was probed by Collins et al. (2013), who measured a peculiarly low velocity dispersion of kms-1.
By visual inspection of stacked images, Cusano et al. (2016) have recently unveiled the presence of a concentration of stars near the central regions of AndXXV. The color magnitude diagram of the few resolved stars is compatible with that of old stars at the distance of AndXXV, which suggests that the cluster and the dwarf are indeed physically associated (Cusano et al., 2016). Further support for this can be obtained by considering the probability of chance alignments, of either a foreground GC belonging to the MW or of a GC associated with M31. The first is very small: even assuming the MW has has many as 500 (yet undetected) GCs, distributed isotropically, the probability of a chance projection within an angle of kpc is of only111A similarly small probability is obtained using the same argument for the case of Eri II. . The total number of GCs in M31 is uncertain, probably as high as (Veljanoski et al., 2013), with as many as candidates (Galleti et al., 2004). If I assume the latter figure and a 3-dimensional number density profile that declines as slowly as (truncated for example at kpc), the probability of a chance alignment is of about . This indicates that the cluster and AndXXV are very likely associated with each other.
The cluster has a luminosity of
| (3) |
and a projected half light radius of
| (4) |
making it significantly extended. As for EriII, the projected position of the cluster does not coincide with the centroid of AndXXV main stellar component. The precise value of the offset is uncertain due to the mentioned chip gap, but appears comparable to what is seen in EriII, pc.
3 Dynamical ingredients
3.1 Limits from the dwarf galaxy kinematics
The observed values of the stellar velocity dispersion in EriII and AndXXV provide constraints on the host halos. Since a split in multiple stellar subpopulations is not available for these two systems, the only constraint posed by present data is on the total mass within the half-light radius (Walker et al., 2009; Wolf et al., 2010; Amorisco & Evans, 2011; Agnello et al., 2014). I use the mass estimator proposed by Campbell et al. (2016) (their eqn. (17) and Table 3). With a form similar to the estimator proposed by Amorisco & Evans (2011, 2012), this was tested on cosmological simulations and it appears to minimize bias and scatter. Taking into account both observational and systematic uncertainties, the constraints on the total mass are
| (5) |
for EriII, and
| (6) |
for AndXXV, where are the galaxies’ half light radii. I assume the halo has a parametric form
| (7) |
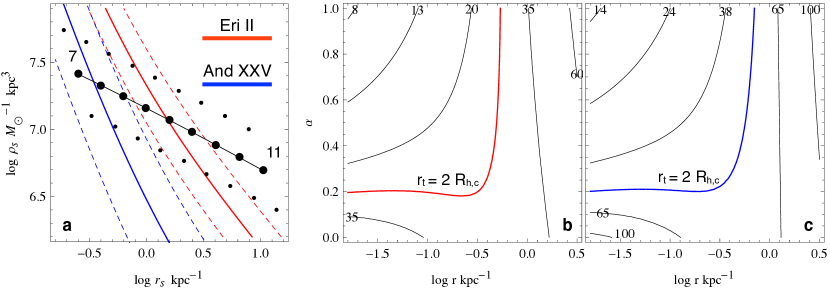
in which the classical Navarro-Frenk-White density profile (NFW, Navarro et al., 1996) corresponds to the case . For such cuspy haloes, the 1-sigma regions shown in panel of Figure 1 illustrate the constraints (5,6). Here and are respectively the characteristic density and scale radius of the density profile, as in eqn. (7). Full black dots in the same panel represent mean cosmological haloes at , satisfying the mass-concentration relation of cold DM haloes (as compiled by Ludlow et al., 2016). Points range between a virial mass of and , in steps of 0.5 dex. Using the same steps, smaller points illustrate the range allowed by the scatter in the mass-concentration relation, for the same set of masses.
EriII appears most compatible with a cold DM halo of , having
| (8) |
This value of the virial mass is in good agreement with what would be inferred based on the dwarf’s luminosity using abundance matching (e.g., Garrison-Kimmel et al., 2017; Jethwa et al., 2016). Haloes with different inner slopes, , and compatible with the same mass constraint can be obtained as follows. The scale radius is kept fixed as in (8), as it would be if the central density cusp is removed by feedback or scoured by the orbital evolution of gaseous massive clumps (e.g., El-Zant et al., 2001; Ma & Boylan-Kolchin, 2004; Cole et al., 2011; Nipoti & Binney, 2015; Del Popolo & Pace, 2016). The characteristic density is adjusted as a function of , so that the enclosed mass remains constant.
As shown by the blue lines in panel of Fig. 1, the low value of the velocity dispersion of AndXXV would suggest an unexpectedly low virial mass. Collins et al. (2013) have already identified the peculiar properties of AndXXV, which is an outlier in the population of Local Group dwarfs. They concluded that AndXXV is likely to have been recently affected by tides (see also Collins et al., 2014). Indeed, the value of the virial mass obtained above assuming dynamical equilibrium appears exceedingly low. This is especially true when compared to the dwarf’s brightness, which would instead suggest a halo at least as massive as the one in EriII.
3.2 Instantaneous tidal radii
For a cluster with mass orbiting within the spherically symmetric potential and instantaneously at a galactocentric distance , the nominal tidal radius is given by (see e.g., Renaud et al., 2011; Amorisco, 2015)
| (9) |
where . For a Keplerian gravitational potential generated by a mass , Eqn (9) returns the classical . However, the shape of the density profile should also be taken into account.
Panels and of Fig. 1 display contours for the instantaneous tidal radius (9), measured in pc, in the plane of orbital distance versus slope of the density profile , as from eqn. (7). Following the analysis of Sect. 3.1, for EriII I have assumed that, when , the halo has the properties of a mean cold DM halo with , as in eqn. (8). For different values of , the dimensional scales are obtained as described in Sect. 3.1, i.e. so to satisfy the kinematic constraint (5). For AndXXV, the arguments in Sect. 3.1 are inconclusive. Given the dwarf’s luminosity, the value is likely a lower bound to the original virial mass of the system, and therefore represents a conservative choice with respect to the strength of the tidal field. For this reason, panel of Fig. 1 also adopts . As to the clusters themselves, Fig. 1 assumes that the cluster in EriII has a mass of and the one in AndXXV has , corresponding to a mass to light ratio of .
The red and blue lines in panels and of Fig. 1 display the contours
| (10) |
where are the observed projected half light radii of the two clusters. These lines are approximate divides between configurations in which the cluster experiences substantial tidal loss, if , and the opposite regime in which the cluster does not fill the Roche lobe and is safe against the tidal field, . Cuspy density profiles result in threatening tidal fields, with a sharp demarcation between profiles with and . In order to survive for a time comparable with its age in a cusp, this simplified analysis suggests that the cluster in EriII should remain at galactocentric distances pc. The one in AndXXV at distances pc. Furthermore, in the presence of a density cusp and a non-circular orbit, the addition of tidal shocking at pericenter is likely to significantly facilitate the disruption of the cluster. This is especially true since the dynamical time in the central regions of the haloes in object is short, Gyr, resulting in repeated injections of energy into the cluster. As a consequence, clusters are very likely to be quickly destroyed if they happen to orbit at radii where . At face value, this result is at odds with the observation that both clusters have a projected distance pc from the center. I will return on this aspect in a quantitative manner in Sect. 5.1.
On the other hand, Fig. 1 suggests that if hosts are cored or have very shallow density slopes, , both clusters are free to orbit at any galactocentric distance. In fact, for , panels and in Fig. 1 show that the instantaneous tidal radius is a non monotonic function of the orbital radius : the very central regions are safer than when . This follows from the sign inversion of the eigenvalues of the tidal tensor, which mark the transition to a compressive tidal field when in a constant density environment (e.g., Chandrasekhar, 1942; Renaud et al., 2011). This simple analysis suggests that, despite their low mass and large sizes, the clusters in EriII and AndXXV would be safe against the tides in haloes with a very shallow cusp or a large core. More in general, clusters even more fragile than those considered here could survive indefinitely if, helped by dynamical friction, they can manage to cross the region and reach the sheltered inner core region.
3.3 Dynamical friction
It is well known that dynamical friction is an important ingredient in the evolution of GCs in dwarf galaxies (e.g., Tremaine et al., 1975; Oh & Lin, 2000; Lotz et al., 2001; Sánchez-Salcedo et al., 2006; Goerdt et al., 2006; Hartmann et al., 2011; den Brok et al., 2014; Brockamp et al., 2014). The scope of this section is limited to providing estimates for the sinking times tailored on the problem at hand. These estimates are useful to guide the identification of viable evolution scenarios for the clusters, to be explored numerically in Sect. 5.
The standard understanding of dynamical friction is crystallized in Chandrasekhar’s analytic formula (Chandrasekhar, 1943; Binney & Tremaine, 2008):
| (11) |
where is the cluster mass, is the norm of its velocity, is the background density, is the usual Coulomb logarithm and is the fraction of the background density with velocities . Here, I seek to estimate the dynamical friction timescale of clusters with different masses in haloes with different density profiles. To this end, I consider the simplified scenario in which:
-
•
the cluster mass remains constant during sinking, i.e., the cluster is not contemporarily affected by tides;
-
•
the orbit of the cluster evolves loosing both energy and angular momentum but conserving its circularity , i.e. it remains a circular orbit;
-
•
variations in the factor during the orbital evolution are secondary and can be neglected;
-
•
the cluster orbits in the central regions of the density profile (7), where .
For the sake of clarity, is the orbital circularity , where and are the orbital angular momentum and the energy of the cluster, and is the angular momentum of a circular orbit with energy . Under the model assumptions above, the dynamical friction timescale scales as follows:
| (12) |
This is the time it takes for dynamical friction to bring a massive object from the radius to . I calibrate eqn. (12) on the result of an N-body simulation in which a massive particle, , is put on a circular orbit with pc in a cold DM halo as in eqn. (8). This sinks in a time Gyr. An analogous massive particle the same initial orbital energy, but on a very eccentric orbit, , sinks in a very similar time, Gyr (see Sect. 4 for details on the numerical setup).
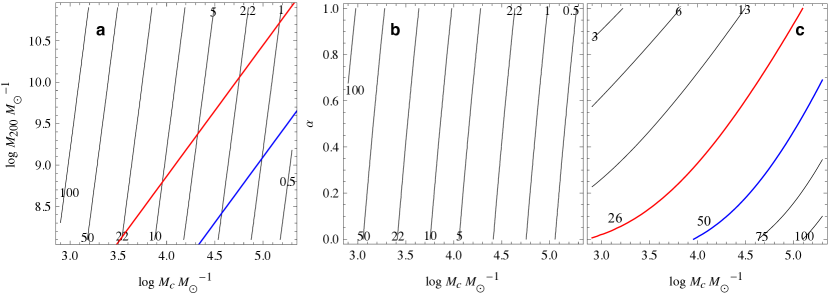
Panel in Fig. 2 shows the sinking time in Gyr for clusters of mass in mean cold DM haloes () with virial mass . The starting radius is kept fixed at a physical distance of pc. At fixed , increases with the virial mass of the host : while increases with , so does the orbital velocity , at the denominator in eqn (11). The dependence on is instead more marked: while dynamical friction can be ignored for clusters with , while massive clusters with sink to the center very quickly. Clusters with masses would also sink towards the center in a fraction of the Hubble time. However, as the numerical explorations of Sect. 5 show, the interplay between dynamical friction and mass loss is significant in this regime and the estimates obtained here are lower limits for . As in Fig. 1, the red and blue lines in panel of Fig. 2 display the curves , here assuming pc. Models close and above these lines are unlikely to survive all the way to the center of haloes with .
Panel explores the dependence of with . Similarly to panels and of Fig. 1, this uses the parameters (8) for , and adjusts so to satisfy the mass constraint (5) for . The dependence of on is rather mild. This is again due to the competing dependences on the local density and local circular velocity in eqn (11), which both decrease with .
Depending on the cluster mass and on the details of the host density profile, dynamical friction can only bring the cluster to a finite distance from the center, , where it becomes strongly suppressed and the sinking process ‘stalls’. This behavior is due to the formation of a central core in the host density profile, on the scale of , as a consequence of the energy and angular momentum transfer from the cluster itself (e.g., El-Zant et al., 2001; Goerdt et al., 2010). In shallow density profiles, dynamical friction is suppressed by the emergence of orbital resonances (e.g., Hernandez & Gilmore, 1998; Read et al., 2006; Inoue, 2009; Cole et al., 2012; Petts et al., 2016), which effectively halt the sinking process. This behavior is not captured by the Chandrasekhar approximation (11), and therefore not taken into account in the estimates above. Analytical arguments and numerical studies (see e.g., Goerdt et al., 2010; Petts et al., 2016) show that ‘core stalling’ happens at the radius where
| (13) |
Panel shows the stalling radii predicted by this equation, in pc, as a function of and . By definition, these are also the values of . The red and blue lines show the contours for the clusters in EriII and AndXXV. Models above these lines are likely to experience significant tidal mass loss on their way to the center of the host.
4 Numerical setup
In this Section, I describe the setup used for the N-body experiments presented in this paper. All simulations are collisionless N-body simulations, executed with Gadget-2 (Springel, 2005). Each features a spherically symmetric host and a spherically symmetric star cluster.
Initial conditions for the star cluster are generated assuming an isotropic Plummer phase space distribution function (e.g., Plummer, 1911; Dejonghe, 1987), for a density profile
| (14) |
The total mass and the core size are free parameters. The projected half light radius for a Plummer model is , while the spherical half light radius is . In the runs described in Sect. 3.3 and used to calibrate the dynamical friction timescale (12), the star cluster is represented by a single massive particle.
The difficulty presented by these simulations is that both cluster and host should be resolved with live particles, and that the individual masses of these particles should be comparable. This makes for a significant computational challenge, by bringing the total number of particles to . A live cluster is necessary to capture tidal stripping; a live halo for dynamical friction. In a static background potential, dynamical friction should be included by hand. However, a genuine accounting of the sinking process is to be preferred here, as the interplay between sinking and mass loss decides the fate of the cluster (see Sect. 5). Particles in host and cluster should have comparable masses to avoid artificial dynamical heating of the cluster (see e.g., Brandt, 2016; Koushiappas & Loeb, 2017), which would substantially facilitate its disruption.
I circumvent this computational issue by combining the use of a static potential and live particles for the host halo. The clusters inhabit the central regions of the halo, therefore resolving the host’s internal dynamics at large radii is unnecessary. I mimic the technique of particle tagging (often adopted in studying the assembly of the stellar halo of galaxies, e.g., Bullock et al., 2001; Cooper et al., 2010, 2013; Amorisco, 2017) and order the host’s mass by binding energy. Only a fraction of most bound mass is resolved in live particles, the remainder of the host mass is replaced by a static background potential. As this selection in based on an integral of the motion, the live particles are in equilibrium within the combination of their own potential and of the associated static background. The latter contributes a force
| (15) |
where is the total force and is the total enclosed mass. Here, ‘total’ refers to the complete target density profile, while is the enclosed mass in live particles alone.
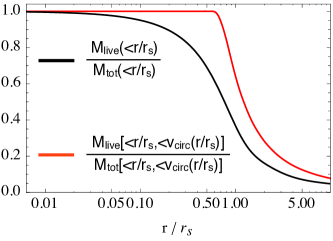
The minimum necessary fraction is fixed by the requirement that the mass responsible for dynamical friction in the regions of interest should be resolved in live particles. As captured by eqn (11), this mass is represented by the ‘slow’ fraction of the local density: . Assuming , the red line in Fig. 3 quantifies the fraction of slow particles that are retained as live for . In more detail, this is the ratio between
-
•
, i.e. the mass of the host (i) resolved in live particles; (ii) enclosed in the radius ; (iii) having orbital velocities smaller than the circular velocity at the enclosing radius, .
-
•
: the total mass of the host satisfying (ii) and (iii).
A fraction is sufficient to fully describe dynamical friction at radii . This can be compared with the ratios , for EriII and for AndXXV, ensuring that a choice of is appropriate. For this value, the black line in Fig. 3 shows the fraction , appearing in the equation for the background force component (15). Initial conditions for the live particles are generated using the phase space distribution function of the target density profile, which is obtained under the assumption of orbital isotropy through the standard Eddington inversion (e.g., Eddington, 1916; Widrow, 2000). This strategy entirely eliminates the computational issue described above. At the same time it allows me to genuinely capture the effects of dynamical friction.
5 Cuspy haloes
In this Section I assume that EriII and AndXXV have cuspy haloes, and numerically explore consequent evolution scenarios for the star clusters.
5.1 The clusters formed as they are
I first consider the case in which the clusters formed with properties similar to those currently observed: and pc in EriII, and pc in AndXXV. Fig. 4 shows what would happen if these clusters are put in orbit within a host halo with and parameters like in eqn (8). Top panels refer to EriII, bottom panels to AndXXV. In both, the orbit has a very high circularity, , which keeps the cluster away from the central regions. Orbital energies are motivated from the analysis of Sect. 3.1 and and correspond to kpc for EriII and kpc for AndXXV. Here is the radius of a circular orbit with energy , and the chosen values satisfy .
Fig. 4 confirms the findings of Fig. 1: a cuspy halo represents an unavoidable threat for star clusters that are as faint and as extended as in EriII and AndXXV. Both clusters disrupt completely within a Gyr. The haloes in Figure 4 have . However, Fig. 1 shows that the location of the contour is insensitive to the density slope for . For them to survive for longer times in cuspy haloes the clusters should constantly orbit at larger radii, with higher orbital energies. This result shows that the observed locations of the clusters in EriII and AndXXV are due to projection effects in this scenario.
What is the likelihood of this? In other words, what is the the probability to observe the clusters so close to the center if they are forced to orbit at ? A rough estimate can be obtained by considering the phase space of a system that has been fully voided within the loss cone corresponding to :
| (16) |
Orbits that bring the cluster to a pericenter are not viable as they result in quick disruption.
I take so that it describes the galaxy’s stars: when integrated over the entire phase space generates an approximately Plummer density profile with the correct half-light radius. In particular, I take to have an isotropic lowered isothermal form, which has been shown to provide a good description of both density and kinematic profiles of dSphs (e.g., Amorisco & Evans, 2011, 2012). I take kpc for EriII and and kpc for AndXXV and assume that all orbits with are equally viable. This is equivalent to requiring that the lifetime of the clusters is 1 Gyr.
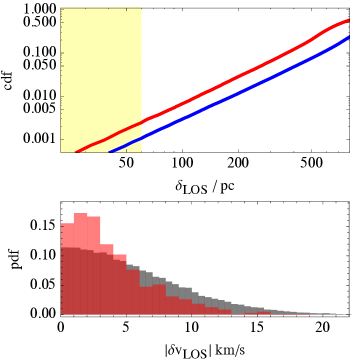
The fraction of mass the phase space density generates within a projected distance from the center represents the probability of observing the cluster at an instantaneous projected location . Such probability is shown in the top panel of Fig. 5, in red for EriII and in blue for AndXXV. The yellow shaded area shows the range selected by the observations: pc. For either systems individually, the probability of observing the cluster at such small radii is very small: %. As the two systems are independent, the probability of observing both this close to the center is entirely negligible. This excludes the possibility that the clusters in EriII and AndXXV formed in cuspy haloes with structural properties similar to those currently observed and have a lifetime Gyr. A possible way to escape this is that the clusters formed at the center of their respective host haloes, which is examined in Sect. 5.1.1.
It is interesting to consider kinematic predictions of the different scenarios, providing means to test them. This is especially the case for EriII, since the dwarf’s mass is substantially more secure than in the case of AndXXV, as discussed in Sect. 3.1. The red histogram in the bottom panel of Fig. 5 shows the probability distribution of the cluster’s LOS velocity, relative to the systemic velocity of EriII ,
| (17) |
as obtained from the phase space distribution function , for pc. In gray, the same probability distribution is shown for all EriII stars at pc, as generated by . The distributions are similar, but large LOS velocities are somewhat disfavored for the cluster. In this scenario, the internal velocity dispersion of the clusters is as implied by their stellar mass. For a mass to light ratio , the internal velocity dispersions are
| (18) |
Finally, in this scenario, it is fair to ask whether DM subhaloes could represent an additional threat for the clusters. If I assume the population of bound substructures in cold DM haloes with is a scaled version of the one in Milky Way sized haloes (Diemand et al., 2008; Springel et al., 2008), close encounters that could seriously disturb the clusters are extremely rare. This is due to the combination of the high relative velocities and of the preferentially higher orbital energies of subhaloes, which are rare in the central regions (Springel et al., 2008).
| outcome | |
|---|---|
| D | |
| D | |
5.1.1 The clusters formed as they are, at the center
If sitting at rest at the bottom of the potential, the cluster would not be subject to tides. The clusters could therefore have formed at the center of the cusp, and this would allow them to survive indefinitely, despite their low densities. By definition, in this scenario
| (19) |
The predicted negligible offset is somewhat ad odds with observations, but it is possible the measured values are spurious, caused for example by lopsided stellar distributions.
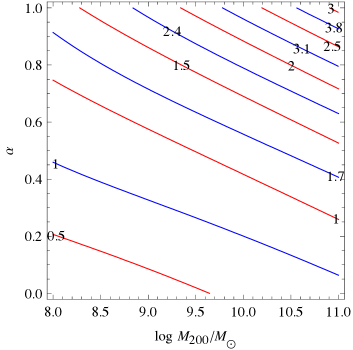
Contrary to the scenario of Sect. 5.1, in this case the cluster could show inflated dynamical mass to light ratios, due to the high central dark matter densities. Fig. 6 shows shows the predicted values of the cluster’s internal velocity dispersion, in kms-1, in the plane of the halo’s virial mass and central slope. Halos are constructed as described in Sect. 3.1: haloes of the same virial mass have the same total mass within the galaxy’s half light radius. Fig. 6 assumes that the process of cluster formation does not alter the properties of the central cusp, and ignores the stellar content of the clusters. Therefore, when the displayed values are higher than those implied by stars alone in eqn (18), the clusters are DM dominated. As in previous Figures, red refers to EriII and blue to AndXXV. For virial masses as selected by the constraint (5), , most cusps result in dark matter dominated clusters, and the effect is especially significant in the case , offering means to test this observationally.
5.2 The clusters were originally more massive
In this Section I explore the possibility that the clusters had different properties at formation: i.e. that their mass was initially higher and/or their half light radius initially smaller. Both these possibilities would help them survive for longer times in a cuspy halo. As shown in Fig. 2, for high enough masses the dynamical friction timescale becomes substantially shorter than a Hubble time: it is in theory possible that the clusters might have sunk to the center of the host while losing mass because of the tides. Here, I explore on whether this scenario can actually reproduce at the same time both the low mass and the large sizes of the clusters in EriII and AndXXV.
Motivated by the constraint (5), I concentrate on halos with parameters like in eqn (8), corresponding to , and take the case of the classical NFW cusp, . The combination of Figs. 1 and 2 would suggest that results obtained in this way might be at least qualitatively similar to the more general case of . I fix the initial orbital energy of the cluster at kpc. In other words, the simulations of this Section investigate the fate of the cluster if this, while losing energy, approaches the threshold kpc with a given set of properties. Once these quantities are fixed, I am left with a three dimensional parameter space, featuring the initial cluster mass , the initial orbital circularity and the initial three-dimensional half light radius . All runs feature a star cluster with or equal mass particles. The host has equal mass particles, representing the most bound 3% of its mass, as described in Sect. 4.
Table 1 lists the initial properties of all the runs explored. Runs that share 2 of the three free parameters are listed on the same line using brackets. The ‘outcome’ of the simulation summarizes the fate of the cluster: indicates a cluster that is disrupted by tides before 15 Gyr, refers to a cluster that survives. In fact, in all explored cases surviving clusters have also sank to the center within 15 Gyr. The outcome defines two separate regions in the three-dimensional parameter space, and the set of explored initial conditions is aimed to best identify this demarcation. Fig. 7 compares these two opposite volumes: the left panel shows with green points the simulations with outcome , the right panel collects all runs with outcome . In the left panel, black lines connect individual runs with outcome to all models with higher initial mass , higher initial circularity and smaller initial half light radii . All these models would also survive. Similarly, individual runs with outcome are connected to all models with lower initial mass , lower initial circularity and larger initial half light radii , which are equally destined to tidal disruption.
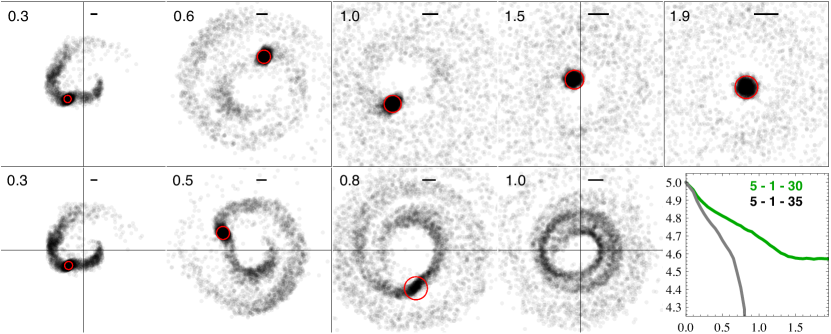
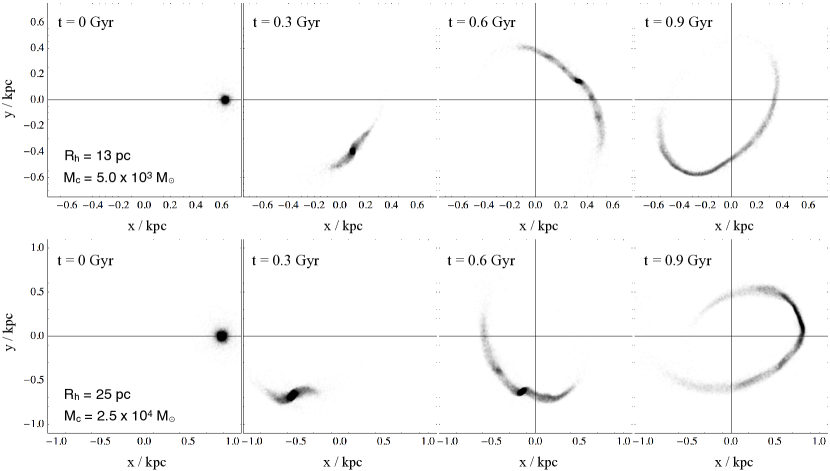
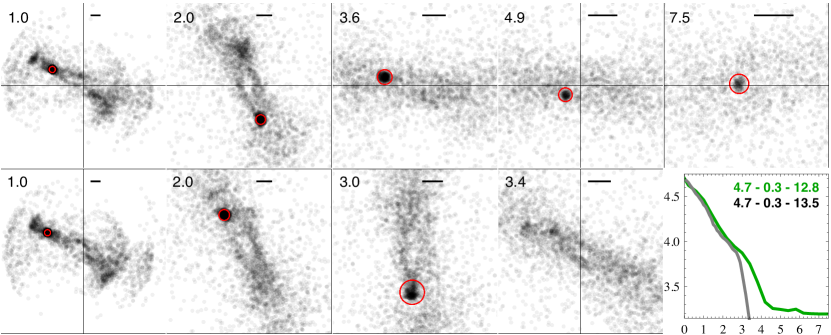
Clusters with low mass, only survive if concentrated, pc, and initially on orbits that are essentially circular, . A circularity of only is capable of disrupting all clusters with and/or pc. Clusters with intermediate initial mass, , can manage to sink to the center even if initially on eccentric orbits, , but need to be concentrated enough. Dynamical friction and tidal mass loss are strongly coupled in this regime: a cluster that looses mass sinks more slowly, which in turn allows for further stripping before the halo center can be reached. As a consequence, small changes to the initial properties of the cluster result in different outcomes, and, when the cluster survives, in different final properties. An example of this is provided by Fig. 8, which illustrates the evolution of two clusters sharing an initial mass of and an initial orbital circularity of , but having slightly different initial sizes: pc in the upper panels and pc in the lower panels. Each panel displays a snapshot of the simulation, corresponding to the time indicated in the upper-left, in Gyr. The black bars display a length of 50 pc, while the red circles identify the remnants, and have a size of at that time. No bound remnant is identified in the bottom panels at Gyr: the less concentrated cluster has been completely shredded by that time. The bottom-right panel shows the mass evolution of both clusters: the abscissa indicates time in Gyr and masses are in units of . While the concentrated cluster manages to sink to the center of the halo and survives thereafter with little to subsequent mass evolution, the small difference in the initial size causes the second cluster to be disrupted by tides.
High mass clusters, are in general capable of sinking to the center, unless they are exceedingly extended for their orbit. An initial half light radius of pc allows clusters with to survive, despite initial orbital eccentricities as low as . The boundary with models that lead to disruption is however thin: if pc, a cluster with the same mass would be disrupted unless initially on an orbit with very high circularity, . Figure 9 compares the cases of two clusters on initially circular orbits, , which share an initial mass of , but have different sizes: pc in the upper panels and pc in the lower panels. The second cluster is exceedingly extended to survive, despite its high mass and the fine tuned, benign orbit. Finally, clusters as massive as manage to sink despite initial orbital eccentricities , as long as pc.
I do not explore higher values of , as these would make the cluster comparable or higher in mass than the total stellar population of the host galaxies. This limit is especially stringent for EriII, : an initial mass implies that the largest majority of the dwarf’s stars once belonged to the cluster itself.
| pc | Gyr | ||
| 4.4 | 10.0 | 2.2 | |
| 4.5 | 9.3 | 1.6 | |
5.2.1 The clusters survived by sinking
As shown by Fig. 8 and 9, clusters that manage to reach the bottom of the potential do not experience significant mass loss thereafter and their structural properties remain approximately constant. A list of the properties of the surviving clusters is provided in Table 2. The final mass and the final projected half light radius are recorded together with the time it takes for the cluster to sink to the center of the host, . Operationally, this is defined as the time at which the cluster’s orbital energy and angular momentum imply an instantaneous apocenter pc. Sinking times span the full available range: from the Gyr of the low-mass cluster with – which survives because of its high concentration and perfectly circular orbit, to the much quicker Gyr of the models with high initial mass, . It is interesting to notice the good agreement at high masses with the estimates of eqn. 12 and Fig. 2, when the clusters experience very limited mass mass loss. Sinking times become longer than estimated for clusters of initially lower mass, when tidal stripping is more effective.
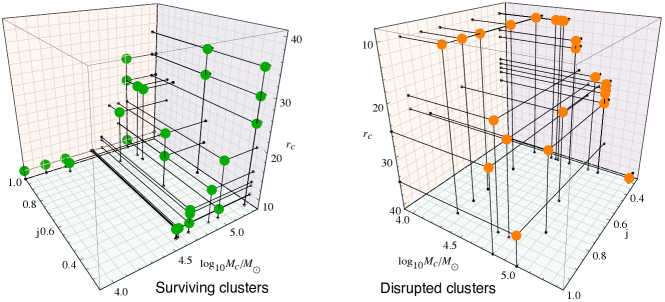
Figure 10 shows the final masses (left panel) and final projected half light radii (right panel) of all surviving clusters, in the three dimensional parameter space. The dependences of the final mass are as expected: all the rest being the same, the final mass increases with the initial mass, increases with the initial orbital circularity, decreases with the initial size. The right panel of the same Figure shows that large final sizes, pc, are achieved only for high initial masses, . Importantly, I find that no surviving cluster has a final size that is much larger than its starting one. In all cases : if the cluster manages to survive, tidal heating has not significantly increased its size. The final size reflects well the initial size, with clusters that loose high fractions of their mass and clusters originally more extended experiencing stronger reductions in their size.
In the left panel of Fig. 10, models with a final mass are highlighted with large red circles. These are compatible with the observed mass of the cluster in EriII. Models highlighted with blue circles in the same panel have , compatibly with the cluster in AndXXV. Similarly, the right panel highlights models with compatible final sizes. No obvious overlap is readily identified. Two sets of initial conditions are selected in red because of the final mass, these are and . An illustration of the latter is presented in the top panels of Fig. 8. Both of these models manage to survive because of their small initial sizes and would be disrupted if initially more extended. In fact, both have final and initial sizes that are smaller than observed in EriII. Models selected for having compatible final sizes have instead much higher initial mass, , and are already extended at formation, pc. However, they result in exceedingly high final masses. While this does not demonstrate that the cluster in EriII cannot be a sunk cluster, it does show that clusters with these properties are not a common outcome in cuspy haloes of the relevant virial mass. If initial conditions capable of generating a cluster that resembles EriII indeed exist, they are very well tuned.
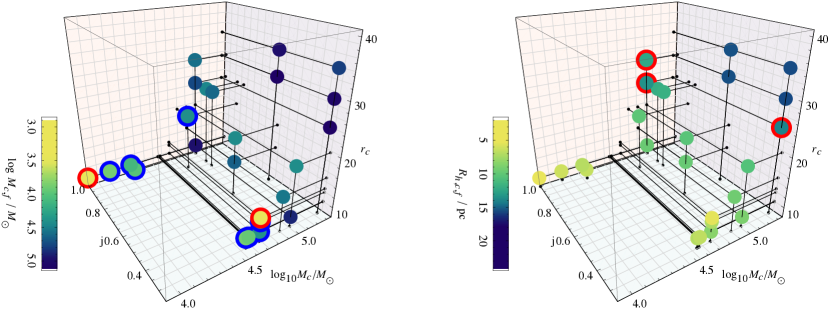
The most promising model for EriII , which corresponds to a compatible final size of pc, but a high . The evolution of this model is illustrated in Fig. 9 (top panels), together with the one of the ‘closeby’ model (bottom panels), which results in tidal disruption. If the final states of the intervening models have similar sizes but gradually decreasing masses, then a cluster similar to the one in EriII could indeed form from a set of initial conditions within this interval. Assuming this is possible, most EriII stars would in fact be stars that formed in the cluster, as the initial cluster mass is comparable with the total stellar mass of the galaxy itself. Additionally, the tidal friction time scale would be quite short, Gyr. If indeed existing, this model would belong to a quite small island of the parameter space. A very fine tuning is required in order to adjust initial size and initial orbital circularity so for the cluster to shed a very high fraction of mass, , without however being disrupted. Such ‘viable’ island is likely to extend in the direction of higher initial masses, , but this would not increase its volume significantly.
The case of AndXXV appears even more desperate: in the entire suite, no single cluster manages to sink while maintaining a large enough projected half light radius. All runs have an all too compact pc. It is much easier to reproduce the final mass of the cluster in AndXXV, but the final half light radii of these models are approximately factor 2 away from the target size. This is even more extreme than in the case of EriII. It is possible that initially very extended, pc, well tuned clusters could produce a sunk remnant compatible with AndXXV. These however would likely be initially massive, , and shed the large majority of their mass. As for EriII, this raises a problem of extreme fine tuning. As explored here, the scenario of sunk clusters in a cuspy halo does not naturally reproduce the properties of either EriII or AndXXV.
As to the kinematical properties of the sunk clusters, these have low line of sight velocities in cuspy haloes, kms-1, and their internal velocity dispersions are not as inflated as in Section 5.1.1, as a consequence of their sculpting effect on the very central density cusp, as described in Sect. 3.3.
5.3 The clusters are in a transitory state
A last possibility to consider for cuspy haloes is that the clusters are currently in a state that departs from dynamical equilibrium, and that the observed structural properties are in fact transitory. Clusters on very eccentric orbits are strongly affected by tidal shocking at pericenter: this periodic energy injection causes their half light radius to expand and contract on the orbital timescale.
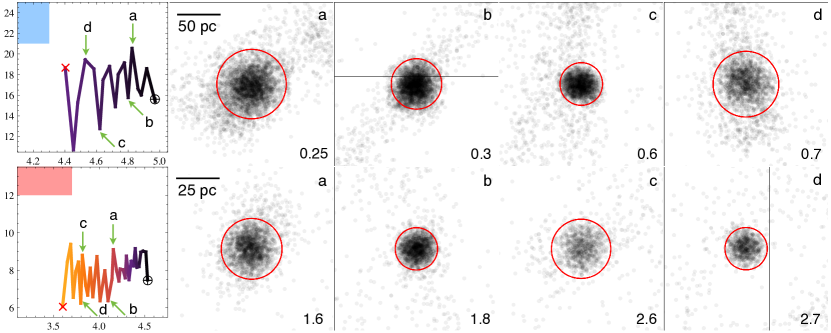
Examples of this behavior are shown in Fig. 11, which displays close-ups from the evolution of models with in the upper panels and in the lower panels. Both these sets of initial conditions lead to tidal disruption. The leftmost panels display the evolutionary tracks of the two clusters in the plane of the instantaneous cluster mass, on the horizontal axis with units in , and of the instantaneous projected half light radius , on the vertical axis with units in pc. Tracks are color-coded by time, and extend between the start of the simulation, marked by a black circle, and the last snapshot in which a bound remnant is identified, marked by a red cross. Snapshots are available in intervals of and Gyr for the models in the upper and lower panels, respectively. Both evolutionary tracks show that, while continuously shedding mass, the cluster oscillates between an expanded and a contracted state, in an a approximately regular fashion.
Panels in the same Figure are centered on the cluster; time is shown in the bottom-right corner of each panel and red circles have a radius of at that time. The different panels in each row share the same linear scale, illustrated by the black bar in panels , so that the sizes of the clusters are comparable. In each row, the four panels refer to couples of expanded-contracted states, consequent in time, as shown by the green arrows in the left-most panels. These states correspond to different orbital phases: the clusters are close to pericenter when in their contracted state. Then, following the tidal shock, they expand at apocenter. The evolutionary tracks of models on circular orbits do not display this behavior and their projected half-light radius decreases in a monotonic fashion. This effect is analogous to what recently observed in simulations of dissolving satellite galaxies on eccentric orbits (Küpper et al., 2017). It is interesting to note that, when in an expanded state, the internal velocity dispersion of the cluster remains approximately compatible with the total bound mass, i.e. departures from virial equilibrium are not significant.
The shaded regions in the left-most panels identify the properties of the observed clusters, in blue for AndXXV in the top row, and in red for EriII in the bottom row. The size oscillations described above bring models closer to the target properties. I have examined the evolutionary tracks of all explored models, disrupted and surviving, as in Table 1, but did not identify transitory states with the target properties. When in their extended state at apocenter, initially extended clusters with high initial mass, , can get ‘close’ to the target region for AndXXV. As for the model in the top row of Fig. 11, this happens close in time to full tidal disruption. Clusters with this mass sink in Gyr, and therefore their lifetime is even shorter when they disrupt. As a consequence, for this mechanism to be a viable candidate for AndXXV, the cluster should either be formed very recently, or have been accreted only very recently, both of which appear unlikely.
6 Cored haloes
This Section is aimed to provide a numerical confirmation that clusters like in EriII or AndXXV would be long lived if hosted by cored haloes, . As shown in Fig. 1, the tidal radius is a non monotonic function of the orbital radius, making the inner core regions safe shelters for the clusters. The size of the Roche lobe is instead minimized at intermediate radii. For haloes compatible with the mass constraint 5, the strength of the tidal field is maximized at pc.
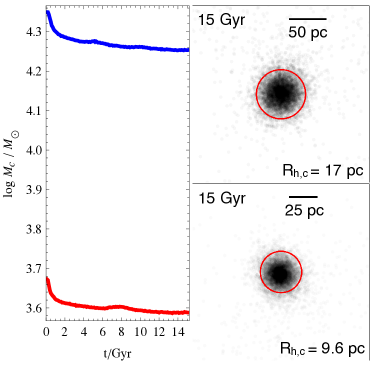
To explore whether this is threat, I simulate two clusters on circular orbits at pc using a static background potential for the halo, so to ensure the clusters indefinitely remain where tides are stronger. The initial properties of these clusters are as observed, and as in the simulations explored in Sect. 5.1: and pc in EriII, and pc in AndXXV. Both clusters are populated with equal mass particles. Figure 12 shows their mass evolution, in blue and red respectively for AndXXV and EriII. Both are extremely long lived: they experience some mild mass loss within the first Gyr, as they adjust to the surrounding tidal field, but their evolution slows down thereafter. The right panels in the same Figure are close ups on the clusters themselves at Gyr. As in previous Figures, the red circles have a radius of . As suggested by the analytic arguments of Section 3, despite their low densities, clusters like those observed in EriII and AndXXV are not threatened by the tidal field of haloes with .
As the cluster in EriII has not shed much mass so far, Fig. 2 shows that it is likely to be now close to completing its sinking process. The cluster in AndXXV should instead already have done so, and reached its stalling radius. As shown by panel in Fig. 2, this makes the observation of small offsets from the dwarf center, on the scale of 50 pc, quite natural. In both cases, these should be accompanied by low, though likely non-zero, proper velocities, of the order of the circular velocity at the stalling radius
| (20) |
Finally, as shown by Fig. 6, the DM content of the clusters in this case should be just a fraction of their stellar content, and their internal velocity dispersions should therefore be close to what predicted by eqn. (18).
7 Discussion and Conclusions
This paper studies the evolution of star clusters in dwarf galaxy haloes, concentrating on the regime of clusters with low mass and extended size. This is aimed to reproduce the evolution and survival to the present day of the two low density clusters recently observed in EriII and AndXXV. A systematic numerical exploration is dedicated to the case of cold DM haloes, with a central density cusp with slope . As suggested by the internal kinematics and by the luminosity of these dwarfs, I concentrate on mean cosmological haloes with virial mass of . These haloes are found to pose an almost inescapable threat to star clusters that are as faint and extended as observed. Haloes compatible with the galaxy’s internal kinematics but with different values for the inner density slope are found to have very similar tidal fields for .
Clusters as seen in EriII or AndXXV have lifetimes Gyr if orbiting at radii pc from the center of such haloes: the probability of observing long lived clusters at small galactocentric distances is negligible, at odds with the observations. The possibility that the clusters were initially more massive and have sunk to the center is found to require a very fine tuning. To survive tidal stripping, a high initial mass is required; however, shedding a high fraction of this mass without resulting in complete disruption requires well adjusted initial conditions. Clusters as extended and as faint as observed are not a natural outcome in cold DM haloes with the relevant virial mass.
The most likely scenario offered by cuspy haloes is that the clusters formed at rest at the bottom of the potential, where they would not be subject to the tidal field. With the present information alone, this possibility cannot be excluded, but firm predictions can be made. First, the observed offset from the center of the two dwarfs would have to be spurious, caused for example by lopsided stellar distributions. Second, this scenario predicts no offset between the systematic line of sight velocity of the galaxy and the one of the cluster. Furthermore, if the process of cluster formation did not affect the central DM cusp, or preceded the formation of the cusp itself, the clusters should be dark matter dominated, resulting in an observably inflated internal velocity dispersion.
In turn, in shallow or cored DM haloes, , tidal fields do not represent a threat. In fact, the central regions of the halo are found to be safe shelters: the nominal tidal radius has a minimum at a scale of , and it increases in the inner core. Clusters like those in EriII and AndXXV are long lived and free to orbit at any radius in such a tidal field. In this scenario, dynamical friction timescales are such that the clusters should either have completed their sinking or be close to reaching their stalling radii: such low orbital energies make the observed small projected offsets unsurprising. Offsets in the line of sight velocity should also be small, though likely non negligible, with a magnitude comparable to or smaller than the local rotational velocity. Finally, the internal velocity dispersion of the clusters is compatible with the observed luminosities.
This analysis has of course a series of caveats. Some of these are unlikely to seriously affect the conclusions of this work. For example:
- •
- •
-
•
I have ignored the possible presence of a central massive black hole in the clusters. This would indeed make them less prone to mass loss, but the black hole mass should be higher than the cluster mass itself in order to make a qualitative difference in the picture outlined above.
More important caveats are those connected to the physical conditions of the halo at the time of the formation of the clusters. Here, I have assumed the density distribution of the host haloes do not evolve in time. This is a good approximation for the halos of dwarf satellite galaxies, which have early formation times and do not substantially grow at recent times. Even when isolated, a mean cold DM halo with virial mass of at already had a mass of at (e.g., Fakhouri et al., 2010). However, if the dynamics that brought to systems like EriII and AndXXV took place at much higher redshifts, then this might still be an issue. Another relevant caveat is connected to the dynamical friction contributed by the galaxy’s gas. Note that for this to alter the dynamical friction timescale by factors of order 1 the local gas density should be comparable with the local dark matter density at . This seems high for a dwarf galaxy, but it is difficult to exclude this was possible at high redshift.
Nonetheless, both the possibilities just described are in practice equivalent to the scenario in which the clusters formed at the center of the cusp. For a cold DM halo that managed to preserve its density cusp to the present day other options are strongly disfavored, as the two clusters are exceedingly fragile. The only realistic scenario is that they formed at the bottom of the potential, and are in fact galactic nuclei. This is easily tested by observations of the clusters’ kinematics, which provide a straightforward way to distinguish between the remaining viable scenarios.
-
•
The easiest case is the one in which either of the clusters is not at rest in its host, with a proper velocity that is higher than what expected for a sunk cluster in cuspy host: kms-1. This would be proof of a centrally cored halo, .
-
•
The case of a negligible proper velocity would be compatible with the scenario of a nucleus in a cuspy halo. In fact, a cusp should perhaps be preferred in this case: an entirely negligible velocity would require better tuning in a cored halo, whose kinematical center is not as well defined. The internal velocity dispersion of the cluster would then provide further help, as the cluster should be dark matter dominated if it is a nucleus in a cuspy host.
-
•
The intermediate case of a non negligible but small proper velocity, kms-1, would indicate a sunk cluster. Formally, both a cuspy and a cored halo would be possible. In both cases the internal velocity dispersion of the cluster would be low, and therefore unhelpful. However, this work shows that an extreme degree of fine tuning is required to reproduce the structural properties of the observed clusters in the case of a cuspy halo. A core would be a much more natural explanation.
This provides a simple and well defined strategy to reliably probe the central density distribution of two low mass dark matter haloes. Such a measurement would have important implications for our understanding of both stellar feedback and of the nature of dark matter, independently of the outcome. To start, a clear observational confirmation of the long predicted central cusp of cold dark matter haloes is still missing. On the other hand, the detection of a cored halo would be at least as interesting. Stellar feedback is not obviously expected to form large cores in galaxies with such low luminosity. In fact, that would certainly be surprising for a dSph with like AndXXV or a UF with only like EriII. The presence of a central density core would pose fundamental questions on the importance and incidence of stellar feedback in dwarf galaxies at the bottom of the galactic mass scale. Finally, if feedback is indeed proven to be ineffective at such low luminosities, this measurement would directly point to alternative dark matter candidates.
References
- Adams et al. (2014) Adams, J. J., Simon, J. D., Fabricius, M. H., et al. 2014, ApJ, 789, 63
- Agnello & Evans (2012) Agnello, A., & Evans, N. W. 2012, ApJ, 754, L39
- Agnello et al. (2014) Agnello, A., Evans, N. W., & Romanowsky, A. J. 2014, MNRAS, 442, 3284
- Amorisco & Evans (2011) Amorisco, N. C., & Evans, N. W. 2011, MNRAS, 411, 2118
- Amorisco et al. (2014) Amorisco, N. C., Zavala, J., & de Boer, T. J. L. 2014, ApJ, 782, L39
- Amorisco et al. (2014) Amorisco, N. C., Evans, N. W., & van de Ven, G. 2014, Nature, 507, 335
- Amorisco et al. (2013) Amorisco, N. C., Agnello, A., & Evans, N. W. 2013, MNRAS, 429, L89
- Amorisco & Evans (2012) Amorisco, N. C., & Evans, N. W. 2012, MNRAS, 419, 184
- Amorisco (2015) Amorisco, N. C. 2015, MNRAS, 450, 575
- Amorisco (2017) Amorisco, N. C. 2017, MNRAS, 464, 2882
- Anderson et al. (2014) Anderson, L., Aubourg, É., Bailey, S., et al. 2014, MNRAS, 441, 24
- Battaglia et al. (2006) Battaglia, G., Tolstoy, E., Helmi, A., et al. 2006, A&A, 459, 423
- Battaglia et al. (2008) Battaglia, G., Helmi, A., Tolstoy, E., et al. 2008, ApJ, 681, L13
- Bechtol et al. (2015) Bechtol, K., Drlica-Wagner, A., Balbinot, E., et al. 2015, ApJ, 807, 50
- Binney & Tremaine (2008) Binney, J., & Tremaine, S. 2008, Galactic Dynamics: Second Edition, by James Binney and Scott Tremaine. ISBN 978-0-691-13026-2 (HB). Published by Princeton University Press, Princeton, NJ USA, 2008.,
- Bode et al. (2001) Bode, P., Ostriker, J. P., & Turok, N. 2001, ApJ, 556, 93
- Bose et al. (2016) Bose, S., Hellwing, W. A., Frenk, C. S., et al. 2016, MNRAS, 455, 318
- Brandt (2016) Brandt, T. D. 2016, ApJ, 824, L31
- Breddels & Helmi (2013) Breddels, M. A., & Helmi, A. 2013, A&A, 558, A35
- Brockamp et al. (2014) Brockamp, M., Küpper, A. H. W., Thies, I., Baumgardt, H., & Kroupa, P. 2014, MNRAS, 441, 150
- Bullock et al. (2001) Bullock, J. S., Kravtsov, A. V., & Weinberg, D. H. 2001, ApJ, 548, 33
- Campbell et al. (2016) Campbell, D. J. R., Frenk, C. S., Jenkins, A., et al. 2016, arXiv:1603.04443
- Chandrasekhar (1942) Chandrasekhar, S. 1942, Chicago, Ill., The University of Chicago press [1942],
- Chandrasekhar (1943) Chandrasekhar, S. 1943, ApJ, 97, 255
- Cole et al. (2011) Cole, D. R., Dehnen, W., & Wilkinson, M. I. 2011, MNRAS, 416, 1118
- Cole et al. (2012) Cole, D. R., Dehnen, W., Read, J. I., & Wilkinson, M. I. 2012, MNRAS, 426, 601
- Collins et al. (2013) Collins, M. L. M., Chapman, S. C., Rich, R. M., et al. 2013, ApJ, 768, 172
- Collins et al. (2014) Collins, M. L. M., Chapman, S. C., Rich, R. M., et al. 2014, ApJ, 783, 7
- Cooper et al. (2010) Cooper, A. P., Cole, S., Frenk, C. S., et al. 2010, MNRAS, 406, 744
- Cooper et al. (2013) Cooper, A. P., D’Souza, R., Kauffmann, G., et al. 2013, MNRAS, 434, 3348
- Crnojević et al. (2016) Crnojević, D., Sand, D. J., Zaritsky, D., et al. 2016, ApJ, 824, L14
- Cusano et al. (2016) Cusano, F., Garofalo, A., Clementini, G., et al. 2016, ApJ, 829, 26
- Deason et al. (2014) Deason, A., Wetzel, A., & Garrison-Kimmel, S. 2014, ApJ, 794, 115
- de Blok & Bosma (2002) de Blok, W. J. G., & Bosma, A. 2002, A&A, 385, 816
- de Blok et al. (2008) de Blok, W. J. G., Walter, F., Brinks, E., et al. 2008, AJ, 136, 2648-2719
- Dejonghe (1987) Dejonghe, H. 1987, MNRAS, 224, 13
- Dekel & Silk (1986) Dekel, A., & Silk, J. 1986, ApJ, 303, 39
- Del Popolo & Pace (2016) Del Popolo, A., & Pace, F. 2016, Ap&SS, 361, 162
- den Brok et al. (2014) den Brok, M., Peletier, R. F., Seth, A., et al. 2014, MNRAS, 445, 2385
- Di Cintio et al. (2014) Di Cintio, A., Brook, C. B., Dutton, A. A., et al. 2014, MNRAS, 441, 2986
- Diemand et al. (2008) Diemand, J., Kuhlen, M., Madau, P., et al. 2008, Nature, 454, 735
- Du et al. (2017) Du, X., Behrens, C., Niemeyer, J. C., & Schwabe, B. 2017, Phys. Rev. D, 95, 043519
- Dubinski & Carlberg (1991) Dubinski, J., & Carlberg, R. G. 1991, ApJ, 378, 496
- Eddington (1916) Eddington, A. S. 1916, MNRAS, 76, 572
- Elbert et al. (2015) Elbert, O. D., Bullock, J. S., Garrison-Kimmel, S., et al. 2015, MNRAS, 453, 29
- El-Badry et al. (2016) El-Badry, K., Wetzel, A., Geha, M., et al. 2016, ApJ, 820, 131
- El-Zant et al. (2001) El-Zant, A., Shlosman, I., & Hoffman, Y. 2001, ApJ, 560, 636
- Erkal et al. (2016) Erkal, D., Belokurov, V., Bovy, J., & Sanders, J. L. 2016, MNRAS, 463, 102
- Errani et al. (2015) Errani, R., Peñarrubia, J., & Tormen, G. 2015, MNRAS, 449, L46
- Fakhouri et al. (2010) Fakhouri, O., Ma, C.-P., & Boylan-Kolchin, M. 2010, MNRAS, 406, 2267
- Fattahi et al. (2016) Fattahi, A., Navarro, J. F., Sawala, T., et al. 2016, arXiv:1607.06479
- Flores & Primack (1994) Flores, R. A., & Primack, J. R. 1994, ApJ, 427, L1
- Frenk & White (2012) Frenk, C. S., & White, S. D. M. 2012, Annalen der Physik, 524, 507
- Galleti et al. (2004) Galleti, S., Federici, L., Bellazzini, M., Fusi Pecci, F., & Macrina, S. 2004, A&A, 416, 917
- Garrison-Kimmel et al. (2017) Garrison-Kimmel, S., Bullock, J. S., Boylan-Kolchin, M., & Bardwell, E. 2017, MNRAS, 464, 3108
- Gibbons et al. (2017) Gibbons, S. L. J., Belokurov, V., & Evans, N. W. 2017, MNRAS, 464, 794
- Gieles et al. (2010) Gieles, M., Baumgardt, H., Heggie, D. C., & Lamers, H. J. G. L. M. 2010, MNRAS, 408, L16
- Gieles et al. (2011) Gieles, M., Heggie, D. C., & Zhao, H. 2011, MNRAS, 413, 2509
- Goerdt et al. (2006) Goerdt, T., Moore, B., Read, J. I., Stadel, J., & Zemp, M. 2006, MNRAS, 368, 1073
- Goerdt et al. (2010) Goerdt, T., Moore, B., Read, J. I., & Stadel, J. 2010, ApJ, 725, 1707
- Governato et al. (2012) Governato, F., Zolotov, A., Pontzen, A., et al. 2012, MNRAS, 422, 1231
- Hartmann et al. (2011) Hartmann, M., Debattista, V. P., Seth, A., Cappellari, M., & Quinn, T. R. 2011, MNRAS, 418, 2697
- Hernandez & Gilmore (1998) Hernandez, X., & Gilmore, G. 1998, MNRAS, 297, 517
- Hezaveh et al. (2016) Hezaveh, Y. D., Dalal, N., Marrone, D. P., et al. 2016, ApJ, 823, 37
- Hu et al. (2000) Hu, W., Barkana, R., & Gruzinov, A. 2000, Physical Review Letters, 85, 1158
- Hui et al. (2017) Hui, L., Ostriker, J. P., Tremaine, S., & Witten, E. 2017, Phys. Rev. D, 95, 043541
- Hurley & Mackey (2010) Hurley, J. R., & Mackey, A. D. 2010, MNRAS, 408, 2353
- Huxor et al. (2011) Huxor, A. P., Ferguson, A. M. N., Tanvir, N. R., et al. 2011, MNRAS, 414, 770
- Ibata et al. (2002) Ibata, R. A., Lewis, G. F., Irwin, M. J., & Quinn, T. 2002, MNRAS, 332, 915
- Inoue (2009) Inoue, S. 2009, MNRAS, 397, 709
- Jethwa et al. (2016) Jethwa, P., Belokurov, V., & Erkal, D. 2016, arXiv:1612.07834
- Johnston et al. (2002) Johnston, K. V., Spergel, D. N., & Haydn, C. 2002, ApJ, 570, 656
- Kleyna et al. (2003) Kleyna, J. T., Wilkinson, M. I., Gilmore, G., & Evans, N. W. 2003, ApJ, 588, L21
- Kochanek & Dalal (2004) Kochanek, C. S., & Dalal, N. 2004, ApJ, 610, 69
- Koposov et al. (2015) Koposov, S. E., Belokurov, V., Torrealba, G., & Evans, N. W. 2015, ApJ, 805, 130
- Kordopatis et al. (2016) Kordopatis, G., Amorisco, N. C., Evans, N. W., Gilmore, G., & Koposov, S. E. 2016, MNRAS, 457, 1299
- Koushiappas & Loeb (2017) Koushiappas, S. M., & Loeb, A. 2017, arXiv:1704.01668
- Küpper et al. (2017) Küpper, A. H. W., Johnston, K. V., Mieske, S., Collins, M. L. M., & Tollerud, E. J. 2017, ApJ, 834, 112
- Li et al. (2017) Li, T. S., Simon, J. D., Drlica-Wagner, A., et al. 2017, ApJ, 838, 8
- Lin & Loeb (2016) Lin, H. W., & Loeb, A. 2016, J. Cosmology Astropart. Phys, 3, 009
- Lotz et al. (2001) Lotz, J. M., Telford, R., Ferguson, H. C., et al. 2001, ApJ, 552, 572
- Lovell et al. (2014) Lovell, M. R., Frenk, C. S., Eke, V. R., et al. 2014, MNRAS, 439, 300
- Ludlow et al. (2016) Ludlow, A. D., Bose, S., Angulo, R. E., et al. 2016, MNRAS, 460, 1214
- Huxor et al. (2013) Huxor, A. P., Ferguson, A. M. N., Veljanoski, J., Mackey, A. D., & Tanvir, N. R. 2013, MNRAS, 429, 1039
- Ma & Boylan-Kolchin (2004) Ma, C.-P., & Boylan-Kolchin, M. 2004, Physical Review Letters, 93, 021301
- Mackey et al. (2010) Mackey, A. D., Huxor, A. P., Ferguson, A. M. N., et al. 2010, ApJ, 717, L11
- Martin et al. (2016) Martin, N. F., Ibata, R. A., Lewis, G. F., et al. 2016, ApJ, 833, 167
- Mashchenko et al. (2006) Mashchenko, S., Couchman, H. M. P., & Wadsley, J. 2006, Nature, 442, 539
- McConnachie (2012) McConnachie, A. W. 2012, AJ, 144, 4
- Menci et al. (2012) Menci, N., Fiore, F., & Lamastra, A. 2012, MNRAS, 421, 2384
- Mocz & Succi (2015) Mocz, P., & Succi, S. 2015, Phys. Rev. E, 91, 053304
- Navarro et al. (1996) Navarro, J. F., Frenk, C. S., & White, S. D. M. 1996, ApJ, 462, 563
- Navarro et al. (1996) Navarro, J. F., Eke, V. R., & Frenk, C. S. 1996, MNRAS, 283, L72
- Nipoti & Binney (2015) Nipoti, C., & Binney, J. 2015, MNRAS, 446, 1820
- Oh et al. (2011) Oh, S.-H., de Blok, W. J. G., Brinks, E., Walter, F., & Kennicutt, R. C., Jr. 2011, AJ, 141, 193
- Oh & Lin (2000) Oh, K. S., & Lin, D. N. C. 2000, ApJ, 543, 620
- Okamoto et al. (2008) Okamoto, T., Gao, L., & Theuns, T. 2008, MNRAS, 390, 920
- Oman et al. (2015) Oman, K. A., Navarro, J. F., Fattahi, A., et al. 2015, MNRAS, 452, 3650
- Oñorbe et al. (2015) Oñorbe, J., Boylan-Kolchin, M., Bullock, J. S., et al. 2015, MNRAS, 454, 2092
- Peñarrubia et al. (2009) Peñarrubia, J., Walker, M. G., & Gilmore, G. 2009, MNRAS, 399, 1275
- Peñarrubia et al. (2012) Peñarrubia, J., Pontzen, A., Walker, M. G., & Koposov, S. E. 2012, ApJ, 759, L42
- Peñarrubia et al. (2016) Peñarrubia, J., Ludlow, A. D., Chanamé, J., & Walker, M. G. 2016, MNRAS, 461, L72
- Persic & Salucci (1991) Persic, M., & Salucci, P. 1991, ApJ, 368, 60
- Petts et al. (2016) Petts, J. A., Read, J. I., & Gualandris, A. 2016, MNRAS, 463, 858
- Planck Collaboration et al. (2014) Planck Collaboration, Ade, P. A. R., Aghanim, N., et al. 2014, A&A, 571, A16
- Plummer (1911) Plummer, H. C. 1911, MNRAS, 71, 460
- Pontzen & Governato (2014) Pontzen, A., & Governato, F. 2014, Nature, 506, 171
- Press et al. (1990) Press, W. H., Ryden, B. S., & Spergel, D. N. 1990, Physical Review Letters, 64, 1084
- Read et al. (2006) Read, J. I., Goerdt, T., Moore, B., et al. 2006, MNRAS, 373, 1451
- Read et al. (2016) Read, J. I., Agertz, O., & Collins, M. L. M. 2016, MNRAS, 459, 2573
- Renaud et al. (2011) Renaud, F., Gieles, M., & Boily, C. M. 2011, MNRAS, 418, 759
- Richardson et al. (2011) Richardson, J. C., Irwin, M. J., McConnachie, A. W., et al. 2011, ApJ, 732, 76
- Richardson & Fairbairn (2014) Richardson, T., & Fairbairn, M. 2014, MNRAS, 441, 1584
- Sánchez-Salcedo et al. (2006) Sánchez-Salcedo, F. J., Reyes-Iturbide, J., & Hernandez, X. 2006, MNRAS, 370, 1829
- Sánchez-Salcedo & Lora (2010) Sánchez-Salcedo, F. J., & Lora, V. 2010, MNRAS, 407, 1135
- Sawala et al. (2016) Sawala, T., Frenk, C. S., Fattahi, A., et al. 2016, MNRAS, 456, 85
- Sawala et al. (2016) Sawala, T., Frenk, C. S., Fattahi, A., et al. 2016, MNRAS, 457, 1931
- Schive et al. (2014) Schive, H.-Y., Chiueh, T., & Broadhurst, T. 2014, Nature Physics, 10, 496
- Schive et al. (2016) Schive, H.-Y., Chiueh, T., Broadhurst, T., & Huang, K.-W. 2016, ApJ, 818, 89
- Spergel & Steinhardt (2000) Spergel, D. N., & Steinhardt, P. J. 2000, Physical Review Letters, 84, 3760
- Springel (2005) Springel, V. 2005, MNRAS, 364, 1105
- Springel et al. (2008) Springel, V., Wang, J., Vogelsberger, M., et al. 2008, MNRAS, 391, 1685
- Strigari et al. (2017) Strigari, L. E., Frenk, C. S., & White, S. D. M. 2017, ApJ, 838, 123
- Tolstoy et al. (2004) Tolstoy, E., Irwin, M. J., Helmi, A., et al. 2004, ApJ, 617, L119
- Tremaine et al. (1975) Tremaine, S. D., Ostriker, J. P., & Spitzer, L., Jr. 1975, ApJ, 196, 407
- Vegetti et al. (2014) Vegetti, S., Koopmans, L. V. E., Auger, M. W., Treu, T., & Bolton, A. S. 2014, MNRAS, 442, 2017
- Veljanoski et al. (2013) Veljanoski, J., Ferguson, A. M. N., Mackey, A. D., et al. 2013, ApJ, 768, L33
- Vogelsberger et al. (2012) Vogelsberger, M., Zavala, J., & Loeb, A. 2012, MNRAS, 423, 3740
- Walker et al. (2009) Walker, M. G., Mateo, M., & Olszewski, E. W. 2009, AJ, 137, 3100
- Walker et al. (2009) Walker, M. G., Mateo, M., Olszewski, E. W., et al. 2009, ApJ, 704, 1274
- Walker & Peñarrubia (2011) Walker, M. G., & Peñarrubia, J. 2011, ApJ, 742, 20
- Widrow (2000) Widrow, L. M. 2000, ApJS, 131, 39
- Wolf et al. (2010) Wolf, J., Martinez, G. D., Bullock, J. S., et al. 2010, MNRAS, 406, 1220
- Zaritsky et al. (2016) Zaritsky, D., Crnojević, D., & Sand, D. J. 2016, ApJ, 826, L9
- Zavala et al. (2013) Zavala, J., Vogelsberger, M., & Walker, M. G. 2013, MNRAS, 431, L20
- Zhu et al. (2016) Zhu, L., van de Ven, G., Watkins, L. L., & Posti, L. 2016, MNRAS, 463, 1117
- Zolotov et al. (2012) Zolotov, A., Brooks, A. M., Willman, B., et al. 2012, ApJ, 761, 71