Pulsations of intermediate–mass stars on the asymptotic giant branch
Yu. A. Fadeyev***E–mail: fadeyev@inasan.ru
Institute of Astronomy, Russian Academy of Sciences, Pyatnitskaya ul. 48, Moscow, 119017 Russia
Received February 20, 2017
Abstract — Evolutionary tracks from the zero age main sequence to the asymptotic giant branch were computed for stars with initial masses and metallicity . Some models of evolutionary sequences were used as initial conditions for equations of radiation hydrodynamics and turbulent convection describing radial stellar pulsations. The early asymptotic giant branch stars are shown to pulsate in the fundamental mode with periods . The rate of period change gradually increases as the star evolves but is too small to be detected (). Pulsation properties of thermally pulsing AGB stars are investigated on time intervals comprising 17 thermal pulses for evolutionary sequences with initial masses and and 6 thermal pulses for and . Stars with initial masses pulsate either in the fundamental mode or in the first overtone, whereas more massive red giants () pulsate in the fundamental mode with periods day. Most rapid pulsation period change with rate occurs during decrease of the surface luminosity after the maximum of the luminosity in the helium shell source. The rate of subsequent increase of the period is .
Keywords: stars: variable and peculiar
1 introduction
Miras belong to long–period late–type variable stars with visual light amplitude greater than 2 magnitudes and pulsation period as long as day. Light variations of Mira–type variables are not strictly periodic and at least three kinds of period instability are distinguished. First, random cycle–to–cycle fluctuations of the pulsation period (Eddington, Plakidis, 1929) seem to be a common property of Miras, the nature of fluctuations remaining unknown (Percy, Colivas, 1999). Second, some Miras show secular change (either increase or decrease) of the period. This property of Miras has been firstly reported by Eddington and Plakidis (1929) who found the secular period change in Cet and Cyg. The fraction of Miras with detected long-term period change is currently estimated in the range from one to a few per cent (Templeton et al., 2005). The secular period change of Miras is due to variations of the stellar radius and surface luminosity accompanying the thermal pulse in the helium shell source (Wood, Zarro, 1981). Third, as many as a quarter of Miras and semiregular (SR) variables exhibit the long secondary periods (LSP) by an order of magnitude longer than the fundamental mode period (Wood et al., 2004). The physical origin of the secondary periodicity is unclear.
Discovery of absorption lines of the radioactive element technetium with half–life time yr in atmospheres of Miras of spectral types S and C (Merrill, 1952; Busso et al., 1999) indicates that these variables are asymptotic giant branch (AGB) stars. Secular changes of the pulsation period provide further evidence for Miras as AGB stars. In particular, Wood and Zarro (1981) have shown that the rates of period change in Miras R Aql, W Dra and R Hya are consistent with results of evolutionary computations done for thermally pulsing AGB stars. However, one should be noted that the authors did not investigate pulsational instability of red giants and the theoretical estimates of the period change rate they obtained in assumption that Miras are the first overtone pulsators.
The pulsation mode of galactic Miras is still disputable. Direct radius measurements of brightest Miras by Weiner (2004) and Perrin et al. (2004) show that observed stars pulsate in the fundamental mode. The same conclusion was made by Ya’ari and Tuchman (1999) who computed hydrodynamic models of red giants with masses and luminosities . At the same time multi–wavelength angular diameter measurements of nearby Miras done by Tuthill et al. (1994) and Haniff et al. (1995) show that Miras are the first–overtone pulsators. Observations of Miras in the Large Magellanic Cloud (LMC) also are contradictory. Wood and Sebo (1996) and Wood et al. (1999) have shown that Miras in LMC are the fundamental mode pulsators, whereas Ita et al. (2004) provided evidences favoring both fundamental mode and first overtone pulsations. The same conclusion was drawn from photometric monitoring of long period variable stars in dwarf galaxies NGC 147 and NGC 185 (Lorenz, 2011).
One of the causes of the above contradiction is that there are still significant uncertainties in pulsation properties of late–type giant stars. Attempts to study nonlinear pulsation models of red giants were undertaken by a number of authors but effects of turbulent pressure and turbulent viscosity were ignored or were not considered in detail (Keeley, 1970; Smith, Rose, 1972; Wood, 1974; Tuchman et al., 1978; 1979; Perl, Tuchman, 1990; Cox, Ostlie, 1993; Hofmann et al., 1998; Ya’ari, Tuchman, 1999). First hydrodynamic computations for red giant models based on sufficiently realistic treatment of turbulent convection were done by Olivier and Wood (2005). They employed the convection model of Kuhfuß(1986) and showed that hydrodynamic models taking into account interaction between gas flow and turbulence via turbulent viscosity are in a better agreement with observations than those of previous works. Unfortunately, this study was restricted by exploratory computations of five models with masses and . Later this approach was used by Kamath et al. (2010) for computation of several low–mass AGB star models with composition of the Magellanic Cloud clusters NGC 1978 and NGC 419.
The present work is aimed at determining the pulsation properties (i.e. the pulsation mode and the pulsation period) as a function of evolutionary time for AGB stars with initial masses and initial relative mass fractions of helium and heavier elements and , respectively. Results of computations are compared with observations of Mira–type variables having most reliable estimates of the period change rate. Below we extend our earlier results obtained for the first ten thermal pulses of the population I AGB star with initial mass (Fadeyev, 2016).
2 methods of computation
In this study we solved the Cauchy problem for equations of one–dimensional radiation hydrodynamics and turbulent convection with initial conditions corresponding to hydrostatic equilibrium. Initial conditions were determined from stellar evolution computations. Below we briefly describe the methods employed to calculate the stellar evolutionary models and nonlinear stellar pulsations.
2.1 stellar evolution
Evolutionary sequences were computed with the MESA code version 8845 (Paxton et al., 2011; 2013; 2015). Evolution of isotopic abundances and the rate of energy generation were computed for the included reaction network consisting of 24 isotopes from to coupled by 42 reactions. Convection was treated through the mixing length theory by Böhm–Vitense (1958) with a mixing length to pressure scale height ratio . Mixing beyond convective boundaries was treated with an exponentially decaying diffusion coefficient (Herwig, 2000)
| (1) |
where is the local pressure scale height, is the convective diffusion coefficient (Langer, 1985) at the layer inside the convection zone and distant from the Schwarzschild boundary by , is the radial distance from this layer. For all convection zones an adjustable parameter is .
The mass loss rate during the red giant evolutionary stage preceding core helium ignition was evaluated in units of following the prescription of Reimers (1975)
| (2) |
For the AGB stage we followed the prescription of Bloecker (1995)
| (3) |
All the evolutionary sequences were computed with mass loss parameters and .
2.2 nonlinear stellar pulsations
Equations of one–dimensional radiation hydrodynamics were solved together with transport equations for time–dependent convection in spherically–symmetric geometry (Kuhfuß, 1986). The system of equations and the adopted parameters of the convection model are described in our previous paper (Fadeyev, 2015).
Hydrodynamic computations were carried out on the Lagrangian grid consisting of mass zones. The larger number of mass zones was found to provide a better convergence of the Newton–Raphson iteration procedure in calculation of more luminous hydrodynamic models. The mass intervals of the Lagrangian grid increase geometrically inwards but 100 to 400 innermost intervals geometrically decrease. Such an approach allowed us to significantly reduce approximation errors of difference equations near the bottom of the convection zone where the pressure and the temperature abruptly increase inwards.
The inner boundary of the hydrodynamic model is set at the layer with radius , where is the outer radius of the hydrostatically quilibrium evolutionary model. Both the radius and the luminosity at the inner boundary of the hydrodynamic model are assumed to be time–independent. Initial values of the variables defined at the zone centers and the zone interfaces of the Lagrangian grid were obtained by means of interpolation of the evolutionary model data (the radius , the luminosity , the total pressure and the temperature as a function of mass coordinate ). Interpolation errors played the role of initial hydrodynamic perturbations.
Solution of the equations of hydrodynamics with respect to time was accompanied by evaluation of the kinetic energy of pulsation motions
| (4) |
where is the gas flow velocity at the –th zone interface and is the mass of the interval between –th and –th zone interfaces. Radial pulsations of red giants are described by standing waves to a good accuracy, so that the kinetic energy changes during the pulsation cycle by several orders of magnitude. Therefore, to determine the pulsational instability we evaluated the maximal over the pulsation cycle values . In the case of pulsational stability exponentaially reduces with time . To be confident that all pulsation modes are stable the computations were continued until the kinetic energy decreases by several orders of magnitude in comparison with the energy of initial perturbation.
In the case of pulsational instability the stage of exponential growth of the kinetic energy is followed by the stage of the limit cycle when becomes time–independent. It should be noted that the limit–cycle condition is fulfilled to a good accuracy only for less luminous red giants. Increase of luminosity is accompanied by growth of the amplitude of limit cycle oscillations so that models of more luminous stars show significant nonlinear effects responsible for amplitude and period irregularities.
After the cease of the growth of the hydrodynamic computations were carried out for each model on the time interval comprising from to pulsation cycles in order to evaluate the pulsation period and the mean radius of the photosphere . To this end we used a discrete Fourier tranform of the temporal dependences of and . The pulsation constant was evaluated from the period–mean density relation
| (5) |
3 results of computations
The life–time of the red giant evolving through the early asymptotic giant branch (eAGB) stage is several times longer than the following stage of the thermally pulsing helium shell source (TP–AGB). Moreover, the eAGB star is in hydrostatic and thermal equilibrium whereas thermal pulses during the TP–AGB stage lead to thermal imbalance in the stellar envelope. Therefore below we discuss the pulsational properties of eAGB and TP–AGB stars separately.
3.1 eAGB stars
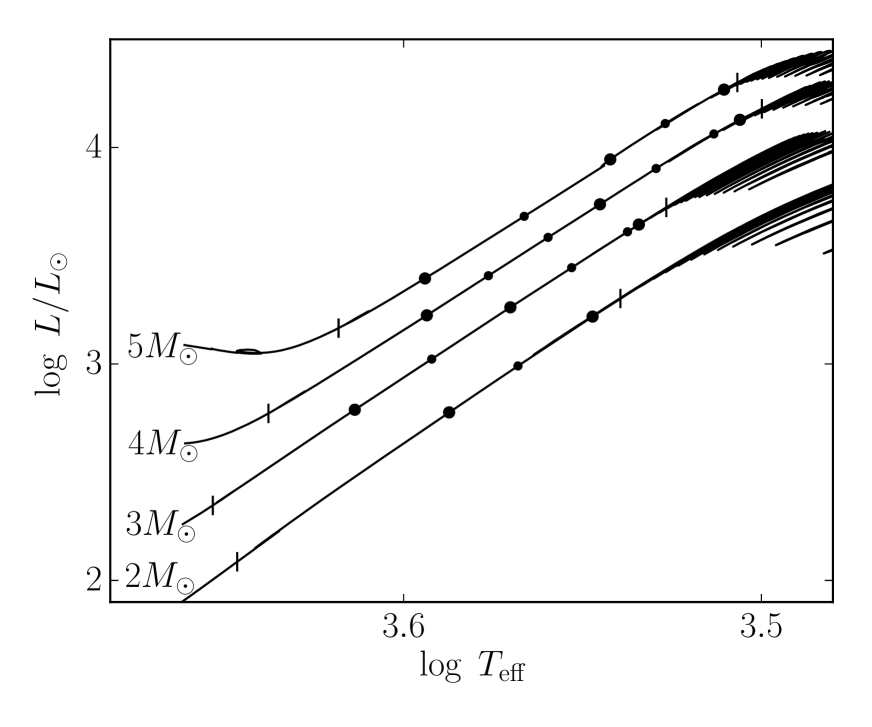
In this study we consider the eAGB stage as the time interval between the end of helium core burning and the first thermal pulse of the helium shell source. Evolutionary tracks and location of hydrodynamic models of eAGB stars on the H–R diagram are shown in Fig. 1. Large filled circles indicate the models with parameters listed in Table 1, where , and are the mass, the surface luminosity and the surface radius of the evolutionary model, respectively. The mean radius of the photosphere and the mean effective temperature are determined for the limit cycle pulsations of the hydrodynamic model. The pulsation period and the pulsation constant are expressed in days. The amplitude of the surface radial displacement in units of the initial surface radius , the amplitude of the surface velocity and the amplitude of bolometric light variations are given in last three columns.
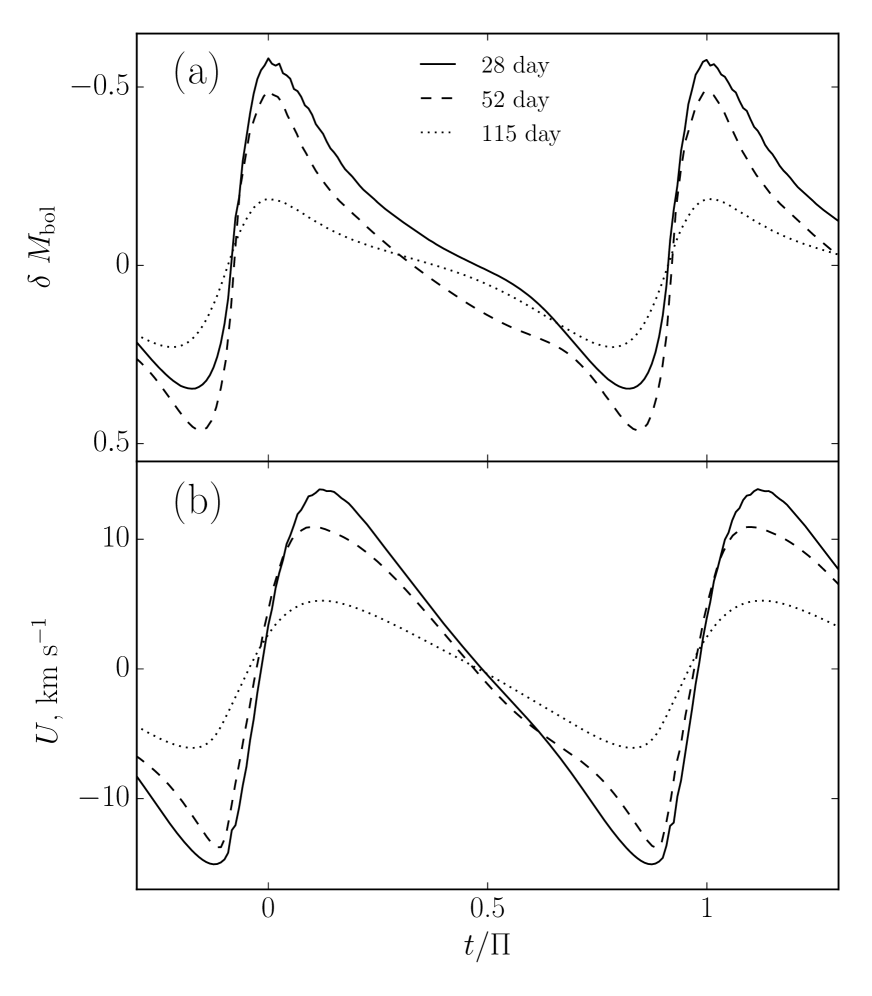
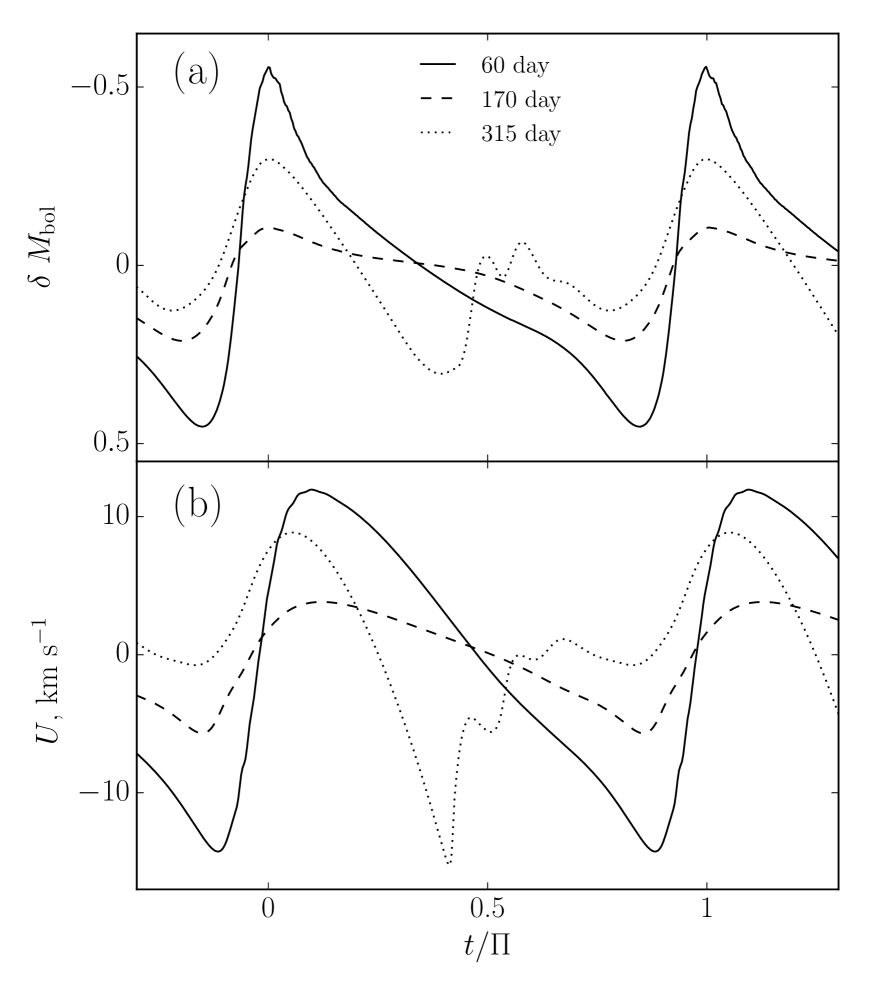
All eAGB red giants were found to be the fundamental mode pulsators with periods from 15 to 400 day. Figs. 2 and 3 show the bolometric light and the surface velocity curves of eAGB models of the evolutionary sequences with initial masses and , respectively. The plots exhibit interesting features. First, the amplitude of radial oscillations reduces as the star ascends the AGB. This is due to the mass growth of the outer convection zone. The pulsation amplitude reaches the minimum before the first thermal pulse. Second, models with initial masses and pulsation periods d show the presence of the hump on the bolometric light and the surface velocity curves.
Evolution of the eAGB red giant is accompanied by increase of the pulsation period and the rate of period change but even in most luminous red giants the rate of period change is insignificant: .
3.2 TP–AGB stars
Dependence of pulsation properties of TP–AGB stars on the stellar mass , the surface luminosity and chemical composition is quite complicated. In particular, hydrodynamic models of the evolutionary sequence exhibit fundamental mode pulsations near the minimum of the surface luminosity and first overtone pulsations at the maximum luminosity (Fadeyev, 2016). Hydrodynamic computations done in the present study show that fundamental mode and first overtone pulsations appear in stars with initial mass , whereas more massive red giants pulsate only in the fundamental mode.
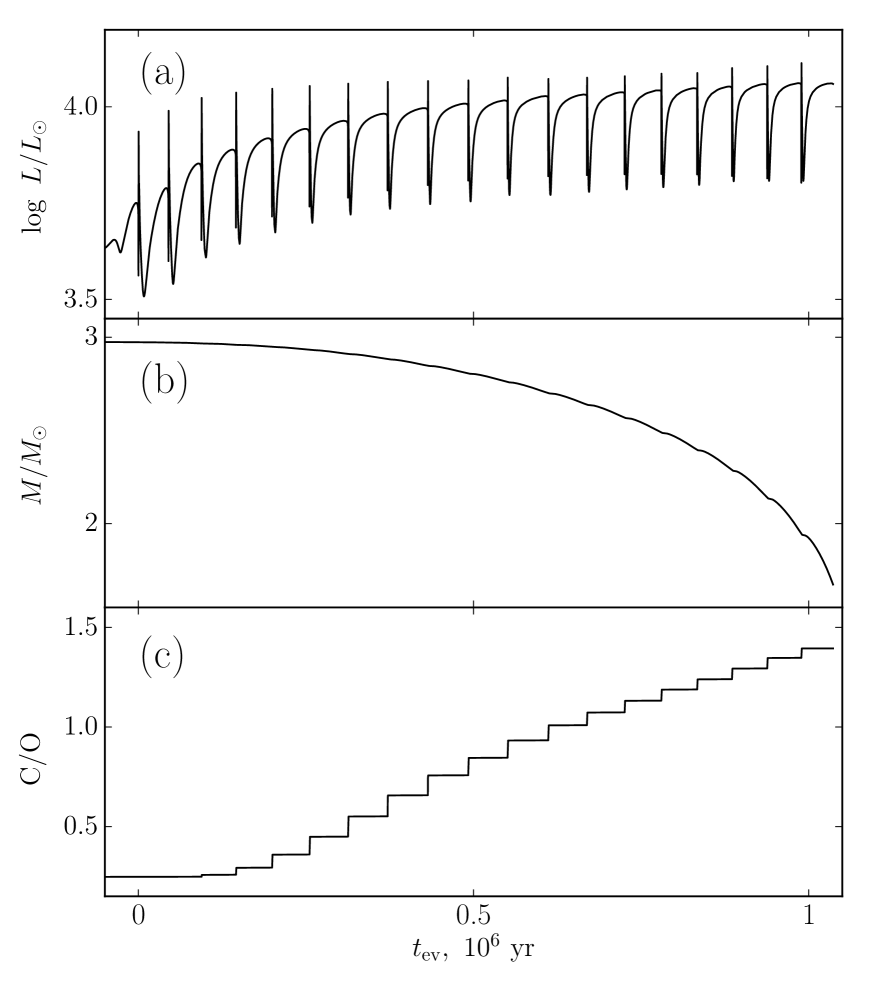
Red giants with initial mass and . Fig. 4 shows the plots of temporal dependences of the surface luminosity , the stellar mass and the surface carbon to oxygen mass fraction ratio C/O for stars of the evolutionary sequence . The time interval comprises 19 thermal pulses of the helium shell source. For the sake of convenience hereinafter the evolutionary time is set to zero at the first thermal flash. The evolutionary sequence shown in Fig. 4 involves red giants of spectral types M () and spectral types C (). Enrichment of outer stellar layers by products of nucleosynthesis is slower in stars with lower initial mass. The models of evolutionary sequence were computed for the first 16 thermal flashes and the carbon to oxygen mass fraction was
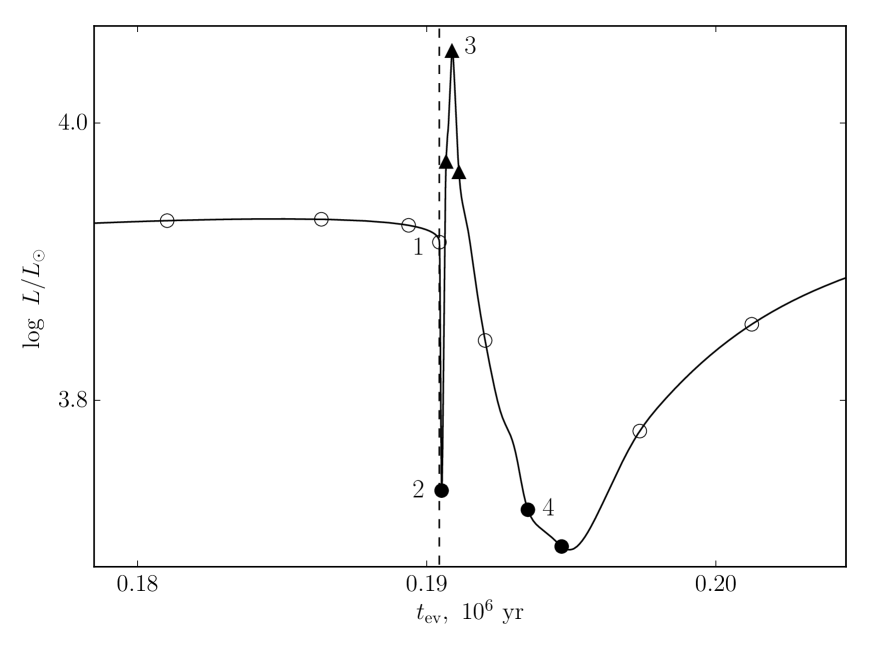
In the present study we paid special attention to rapid temporal changes of stellar luminosity and radius that occur after the luminosity maximum of the helium shell source and are responsible for secular period changes observed in Myra–type variables. Fig. 5 shows the surface luminosity of the red giant with initial mass as a function of evolutionary time during the fifth thermal pulse. Filled circles and filled triangles indicate the mean luminosity of hydrodynamic models with pulsations in the fundamental mode and in the first overtone. Hydrodynamic models with decaying oscillations are marked by open circles.
The plot in Fig. 5 shows that during the thermal flash the stellar oscillations change from the fundamental mode to the first overtone and vice versa. Moreover, the regions of pulsational instability in the fundamental mode and in the first overtone are separated by the region of decaying oscillations. Therefore, one may expect that together with secular period change some Mira–type variables may exhibit secular change of the pulsation amplitude. Indeed, simultaneous long–term changes of the period and the light amplitude are observed in R Cen (Hawkins et al., 2001) and T UMi (Szatmáry et al., 2003; Uttenthaler et al., 2011). Unfortunately, in the present study detailed analysis of this interesting feature of Miras is impossible because of the steady–state inner boundary conditions implying the constant radius and the constant luminosity at the bottom of the pulsating envelope.
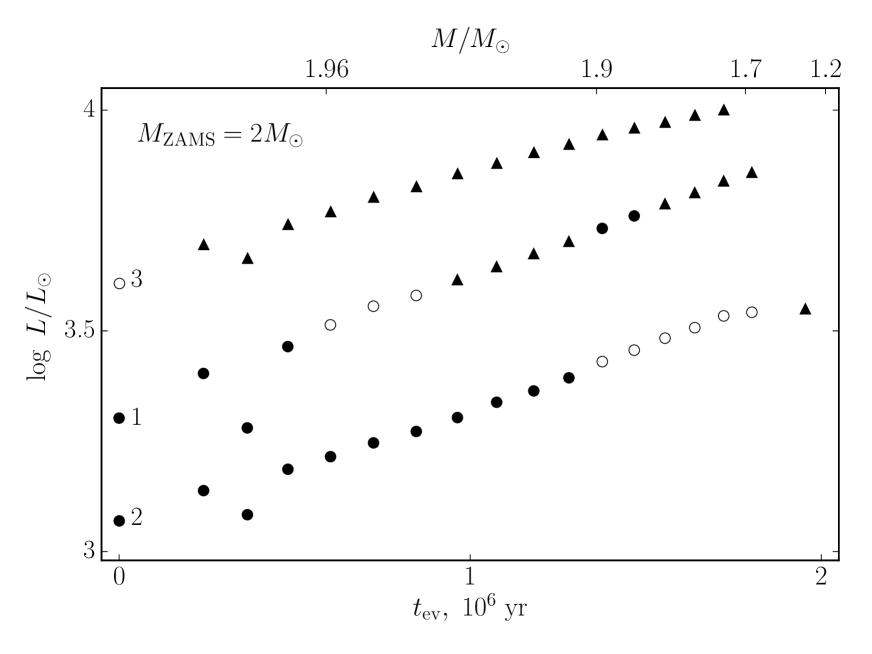
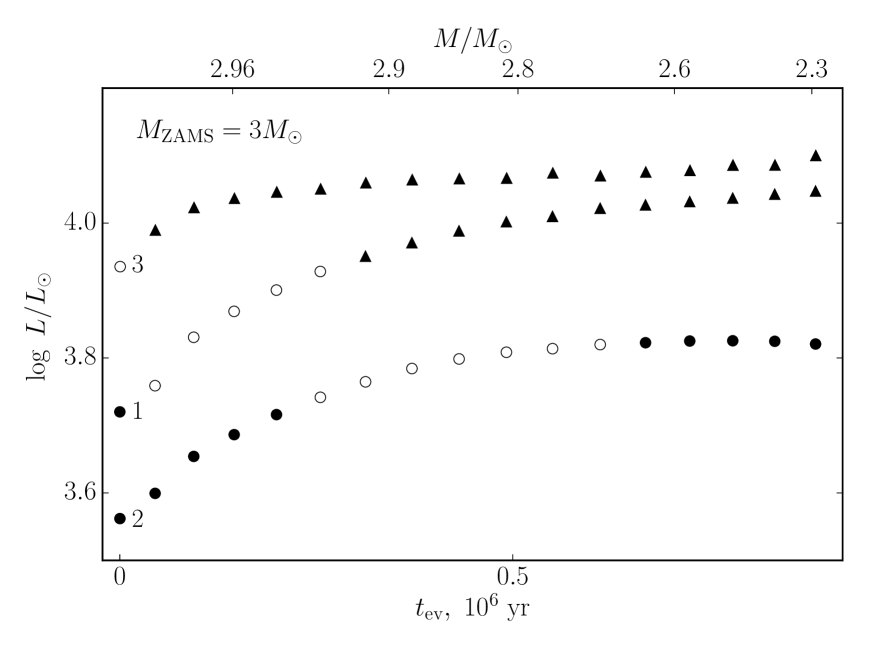
As can be seen in Fig. 5, the order of the oscillation mode depends on the surface luminosity of the star. However evolution of the red giant on the TP–AGB stage is accompanied by change of the mass, luminosity and the chemical composition that are responsible for instability of pulsation modes. Changes in pulsation mode are shown in Figs. 6 and 7 for hydrodynamic models of evolutionary sequences and . Each thermal pulse is represented by three points with modes designatef as in Fig. 5. The first point corresponds to the maximum of the luminosity of the helium shell source, the second and the third points represent the minimum and the maximum surface luminosity (see Fig. 5). Dependence of the pulsation mode on evolutionary changes of the stellar structure is clearly seen in Fig. 7 due to transition from pulsational stability at the minimum surface luminosity (the thermal pulses ) to fundamental model pulsations for .
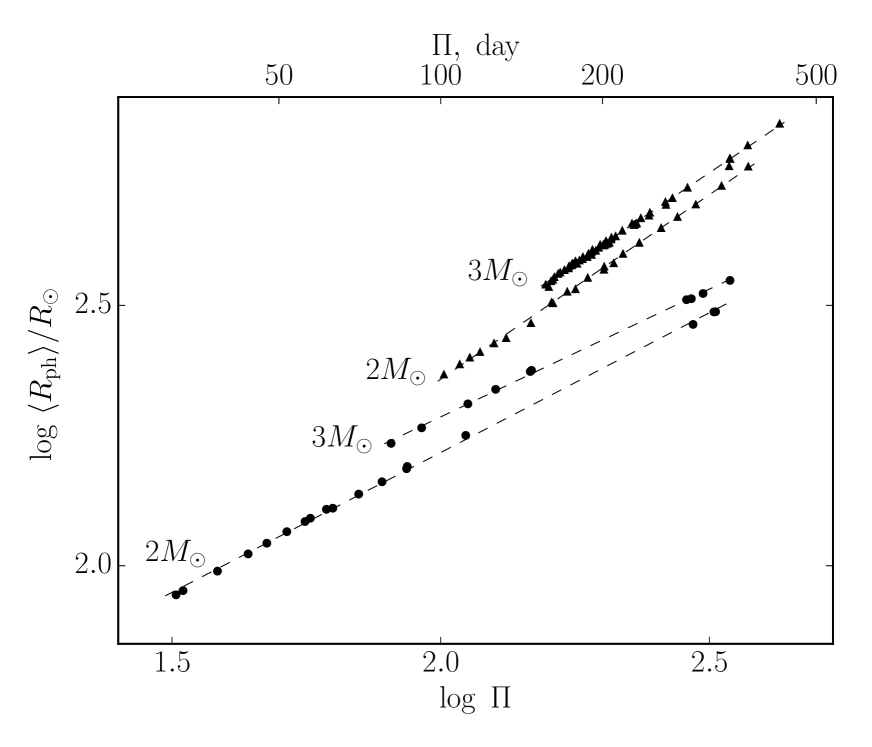
Typical values of the pulsation period of the fundamental mode and the first overtone are illustrated by period–radius dependences in Fig. 8. Approximate linear fits of these dependences are given by
| (6) |
for and
| (7) |
for . The pulsation period is expressed in days.
Red giants with initial mass and . Hydrodynamic models of TP–AGB stars with initial mass and were computed for evolutionary time intervals comprising first six thermal flashes. All the models show pulsational instability in the fundamental mode with periods from 60 to day. Approximate linear fits of the period–radius relation are written as
| (8) |
4 The rate of period change
In comparison of theoretical models with Mira–type variables of greatest interest are the pulsation period and the rate of period change . In the present study we approximately evaluated for three evolutionary time intervals with most rapid change of the surface luminosity of the star. Boundaries of the intervals are marked in Fig. 5 by numbers from 1 to 4. The period change rate was evaluated from the difference of period values at the interval boundaries. In the case of decaying oscillations or pulsations in the different mode on the edge of time interval we computed additional hydrodynamic models and estimated the period change rate within the narrower time interval.
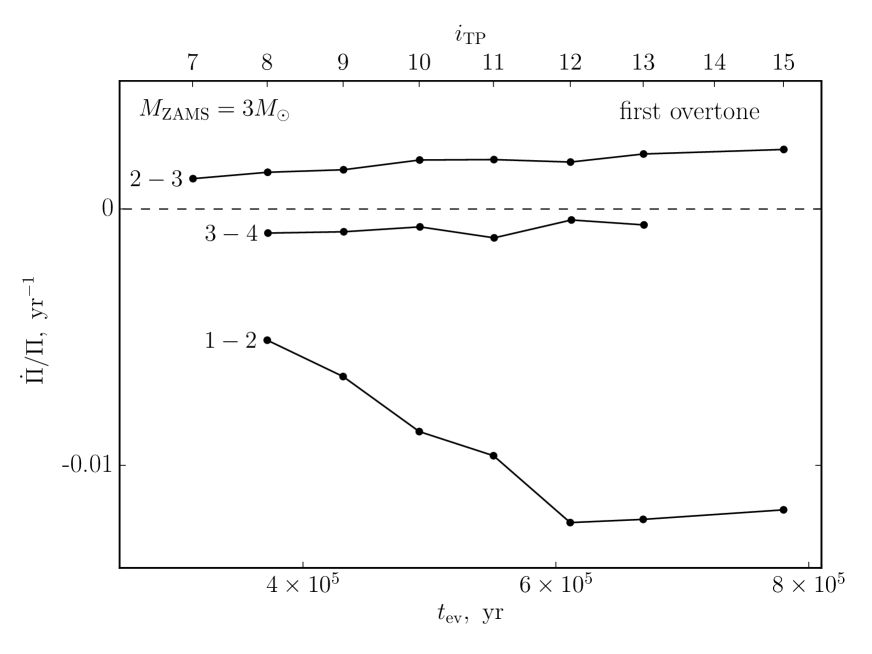
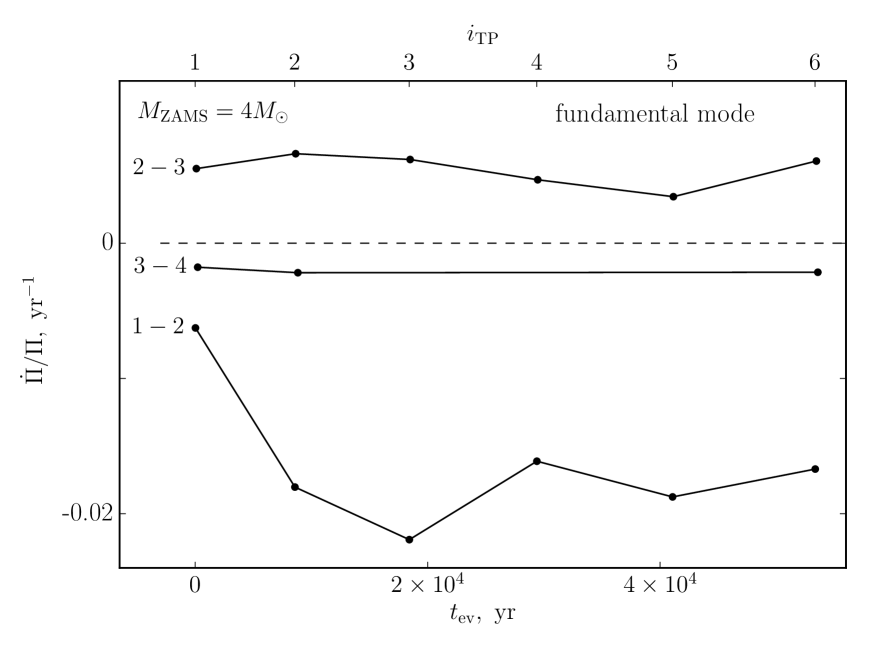
Figs. 9 and 10 show the approximate estimates of the period change rate evaluated as
| (9) |
where – is the time interval and and are the pulsation periods at the edges of the interval. It should be noted that plots in Fig. 9 correspond to stellar pulsations in the first overtone of the models whereas plots in Fig. 10 represent the models pulsating in the fundamental mode.
Mean values of for four evolutionary sequences are given in the last three columns of Table 2. One should note that the mean value of the period change rate for the evolutionary sequence might be underestimated due to frequent mode switches (see Fig. 6) as well as because of the insufficient number of hydrodynamic models pulsating in the fundamental mode. For models of the evolutionary sequence the mean values of were evaluated for thermal pulses when the period change rate is roughly time–independent. For evolutionary sequences and mean values of the period change rate were evaluated for .
5 conclusions
This study was aimed to investigate the conditions corresponding to pulsations of AGB stars in different radial modes. We have shown that eAGB stars represent a homogeneous group of fundamental mode pulsators with periods from 10 to 400 day, whereas TP–AGB stars show different pulsation properties depending on the initial stellar mass. In particular, TP–AGB stars with initial masses continue to pulsate in the fundamental mode with periods as long as day. Less massive red giants () evolving through the TP–AGB phase show more intricate pulsation properties. In particular, depending on the mass and the surface luminosity they pulsate either in the fundamental mode or in the first overtone. The upper limit of the first overtone period is day for and day for . Moreover, evolutionary changes of the stellar structure may lead to temporary decay of radial oscillations. Mira–type variables R Cen and T UMi seem to belong to such objects.
This study was aimed also to compare theoretical estimates of period change rates in AGB stars with observations. Pulsation periods of most investigated Miras T UMi and LX Cyg change with rates and , respectively (Templeton et al., 2005). As we can see from Table 2, the theoretical estimates are in good agreement with observations.
Of great importance is to evaluate the mass of TP–AGB stars using the stellar evolution and stellar pulsation computations. In particular, such an estimate can be obtained for the Mira T UMi of spectral type M5.5e (Keenan, 1966). Before the early 1970s its pulsation period was day and showed only small irregular changes. However in 1976–1979 the period of T UMi commenced abrupt decreasing with rate evaluated from to (J. Gál, Szatmáry, 1995; Mattei, Foster, 1995; Szatmáry et al., 2003). Therefore, the mass of T Umi can be estimated from the evolutionary sequence of hydrodynamic models provided that the surface luminosity and the surface radius begin to decrease at the period 315 day. First, the evolutionary sequences should be excluded since thermal pulses in these stars occur at pulsation periods day. In models of the evolutionary sequence the luminosity begins to decrease at the period day during the 15–th thermal pulse when the stellar mass is . However this model sequence should be excluded since the high carbon to oxygen mass fraction ratio () corresponds to the spectral type C. The most appropriate estimate of the stellar mass can be obtained from the evolutionary sequence for models of the 13–th thermal flash. The surface luminosity begins to decrease at the fundamental mode period day and the carbon to oxygen mass fraction ratio is . The mass and the luminosity of T UMi are and , respectively. It should be noted that these estimates are approximate and we give them to illustrate the possibility to determine the fundamental parameters of TP–AGB stars using the stellar evolution and stellar pulsation computations. For more exact estimates of the mass and the surface luminosity of T UMi we have to use more detailed grids of stellar evolution and stellar pulsation models.
references
-
1.
T. Bloecker, Astron. Astrophys. 297, 727 (1995).
-
2.
E. Böhm–Vitense, Zeitschrift für Astrophys. 46, 108 (1958).
-
3.
M. Busso, R. Gallino, and G.J. Wasserburg, Ann. Rev. Astron. Astrophys. 37, 239 (1999).
-
4.
A.N. Cox and D.A. Ostlie, Astrophys. Space Sci. 210, 311 (1993).
-
5.
A.S. Eddington and S. Plakidis, MNRAS 90, 65 (1929).
-
6.
Yu.A. Fadeyev, MNRAS 449, 1011 (2015).
-
7.
Yu.A. Fadeyev, Pis’ma Astron. Zh. 42, 731 (2016) [Astron. Lett. 42, 665 (2016)].
-
8.
J. Gál, K. Szatmáry, Astron. Astrophys. 297, 461 (1995).
-
9.
C.A. Haniff, M. Scholz, P.G. Tuthill, MNRAS 276, 640 (1995).
-
10.
G. Hawkins, J.A. Mattei, G. Foster, Publ. Astron. Soc. Pacific 113, 501 (2001).
-
11.
F. Herwig, Astron. Astrophys. 360, 952 (2000).
-
12.
K.-H. Hofmann, M. Scholz and P.R. Wood, Astron. Astrophys. 339, 846 (1998).
-
13.
Y. Ita, T. Tanabé, N. Matsunaga, Y. Nakajima, C. Nagashima, T. Nagayama, D. Kato, M. Kurita, et al., MNRAS 347, 720 (2004).
-
14.
D. Kamath, P.R. Wood, I. Soszyński, and T. Lebzelter, MNRAS 408, 522 (2010).
-
15.
D.A. Keeley, Astrophys. J. 161, 657 (1970).
-
16.
P.C. Keenan, Astropys. J. Suppl. Ser. 13, 333 (1966).
-
17.
R. Kuhfuß, Astron. Astrophys. 160, 116 (1986).
-
18.
N. Langer, M.F. El Eid and K.J. Fricke, Astron. Astrophys. 145, 179 (1985).
-
19.
D. Lorenz, T. Lebzelter, W. Nowotny, J. Telting, F. Kerschbaum, H. Olofsson and H.E. Schwarz, Astron. Astrophys. 532, A78 (2011).
-
20.
J.A. Mattei, G. Foster, JAAVSO, 23, 106 (1995).
-
21.
P.W. Merrill, Astrophys. J. 116, 21 (1952).
-
22.
E.A. Olivier and P.R. Wood, MNRAS 362, 1396 (2005).
-
23.
B. Paxton, L. Bildsten, A. Dotter, F. Herwig, P. Lesaffre and F. Timmes, Astropys. J. Suppl. Ser. 192, 3 (2011).
-
24.
B. Paxton, M. Cantiello, P. Arras, L. Bildsten, E.F. Brown, A. Dotter, C. Mankovich, M.H. Montgomery, et al., Astropys. J. Suppl. Ser. 208, 4 (2013).
-
25.
B. Paxton, P. Marchant, J. Schwab, E.B. Bauer, L. Bildsten, M. Cantiello, L. Dessart, R. Farmer, et al., Astropys. J. Suppl. Ser. 220, 15 (2015).
-
26.
G. Perrin, S.T. Ridgway, B. Mennesson, W.D. Cotton, J. Woillez, T. Verhoelst, P. Schuller, V. Coudé du Foresto, et al., Astron. Astrophys. 426, 279 (2004).
-
27.
J.R. Percy and T. Colivas, Publ. Astron. Soc. Pacific 111, 94 (1999).
-
28.
M. Perl and Y. Tuchman, Astrophys. J. 360, 554 (1990).
-
29.
D. Reimers, Problems in stellar atmospheres and envelopes (Ed. B. Baschek, W.H. Kegel, G. Traving, New York: Springer-Verlag, 1975), p. 229.
-
30.
R.L. Smith, W.K. Rose, Astrophys. J. 176, 395 (1972).
-
31.
K. Szatmáry, L.L. Kiss, and Zs. Bebesi, Astron. Astrophys. 398, 277 (2003).
-
32.
M.R. Templeton, J.A. Mattei, and L.A. Willson, Astron. J. 130, 776 (2005).
-
33.
Y. Tuchman, N. Sack, Z. Barkat, Astrophys. J. 219, 183 (1978).
-
34.
Y. Tuchman, N. Sack, Z. Barkat, Astrophys. J. 234, 217 (1979).
-
35.
P.G. Tuthill, C.A. Haniff, J.E. Baldwin, and M.W. Feast, MNRAS 266, 745 (1994).
-
36.
S. Uttenthaler, K. van Stiphout, K. Voet, et al., Astron. Astrophys. 531, A88 (2011).
-
37.
J. Weiner, Astrophys. J. 611, L37 (2004).
-
38.
P.R. Wood, Astrophys. J. 190, 609 (1974).
-
39.
P.R. Wood and D.M. Zarro, Astrophys. J. 247, 247 (1981).
-
40.
P.R. Wood and K.M. Sebo, MNRAS 282, 958 (1996).
-
41.
P.R. Wood, C. Alcock, R.A. Allsman, D. Alves, T.S. Axelrod, A.C. Becker, D.P. Bennett, K.H. Cook, et al., Asymptotic Giant Branch Stars, IAU Symp. 191 (Ed. T. Le Bertre, A. Lèbre, C. Waelkens, The Astronomical Society of the Pacific., 1999), p. 151.
-
42.
P.R. Wood, E.A. Olivier and S.D. Kawaler, Astrophys. J. 604, 800 (2004).
-
43.
A. Ya’ari, Y. Tuchman, Astrophys. J. 514, L35 (1999).
| , day | , day | , km/s | ||||||
|---|---|---|---|---|---|---|---|---|
| 2 | 1.965 | 598 | 54.6 | 15.5 | 0.0524 | 0.14 | 26 | 0.84 |
| 1.965 | 1656 | 109.2 | 46.8 | 0.0572 | 0.17 | 21 | 0.85 | |
| 3 | 2.977 | 614 | 49.0 | 11.2 | 0.0543 | 0.10 | 24 | 0.56 |
| 2.977 | 1827 | 103.2 | 34.8 | 0.0561 | 0.17 | 26 | 0.94 | |
| 2.975 | 4408 | 189.2 | 110.7 | 0.0658 | 0.13 | 12 | 0.46 | |
| 4 | 3.963 | 1678 | 88.9 | 24.1 | 0.0546 | 0.17 | 36 | 1.11 |
| 3.962 | 5467 | 200.4 | 95.1 | 0.0630 | 0.16 | 19 | 0.83 | |
| 3.908 | 13432 | 376.1 | 375.8 | 0.0840 | 0.46 | 25 | 0.71 | |
| 5 | 4.938 | 2484 | 107.8 | 29.1 | 0.0545 | 0.19 | 43 | 1.32 |
| 4.933 | 8816 | 257.9 | 134.8 | 0.0670 | 0.13 | 9 | 0.24 | |
| 4.870 | 18522 | 432.8 | 399.2 | 0.0831 | 0.54 | 30 | 0.96 |
| mode | ||||
|---|---|---|---|---|
| 2 | 0 | -0.002 | ||
| 3 | 1 | -0.010 | 0.002 | -0.001 |
| 4 | 0 | -0.016 | 0.005 | -0.002 |
| 5 | 0 | -0.020 | 0.005 | |