Character Networks and Book Genre Classification
Abstract
We compare the social character networks of biographical, legendary and fictional texts, in search for marks of genre differentiation. We examine the degree distribution of character appearance and find a power law that does not depend on the literary genre or historical content. We also analyze local and global complex networks measures, in particular, correlation plots between the recently introduced Lobby (or Hirsh ) index and Degree, Betweenness and Closeness centralities. Assortativity plots, which previous literature claims to separate fictional from real social networks, were also studied. We’ve found no relevant differences in the books for these network measures and we give a plausible explanation why the previous assortativity result is not correct.
keywords:
Social networks; Character networks; Lobby index; Hirsch indexPACS Nos.: ****
1 Introduction
Social networks gathered from literary texts have been studied from some years now. Most of the analyses characterized the networks of pure fictional texts with different indexes [1, 2, 3, 4, 5, 6]. Others proposed or tested automatic social network extraction algorithms [7, 8].
We examined a different aspect of character networks, comparing social networks extracted from texts with pure fictional, legendary and biographical types, called “genres”. The aim of the study is to find a measure or method that is able to separate the literary social networks into genres.
We apply a recent node centrality index, the Lobby index [9, 10], also called Hirsh index [11, 12], to literary networks, analyzing the correlation between it and Degree, Betweenness and Closeness centralities. Indeed, we study the degree distribution of character appearances and a simple but meaningful index, in such context, that we’ve called Happax Legomena (HL) whose meaning we borrow from corpus linguistics.
Previous literature claimed that some measures (degree, clustering coefficient, assortativity) can distinguish character networks from real social networks [13, 14]. We argue that this claim is probably incorrect because the examined corpus (Marvel Universe) has a biographical-like nature similar to our corpus (where such indexes are non discriminative), which differs from real social (e.g., Facebook) networks that have no central character.
2 Materials and Methods
We use the following definition of fictional, legendary and biographical works:
- Biographical
-
works are those recognized as such by modern standards describing details of a person’s life. The biographies are the books:
- Legendary
-
texts are those that, in the view of modern scholars, contain fictional narratives mixed with possible biographical traces. In this genre are the books:
- Fiction
-
is denoted as texts that are recognized as such by the author of the book. The books classified as such are:
All networks were generated from the books using characters as nodes and characters’ encounters represented as undirected links without the existence of self-loops. We gathered all data, with exception of David Copperfield and Huckleberry Finn that were obtained from Stanford GraphBase project [22]. The data files for each book contain the characters represented by two-letter, for example, the label GA in hobbit.dat file represents the character Gandalf of Hobbit book. Sometimes a group of people is considered like acting as a character, for example, the Thessalians (TH) in Apollonius of Tyana (apollonius.dat). The links are represented as “cliques of encounters”, for example, the entry AP,DM,KB in Apollonius of Tyana represents the encounter among Apollonius, Damis and the king of Babylon. The nodes are separated by comma and the cliques by semicolon.
We calculated the following measures using graph-tool [25] library: density , average clustering coefficient , Degree , node Betweenness and Closeness . We also wrote Python scripts to evaluate the Lobby index for node centrality [9, 10, 11, 12] and Assortativity plots [26, 14]. Additional information about project’s data and source code can be found at Github page called charnet222https://ajholanda.github.io/charnet/.
The density of a network is the ratio of the number of links and the possible number of links
| (1) |
where is the number of links and is the number of nodes.
The number of neighbors of node is its degree . The network average degree is . The clustering coefficient is calculated as follows:
| (2) |
where is the number of links between the neighbors of node .
For nodes in the social network, we can use the following measures of centrality:
-
•
The Degree normalized by the number of nodes not including :
; -
•
The Betweenness centrality , defined as the number of shortest paths that pass through a node , normalized by the number of pair of nodes not including , that is ;
-
•
The Closeness centrality , defined as the sum of shortest distances between a node and all other reachable nodes, normalized to a maximum value ;
-
•
The Lobby index, which is the maximum number such that the node has at least neighbors with degree larger than or equal to , normalized as , because the maximum degree of a node is , when it is linked with all nodes but self-loop in the network.
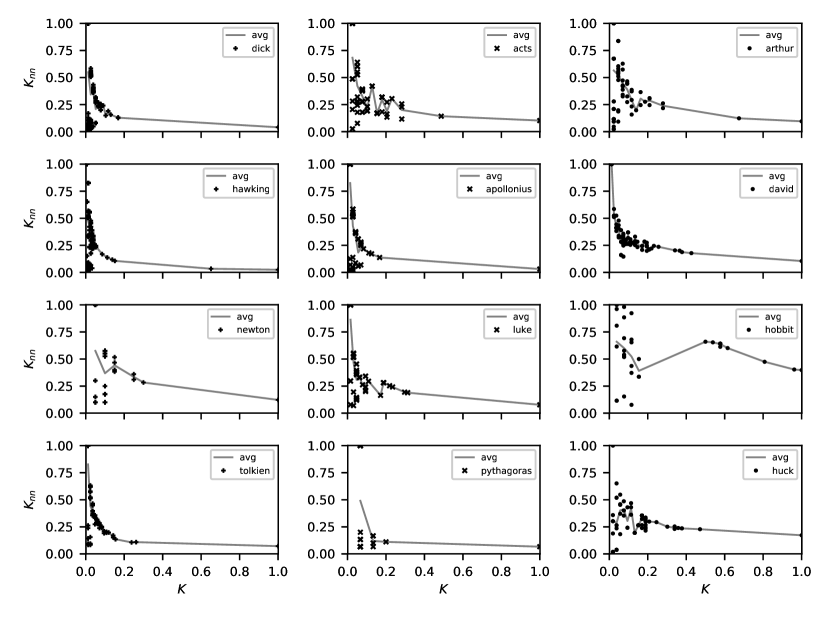
We’ve also analyzed the Assortativity mixing [26, 14] by plotting the average degree of neighbors of a node as a function of its degree . An assortative mixing is found when the slope of the curve is positive, and a disassortative mixing is found when the slope is negative.
We’ve studied the degree distribution of a given character in the network fitting data using powerlaw [27] package. Finally, we’ve counted characters that appear only once which is called Hapax Legomena and twice which is called Dis Legomena.
3 Results
Global indexes.
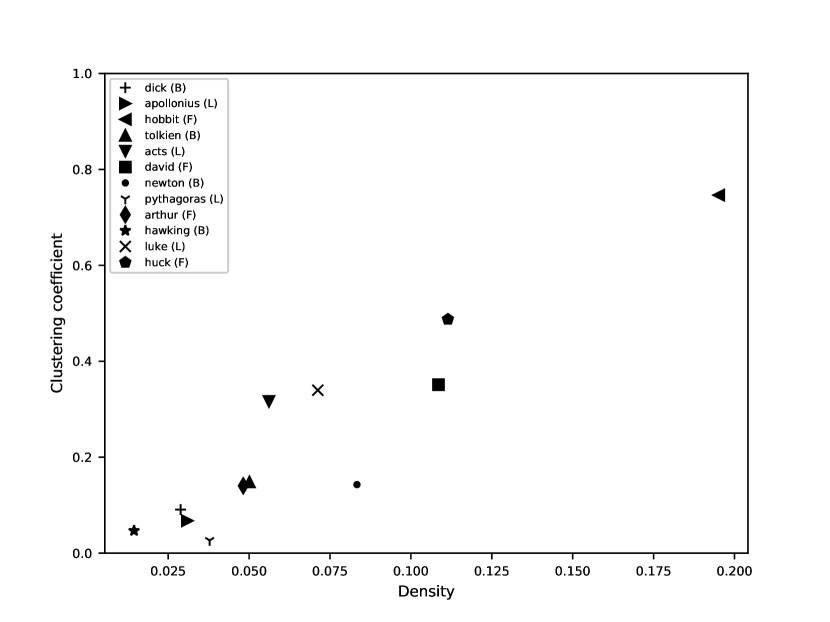
Table 1 indicates that Density values for fiction texts were larger () than other genres in our sample. The exception is Arthur that could also be considered legendary and has the actions concentrated on the main character, King Arthur, that is characteristic of a biography. Legendary and biographical texts are normally dedicated to describe the story of a few main characters with secondary characters orbiting around them and with few links among secondary characters. For example, in Apollonius of Tyana, Appolonius, Damis and Iarchas are the most proeminent characters with 151, 40 and 33 appearances, respectively. After them, king Phraotes, king of Babylon and Menippus appear only 13, 12 and 11 times respectively, with few interactions (degree), 5, 5 and 8, respectively.
Global network data, average degree , density and clustering coefficient . \toprule Genre Book \colruleBiography Dick 115 189 3.297.27 0.029 0.091 Tolkien 94 219 4.669.04 0.050 0.149 Newton 33 44 2.673.29 0.083 0.143 Hawking 249 446 3.5811.51 0.014 0.047 \colruleLegendary Apollonius 95 138 2.917.37 0.031 0.067 Acts 76 160 4.215.14 0.056 0.316 Pythagoras 41 31 1.512.18 0.038 0.027 Luke 76 203 5.348.10 0.071 0.340 \colruleFiction Hobbit 41 160 7.807.43 0.195 0.746 David 87 406 9.3310.49 0.109 0.351 Arthur 77 141 3.665.98 0.048 0.140 Huck 74 301 8.147.34 0.111 0.488 \botrule
We do not find any clustering trend for these global measures in the plot of vs showed in
Figure 1.
Node centrality indexes.
The individual centrality indexes are Degree , Betweenness , Closeness and Lobby . As we have four quantities, one could examine six types of correlation plots for each of the books, that is, at first we should report plots. Here we choose to concentrate the analysis on the least studied Lobby index versus the other classical indexes, so we report only , and .
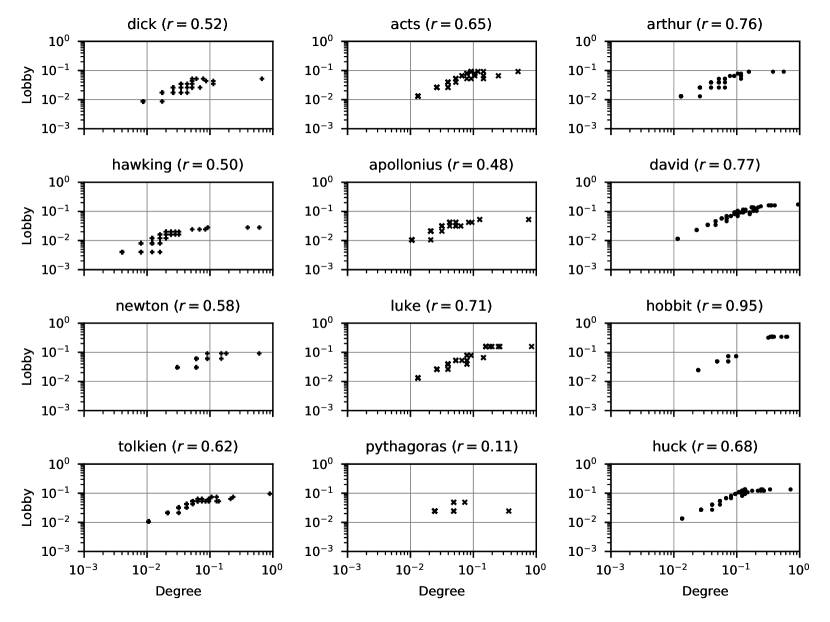
We plot the normalized Lobby index vs normalized degree for all characters in Figure 2333Some graphs, as Pythagoras, show few points because they have the same coordinates.. We can see that there is an initial linear correlation between the Degree and Lobby indexes followed by a saturation in almost all graphs. This behavior can be explained by the fact that it is much difficult for Lobby index to continue increasing after a certain value of degree. For example, it is possible for the central character to have degree (he/she meets all the other characters) but to have , the graph must be complete where not only the central nodes link to all other nodes, but any of their neighbors link to all other nodes too.
By the comparison of the twelve plots, we noticed that Lobby and Degree are well correlated, with the exception of Pythogoras that suffers from finite size effect (, ). Even though the measures have a good degree of correlation, the genres cannot be classified by applying Lobby vs Degree correlation. See, for example, the plots for David, Luke and Tolkien are almost indistinguishable.
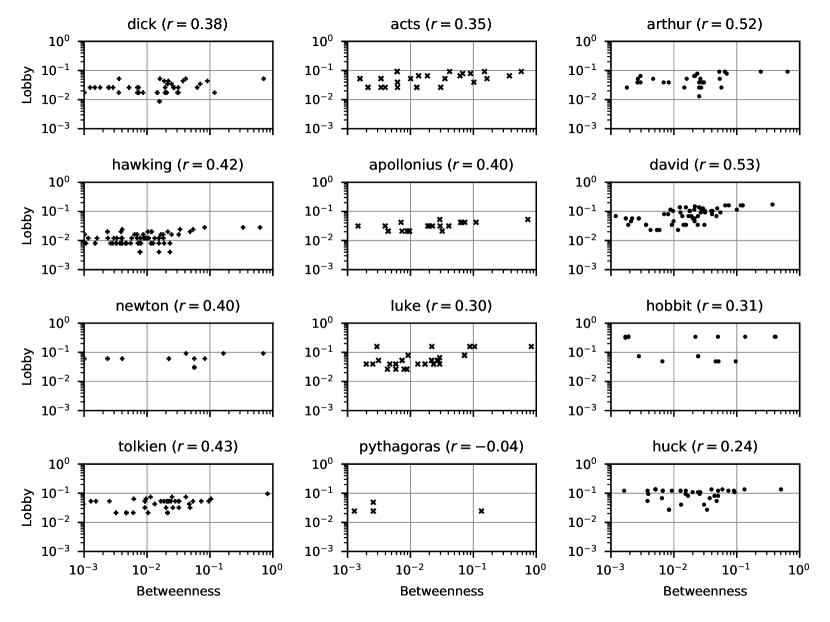
The Pearson correlation is low between Lobby vs Betweenness (Figure 3). We’ve noticed that the correlation is larger for biographies than for most of the fictional and legendary texts. However, the fictional book Arthur has a larger correlation than Tolkien, reinforcing the biographical-legendary nature of the text previously discussed.
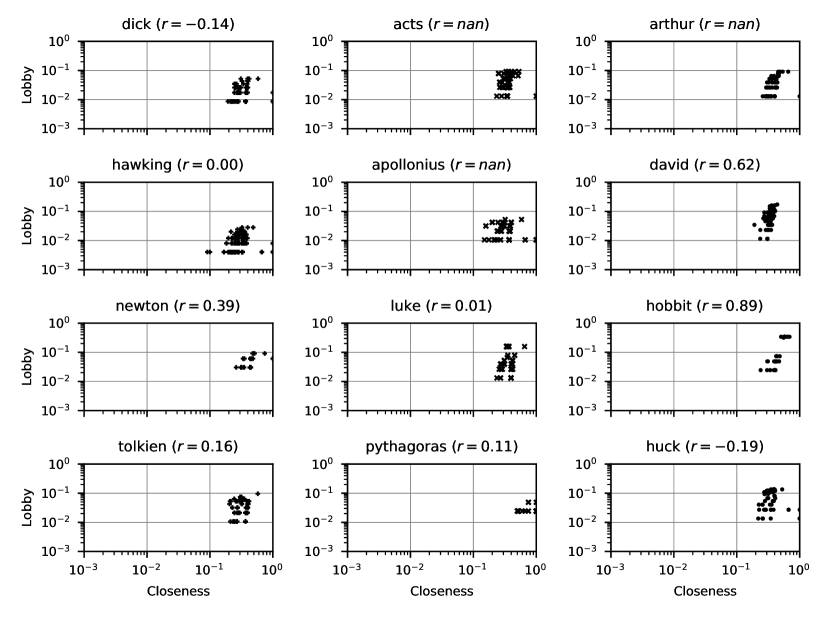
We’ve observed an interesting phenomenon in the Lobby vs Closeness plot (Figure 4). It shows clusters in the data, a feature found in a study of biological networks [10]. It seems that Lobby can detect communities that the other indexes couldn’t. So, anew, these correlation plots cannot separate the book genres.
The Figure 5 presents the Assortativity plots where each point is the degree for a given character of degree . The plot also shows the average . We’ve observed that it doesn’t matter the book genre, all plots are disassortative. Disassortativity means that characters with high degree interact preferentially with characters with low degree. An explanation is that all books have been selected as fictional or not biographies of central characters and there is no coexistence of several strong characters, perhaps with the exception of Peter and Paul in Acts.
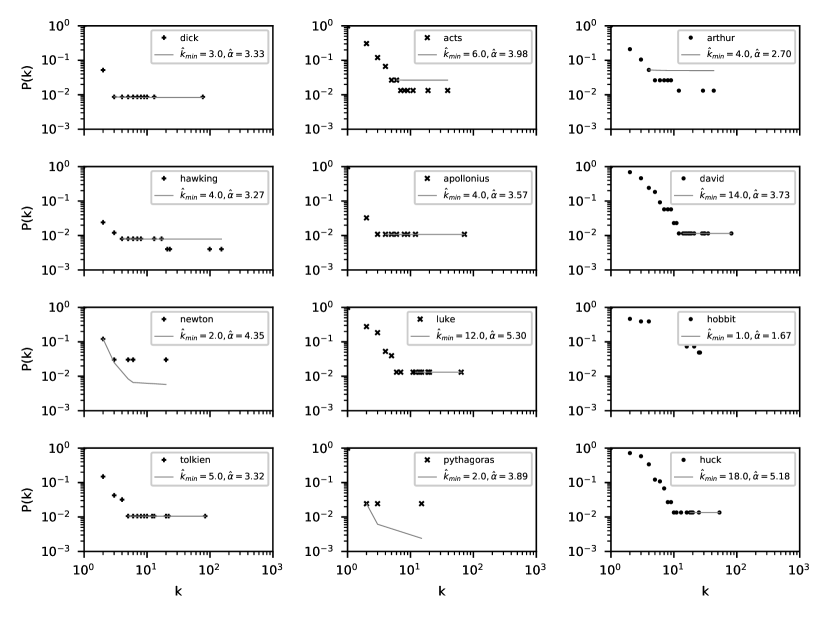
Degree distribution.
We plot the degree distribution
so that each character now has a degree and a cumulative
probability . The Figure 6 presents the
for all books.
Hapax Legomena.
From literary criticism, we have words that appear a single time in a text named Hapax Legomena. Here we consider only Hapax Legomena (HL) for character labels, that is, labels with frequency . They are presented in Table 3, with the books ranked from the largest to the lowest Hapax Legomena ratio (number of labels with divided by total number of characters ).
Number of character names that are Hapax legomena divided by total number of characters. \toprule Genre Book \colruleBiography Tolkien 43/94 = 0.457 Dick 45/115 = 0.391 Hawking 76/249 = 0.305 Newton 10/33 = 0.303 \colruleLegendary Pythagoras 34/41 = 0.829 Acts 51/76 = 0.671 Luke 51/76 = 0.671 Apollonius 62/95 = 0.653 \colruleFiction Huck 32/74 = 0.432 Arthur 31/77 = 0.403 David 26/87 = 0.299 Hobbit 07/41 = 0.171 \botrule
The reasoning for using the Hapax Legomena to separate the books is the following: for a fictional text, it seems unusual the author to have the effort to create a character but use it only once. But for biographies, this seems to pose no problem. So the conclusion would be that fictional texts have less Hapax Legomena than the other genres. Surprisingly, this trend does not appear in our Table 3. The fact that the legendary texts have the larger Hapax Legomena fraction seems to be more related to the fact that they are small texts compared to the other books, so that there is less space to cite the same character several times.
4 Discussion
The separation of book genres based on complex networks indexes is a hard task. But we’ve concluded that even negative results are very interesting because they refute, in a Popperian way, the conjecture that network indexes could separate literary social networks. For example, Alberich et al. [13] noticed differences between the average degree and clustering coefficients of the Marvel Universe (MU) network and non-literary social networks. In the MU, there is a predominance of a few characters (for example Captain America and Spider Man) with very large degree. Also, Gleiser [14] pointed out that the MU is very different from real social networks because it is disassortative.
However, low average degree, low clustering coefficient and disassortative behavior also occurred in our character networks, because they are based in biographical-like texts which imply very central characters (e.g, Arthur, Jesus or Stephen Hawking). That is, our data suggests that Alberich et al. and Gleiser findings can be alternatively explained considering that Marvel books are a “biographical” texts of a few central heroes that should not be compared with usual (e.g., Facebook) social networks.
Indeed, the hard task to distinguish real from purely fictional social networks becomes harder when we add legendary texts, which we define as text that cannot be trusted as historical biographies but could have some historical traces due to oral traditions. We have no certainty that the social network described is fictional or some information refers to true historical social relations. This is the case of the narratives about Pythagoras, Jesus of Nazareth, the first apostles and Apollonius of Tyana.
The degree distribution followed a power law that does not depend on the literary genre studied (see Figure 6). Even though this statement needs to be confirmed with a larger corpora, it suggests that is not a good measure to distinguish historical from fictional texts, which is our primary objective.
In the case of global measures average degree, density and average clustering coefficient (Table 3), we’ve observed no trend that splits the genres. This result suggests that they aren’t good metrics to classify the texts because they are linked with size and length of the network and don’t take into account the weight of the links, for example, to highlight the importance of frequent interactions that could help in the discrimination of biographical or legendary texts.
A legendary or biographical text normally has few characters with high degree and some links with high weight; the same arrangement normally doesn’t occur with fictional texts. In our study, for example, in Apollonius of Tyana book (), the highest weighted link has 35 interactions ( of the encounters) between Apollonius () and Damis (); while in Huckleberry Finn (), Huckleberry () is tied with the highest weighted link with 28 interactions ( of the encounters) between him and Jim () . In the biography of Stephen Hawking (), Hawking () meets Jane () 108 times (); while in David Copperfield, David () meets Betsey () 54 times (). Using the same reasoning as in Hapax Legomena, this is not an universal law but it can help to figure out the genre a book is most likely to fit in.
Recently, Ronqui and Travieso [28] proposed that the analysis of correlations between centrality indexes is interesting to characterize and distinguish between natural and artificial networks. In these plots, each point refers to one character. We examined the correlation plots for the Lobby index vs Degree (Figure 2), Betweenness (Figure 3) and Closeness (Figure 4). Such comparisons revealed that social networks, fictional and legendary or historical are very similar and they cannot be distinguished.
Although these are negative results, we think that they are important ones. After all, with such small sample, we cannot aim to have corroboration by induction (a large number of results suggesting clear clustering). Indeed, even with perhaps a sample of one thousand books, there’s no guarantee that in the next one studied conclusions will be refuted. On the other hand, negative results refute conjectures. And, indeed, our small sample refutes a lot of a priori conjectures concerning the capacity of traditional network indexes or Hapax Legomena to separate the genres.
5 Conclusion and Perspectives
In this paper we examined three questions: first, is there some difference among pure fictional social networks (centered in a main character), legendary social networks and networks extracted from a historical biography? Second, are there complex network indexes with potential to separate these genres? Third, what is the behavior of the recently introduced Lobby index in this respect?
This preliminary study is important by proposing the problem and exploring its possible solutions. Even with a small sample, our findings seems to refute some ideas such as comparing degree distributions. By examining local node centrality indexes like Degree, Closeness, Betweenness and Lobby, what we obtain is that to separate the genres by using only the social networks is a hard and non trivial task. Although negative, these results are important as guide for future research.
To overcome the limitations of this paper, we foresee only a methodological advance: to have a good Natural Language Processing algorithm that extracts automatically social networks from raw texts. Since this methodology is yet under development [7, 8], our study can be thought as both preliminary and as a benchmark for further studies.
Acknowledgments
This paper results from research activity on the FAPESP Center for Neuromathematics (FAPESP grant 2013/07699-0). OK acknowledges support from CNPq and Núcleo de Apoio á Pesquisa CNAIPS-USP. MM received support from PUB-USP.
Author contributions statement
GMLB, SMSPF, MM and AJH extracted the books character networks and character frequency data. AJH organized the public database, performed the complex network analyses and analyzed the data. OK proposed the original problem and analyzed the data. AJH and OK wrote the paper. All authors reviewed the manuscript.
Competing financial interests
The authors declare no competing financial interests.
References
- [1] Y.-M. Choi, H.-J. Kim, A directed network of greek and roman mythology, Physica A 382 (2) (2007) 665–671.
- [2] P. Mac Carron, R. Kenna, Universal properties of mythological networks, EPL (Europhys Lett.) 99 (2) (2012) 28002.
- [3] A. Agarwal, A. Corvalan, J. Jensen, O. Rambow, Social network analysis of alice in wonderland, in: Workshop on Computational Linguistics for Literature, 2012, pp. 88–96.
- [4] P. Mac Carron, R. Kenna, A quantitative approach to comparative mythology, Cosmos 14 (2013) 103–117.
- [5] R. Kenna, P. Mac Carron, Maths meets myths: Network investigations of ancient narratives, in: Journal of Physics: Conference Series, Vol. 681, IOP Publishing, 2016, p. 012002.
- [6] M. A. Ribeiro, R. A. Vosgerau, M. L. P. Andruchiw, S. E. d. S. Pinto, The complex social network of the lord of rings, Rev. Bras. Ens. Fís. 38 (1).
- [7] D. K. Elson, N. Dames, K. R. McKeown, Extracting social networks from literary fiction, in: Proceedings of the 48th Annual Meeting of the Association for Computational Linguistics, Association for Computational Linguistics, 2010, pp. 138–147.
- [8] S. Grayson, K. Wade, G. Meaney, D. Greene, The sense and sensibility of different sliding windows in constructing co-occurrence networks from literature, in: Computational History and Data-Driven Humanities: Second IFIP WG 12.7 International Workshop, CHDDH 2016, Dublin, Ireland, May 25, 2016, Revised Selected Papers 2, Springer, 2016, pp. 65–77.
- [9] A. Korn, A. Schubert, A. Telcs, Lobby index in networks, Physica A 388 (11) (2009) 2221–2226.
- [10] M. G. Campiteli, A. J. Holanda, L. D. Soares, P. R. Soles, O. Kinouchi, Lobby index as a network centrality measure, Physica A 392 (21) (2013) 5511–5515.
- [11] L. Lü, T. Zhou, Q.-M. Zhang, H. E. Stanley, The h-index of a network node and its relation to degree and coreness, Nat. Commun 7 (2016) 10168.
- [12] R. Pastor-Satorras, C. Castellano, Topological structure and the h index in complex networks, Phys. Rev. E 95 (2) (2017) 022301.
- [13] R. Alberich, J. Miro-Julia, F. Rosselló, Marvel universe looks almost like a real social network, arXiv preprint cond-mat/0202174.
- [14] P. M. Gleiser, How to become a superhero, J. Stat. Mech. Theor. Exp 2007 (09) (2007) P09020.
- [15] J. Gleick, Isaac Newton, Vintage Books, New York, 2004.
- [16] A. Peake, A Life of Philip K. Dick: The Man Who Remembered the Future, Arcturus Publishing, 2013.
- [17] H. Carpenter, J.R.R. Tolkien: a biography, Houghton Mifflin Harcourt, Boston, 2014.
- [18] J. Hawking, Travelling to Infinity, WF Howes Limited, 2015.
- [19] American Holy Bible, The Revised American Standard Version Bible Society, 2011.
- [20] C. P. Jones (Ed.), Philostratus: The Life of Apollonius of Tyana, Harvard University Press, Cambridge, 2005.
- [21] T. Taylor, Iamblichus’ Life of Pythagoras, Inner Traditions/Bear & Co, Rochester, 1986.
- [22] D. E. Knuth, The Stanford GraphBase: A Platform for Combinatorial Computing, ACM Press and Addison-Wesley, 1994.
- [23] J. Tolkien, The Hobbit, Houghton Mifflin Harcourt, Boston, 2012.
- [24] B. Cornwell, The winter king: a novel of Arthur, Penguin, London, 2007.
- [25] T. P. Peixoto, The graph-tool python library, figshare,doi:10.6084/m9.figshare.1164194.
- [26] R. Pastor-Satorras, A. Vázquez, A. Vespignani, Dynamical and correlation properties of the internet, Physical review letters 87 (25) (2001) 258701.
- [27] J. Alstott, E. Bullmore, D. Plenz, powerlaw: A python package for analysis of heavy-tailed distributions, PLOS ONE 9 (1) (2014) 1–11. doi:10.1371/journal.pone.0085777.
- [28] J. R. F. Ronqui, G. Travieso, Analyzing complex networks through correlations in centrality measurements, J. Stat. Mech. Theor. Exp 2015 (5) (2015) P05030.