Galactic hum
Francesco Mulargia
Dipartimento di Fisica e Astronomia,
Università di Bologna, viale Berti Pichat 8
40127 Bologna, Italy (francesco.mulargia@unibo.it)
Abstract
A number of earth’s tremor spectral peaks show a persistent narrow bandwidth incompatible with any geophysical or instrumental origin. These peaks, located at frequencies lower than a few mHz, are in principle consistent with the earth strain waves induced by monochromatic gravitational waves. Exploring this hypothesis under the current cosmological constraints yields that the tremor peaks below 2 mHz are in apparently significant coincidence with the theoretical emission of two binary systems each consisting of a small main sequence star with mass , captured by Sgr A* in a close orbit.
Keywords: gravitational wave detectors and experiments; noise; seismicity; surface waves and free oscillations; 04.80.Nn, 05.40.Ca, 91.30.Dk, 91.30.Fn
Introduction
Seismic tremor, i.e., the continuous background motion of the earth apparent in seismic and gravimetric records, also known with the name of earth’s hum, shows a number of narrow ”anomalous” spectral peaks significant beyond 3 (Nawa et al. 1998; Tanimoto et al., 1998; Thomson & Vernon 2015). These peaks, which are located in the sub-mHz and mHz band – and occur in correspondence with solar acoustic modes (see Table 1) – can hardly be ascribed to instrumental effects, nor can they be produced by the earth elastic response to the continuous broadband excitation by infragravity sea waves, which constitute the main tremor source (Webb 2008).
Explanations have been advanced in terms of some yet unknown acoustic-magneto-elastic effect of the sun on the earth (Thomson & Vernon 2015), and of an elastic excitation of the earth from persistent monochromatic gravitational waves of cosmic origin, which would equally affect the earth and the sun, given their comparable gravitational cross-sections (Mulargia 2017). Here, we further explore the latter hypothesis taking into account the known cosmological evidence and focusing our attention at frequencies below 2 mHz, where most of the unexplained peaks occur.
The earth as a low frequency gravitational detector
The viscoelastic gravitational cross section of the earth can be written as a function of its mass and geometric area as (ibid.)
| (1) |
where is the Schwarzschild radius, the wave frequency and the gravitational constant, with attaining the quite large value of several m2 per mHz. Combined with this, two intrinsic amplification mechanisms nominate the earth as a low-frequency gravitational wave detector.
First, its elastic response to gravitational wave excitation at frequencies proximal to its eigenmodes produces an amplification by a factor . In fact, the earth behaves as a damped harmonic oscillator with quality factor (see table 1) which, once the system has attained dissipative equilibrium, resonates amplifying the excitation signal. Note that equilibrium is attained after cycles, i.e., in the mHz frequency band we consider, after no less than several hours, restricting detectability to monochromatic and persistent signals.
Second, the main source of terrestrial tremor is constituted by oceanic wave-wave and wave-bottom interactions (e.g., Webb, 2008), which are 1) highly nonlinear, 2) acting upon an excitable system dominated by noise and 3) ruled by thresholds (e.g., Schwartz & Fenton 1982). Such systems are known to produce stochastic amplification under rather general conditions (Benzi et al 1981; McNamara et al. 1988; Jung & Hänggi 1991). Stochastic amplification is the – somehow counterintuitive – statistical facilitation of the transition to a higher energy state by the addition of random noise, and is known to affect a wide variety of nonlinear noisy phenomena ruled by thresholds, from neuron firing to climate cycles, digital image dithering, superconducting quantum interference, bistable lasers, etc. (for a quite comprehensive list see e.g., Gammaitoni et al. 1998). The relevance of stochastic amplification to the present case stems from the experimentally observed modulation of the narrow spectral peaks by the background noise level (Nawa et al. 1998; Tanimoto, 1998; Webb, 2008).
Hence, the measured tremor monochromatic displacement at the frequency is equal to the gravitational excitation displacement , amplified by an elastic response factor (tied to the proximity of to an eigenmode and its related ) and by a stochastic factor (tied to the background noise level and dynamics), i.e., .
Due to the perturbation induced by earth daily rotation, the gravitational wave sources are likely to be fewer than the number of tremor peaks. In fact, the earth rotates at the frequency mHz and perturbs any excitation at frequency by inducing a Zeeman-like splitting of into the singlets . Such a splitting, called Coriolis splitting, is routinely observed right after large earthquakes, which make the whole earth ”ring” (Dahlen & Tromp 1998), and is also apparent in narrow tremor spectral peaks (Thomson & Vernon 2015; Mulargia 2017).
Compatible sources
Since the gravitational wave (from now on GW) emission power depends on the time variation of the source quadrupole moment, a most effective GW source consists of massive compact rotating binary systems, with orbital eccentricity also playing a substantial role (Peters & Mathews 1963; Pierro et al. 2001).
From the above arguments and Kepler’s 3rd law we may define the set of binary systems of total mass illuminating the earth with a monochromatic GW power flux at the frequency from a distance as (Mulargia, 2017)
| (2) |
which provides the total mass - distance source ratios compatible with a measured power flux at a given frequency.
Experimental vs theoretical spectra
We consider here (Table 1) the unexplained tremor narrow spectral peaks located below 2 mHz, for which consistent evidence exists relative to time intervals up to three continuous years (Nawa 1998; Thomson & Vernon 2015).
Among the best known gravitational source candidates are the binary systems consisting of a compact object captured in close orbit by a supermassive black hole (from now on SMBH), the nearest of which is obviously Sgr A*. Extensive numerical simulations of the capture and orbital evolution of such systems (Sigurdsson & Rees 1997; Freitag 2003; Barack & Cutler 2004) show that most GW emission from captured flying-by compact objects – be them stellar black holes (from now on BH), neutron stars (from now on NS), white dwarfs (from now on WD) and small main sequence stars with mass (from now on SMSS) – occur in the 0.1 - 5 mHz frequency band, and with a comparable power in several spectral components.
Namely, each compact body flying by the SMBH at a distance is captured in a highly elliptical orbit, with initial (e.g., Freitag, 2003, Fig.1). In such an orbital capture, the moment of inertia of the SMBH-compact body binary experiences a strong change, emitting gravitational waves at the expense of the system energy. Initially, the GW emission occurs in ”bursts” near perihelion, while orbits become progressively less eccentric, at a rate . However, most gravitational energy is not emitted at plunging, but throughout the whole orbital evolution, and consists of monochromatic GW wavetrains in the Hz frequency band, with an emission life longer the lighter the compact body. In particular, a SMSS-SMBH binary would orbit with eccentricities around 0.5 for most of its life, emitting stably with little frequency drift and with power increase factors of 3-7 with respect to a circular orbit Freitag 2003; Barack & Cutler 2004).
The inspiral orbiting would end for all such binaries with a plunging of the compact body on the SMBH, accompanied by a high frequency GW chirp (e.g., Abbott et al. 2016). However, this would not occur for the SMSS–SMBH binaries, which die by slow tidal disruption of the SMSS during several decades (Rees 1988; Lin et al. 2017).
Discussion
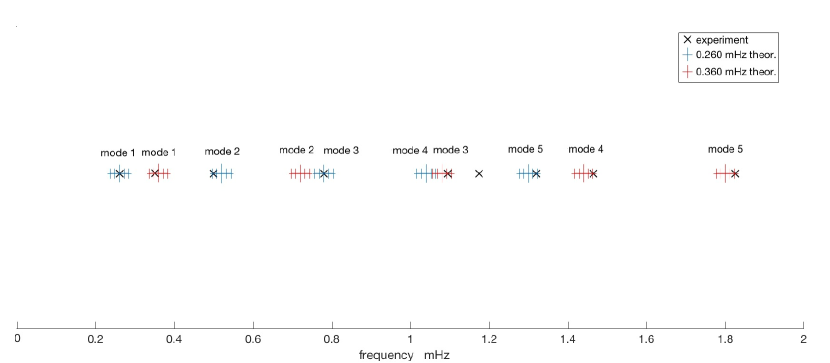
Let us compare the experimental unexplained narrow tremor peaks of table 1 with the theoretical emission of the mentioned GW sources. According to the above amplification arguments, we expect the lowest frequency signal by the earth fundamental eigenmode, which is at 0.309 mHz. In fact, the lowest fequency peaks are in its proximity, at and mHz. We simply hypothesize that they are produced by two GW sources, and the other peaks are their spectral overtones up to order 5 (see Fig. 1). We consider the Coriolis frequency splitting induced by Earth rotation at , with mHz and the additional frequency perturbations induced by the lateral heterogeneities of the earth, i.e., its ellipsoidal shape and the inhomogeneities in its internal structure (Dahlen & Tromp 1998). Since these effects are of the order of a few Hz, we account for them altogether by considering bands around each theoretical mode. In doing so, we find a theoretical - experimental match for 8 tremor spectral peaks out of 9: two of the theoretically predicted peaks are absent, respectively the 4th (at 1.040 mHz) of the mHz, and the 2nd of the (at 0.720 mHz), while the experimental peak at 1.175 mHz is left theoretically unexplained.
Assuming the experimental peaks to be independent and identically distributed according to a uniform distribution with mean equal to the empirical mean, such a match can be ascribed to random chance with a probability . Here is the number of matches, the integer part and the frequency bin , with the number of experimental peaks, the number of theoretical modes, and the total frequency interval considered. Given that , we have , corresponding to a random chance level . Incidentally, we note also that the 2.614 mHz tremor peak considered by Mulargia (2017) would occur by the 10th spectral overtone of the mHz fundamental.
The 0.260 mHz peak is about % off the closest earth eigenmode, , which occurs at 0.309 mHz with a , so that only a modest elastic response amplification can be expected (a factor ). The other spectral peaks share a closer proximity to an earth eigenmode, mostly occurring within a few percent (table 1). Given that these eigenmodes have values, an amplification by elastic response of the incoming GEW by a factor can be expected (Mulargia 2017). A similar factor can be expected for stochastic amplification in light of the narrow spectral peaks modulation by background tremor, which raises them to amplitudes at least one order of magnitude larger in winter for stations in the northern hemisphere, when oceanic noise greatly increases. Hence, GEW amplitude can be estimated from measured tremor amplitude as .
Given the measured displacement power spectral density , the displacement amplitudes at can be written as (cf. Mulargia & Kamenshchik 2016) , where is the spectral bandwidth, and , respectively the upper and lower corner frequencies around . Considering, for example, the peak at 0.360 mHz, we have m2/Hz in ”quiet” seismic records (Peterson 1993; Castellaro & Mulargia 2012) and Hz, m, while gravimetric records, with the superior sensitivity of superconducting gravimeters below 1 mHz, yield measured amplitudes m (Widmer-Schnidrig 2003; Rosat et al. 2003). These stand for GEW amplitudes m, or, given the average velocity of elastic waves in the earth mantle of m/s, rms strains , coincident in both frequency and amplitude with those theoretically calculated for the gravitational emission of compact body - Sgr A* binary systems (Freitag 2003, Fig. 2; Barack & Cutler 2004, Fig. 11).
Binary systems with compact bodies other than SMSS would rapidly evolve into merging, emitting near monochromatic GW for just a few decades, while the SMSS - Sgr A* systems would emit with very small frequency drift for years (ibid.). In addition, the current cosmological, microlensing and density constraints (Alcock et al. 1996; Ado et al. 2014, Abbott et al. 2016), suggest an expected number of GW monochromatic signals with , i.e., detectable by one year long eLISA future missions, in number for binaries formed by Sgr A∗ with a BH and a NS, with a WD and with a SMSS of mass (Freitag 2003). Since such a resolving power in the mHz band is likely to be achieved by adequately long records of the earth’s tremor (Mulargia & Kamenschick 2016; Mulargia 2017), like the ones used to identify the anomalous spectral peaks in table 1, the above coincidences appear consistent also with the expected source numerosity.
Conclusions
Gravitational waves illuminating the Earth may induce detectable seismic tremor. Thanks to its size and structure, the gravitational wave ”stopping power” of the earth is considerable, with a cross section m2 in the mHz band. This, together with its elastic response amplification, the stochastic amplification provided by ocean dynamics, and the intrinsic stability of seismographs and gravimeters, makes the earth a low-frequency gravitational wave detector with a strain sensitivity in the mHz band.
A number of earth’s tremor narrow spectral peaks, measured by independent observers and not amenable to a terrestrial origin, show remarkable coincidences with those theoretically calculated for the gravitational wave emission of compact bodies orbiting Sgr A*, following their capture. While these compact bodies could be either a stellar black hole, a neutron star, a white dwarf, or a small main sequence star, their relative cosmological abundance suggests the latter as much more likely. In particular, the earth tremor ”anomalous” spectral peaks below 2 mHz are in apparently significant coincidence with the gravitational wave emission of two binary systems consisting of a star with mass of the order of captured by Sgr A* in a close orbit. Such binaries would not die by merging, and therefore would not lead to any signal detectable by terrestrial gravitational interferometers, which operate at frequencies above 10 Hz.
Acknowledgments
The author is indebted to Alberto Sesana, Luca Ciotti, Giancarlo Setti, Bruno Marano and Philip B. Stark for enlightening discussions.
REFERENCES
Abbott, B., et al. (LIGO Sci. Coll. & Virgo Coll.), 2016, Phys. Rev. Lett., 116, 061102
Ado et al. (Planck coll.), 2014, Astron. Astrophys., 571, A16
Alcock, C., Allsman, R. A., Axelrod, T. S., et al. 1996, 461, 84
Benzi, R., Sutera, A. , & Vulpiani, A., 1981, J. Phys. A 14, L453
Barack, L., & Cutler, C., 2004, Phys, Rev. D 69, 082005
Castellaro, S., & Mulargia, F., 2012, Seismol. Res. Lett., 83, 39
Dahlen, F. A. & Tromp, J. T. 1998, Theoretical global seismology, (Princeton: Princeton Press)
Dziewonski, A. M. & Anderson, D. L., 1981, Phys. Earth Plan. Interiors, 25, 297
Freitag. M., 2003, Astrophys. J., 583, L21
Gammaitoni, L., Hängii, P., Jung, P. & Marchesoni, F., 1998, Rev. Mod. Phys., 70, 223
Jung, P. & Hängii, P., 1991, Phys. Rev. A, 44, 8032
Lin, D. et al., 2017, Nature Astron., Article 0033
McNamara, B., & Wiesenfeld, K., & Roy, 1988, Phys. Rev. Lett., 60, 2626
Mulargia, F., 2017, MNRAS 464, L11-L15 (2017) doi:10.1093/mnrasl/slw180
Mulargia, F., & Kamenshchik, A., 2016, Phys. Lett. A, 380, 1503
Nawa, K., Suda, N., Fukao, Y., Sato, T., Aoyama, Y., & Shibuya, K., 1998, Earth Plan. Space, 50, 3
Peterson, J., 1993, USGS Open-File Report 93-322
Pierro, V., Pinto, I. M., Spallicci, A. D., Laserra, E., & Recano, F., 2001, MNRAS, 325, 358
Rees, M.J., 1988, Nature, 333, 523
Rosat, S., et al., 2003, Phys. Earth. Plan. Int., 140, 183
Schwartz, L. W., & Fenton, J. D., 1982, Ann. Rev. Fluid Mech., 14, 39
Sigurdsson, S., & Rees, M.J., 1997, MNRAS, 284, 318
Tanimoto, T., Um, J., Nishida, K., & Kobayashi, N, 1998, Geophys. Res. Lett., 25, 1553
Thomson, D. J. & Vernon, F. L. III, 2015, Geophys. J. Int., 202, 1690
Webb, S. C., 2008, Geophys. J. Int., 174, 542
Widmer-Schnidrig, R., 2003, Bull. Seismol. Soc. Am, 93, 1370
| Tremor f, mHz | Earth Mode | f, mHz | Q | Solar Mode | f, mHz |
|---|---|---|---|---|---|
| 0.309 | 463 | 0.255 | |||
| 0.260 | |||||
| 0.379 | 250 | 0.257 | |||
| 0.309 | 463 | 0.346 | |||
| 0.350 | |||||
| 0.379 | 250 | 0.354 | |||
| 0.469 | 421 | 0.513 | |||
| 0.500 | |||||
| 0.586 | 240 | 0.493 | |||
| 0.840 | 356 | 0.778 | |||
| 0.780 | |||||
| 0.766 | 228 | 0.784 | |||
| 1.106 | 367 | 1.083 | |||
| 1.095 | |||||
| 1.081 | 205 | 1.095 | |||
| 1.173 | 271 | 1.173 | |||
| 1.175 | |||||
| 1.220 | 196 | 1.186 | |||
| 1.368 | 292 | 1.330 | |||
| 1.320 | |||||
| 1.321 | 256 | 1.321 | |||
| 1.514 | 303 | 1.473 | |||
| 1.465 | |||||
| 1.489 | 180 | 1.467 | |||
| 1.799 | 379 | 1.823 | |||
| 1.825 | |||||
| 1.859 | 163 | 1.826 |