Molecular Gas during the Post-Starburst Phase: Low Gas Fractions in Green Valley Seyfert Post-Starburst Galaxies
Abstract
Post-starbursts (PSBs) are candidate for rapidly transitioning from star-bursting to quiescent galaxies. We study the molecular gas evolution of PSBs at . We undertook new CO (2–1) observations of 22 Seyfert PSBs candidates using the ARO Submillimeter Telescope. This sample complements previous samples of PSBs by including green valley PSBs with Seyfert-like emission, allowing us to analyze for the first time the molecular gas properties of 116 PSBs with a variety of AGN properties. The distribution of molecular gas to stellar mass fractions in PSBs is significantly different than normal star-forming galaxies in the COLD GASS survey. The combined samples of PSBs with Seyfert-like emission line ratios have a gas fraction distribution which is even more significantly different and is broader (). Most of them have lower gas fractions than normal star-forming galaxies. We find a highly significant correlation between the WISE m to m flux ratios and molecular gas fractions in both PSBs and normal galaxies. We detect molecular gas in 27% of our Seyfert PSBs. Taking into account the upper limits, the mean and the dispersion of the distribution of the gas fraction in our Seyfert PSB sample are much smaller than previous samples of Seyfert PSBs or PSBs in general .
keywords:
galaxies: active – galaxies: nuclei – galaxies: Seyfert – galaxies: starburst – galaxies: evolution – ISM: molecules1 Introduction
Despite extensive observational and theoretical studies, the physical mechanisms that regulate the star formation rates of galaxies are still poorly understood. Star formation quenching, by yet unknown mechanisms, causes star-forming galaxies to migrate to the “red sequence" (Gladders et al., 1998; Faber et al., 2007). One likely such formation of mechanism of the red-sequence is the transformation of star forming, disk-dominated, gas-rich galaxies into early types via mergers and their associated feedback (Toomre & Toomre, 1972; Hopkins et al., 2006).
Post-starburst (PSB) galaxies are candidate post-merger objects, rapidly transitioning from the blue-cloud to the red-sequence (e.g., Dressler & Gunn, 1983; Couch & Sharples, 1987; Zabludoff et al., 1996; Wild et al., 2009; Snyder et al., 2011; Yesuf et al., 2014; Pawlik et al., 2016). In their quiescent phase, their spectra reveal little-to-no current star formation, but a substantial burst of star formation before an abrupt cessation 1 Gyr ago, long enough for the ionizing O&B stars to evolve away, but recent enough for A-stars to dominate the stellar light. Recent observational efforts have enlarged the traditional definition of post-starburst to include a more complete and less biased sample of galaxies with ongoing star formation or/and AGN activity (Wild et al., 2010; Yesuf et al., 2014; Alatalo et al., 2014). With the identification of this sample, which spans the entire starburst to quenched post-starburst evolutionary sequence, better constraints on theoretical models of galaxy evolution have started to emerge. One of the the firm constraints is the observed time delay between the starburst phase and the AGN activity by about 200 Myr (Wild et al., 2010; Yesuf et al., 2014). This time delay suggests that AGN are not primarily responsible in the original quenching of starbursts but may be responsible for keeping star formation at a low level by removing gas and dust during the post-starburst phase. The other emerging but contested phenomenon is molecular gas evolution after the starburst has ended (Schawinski et al., 2009; Rowlands et al., 2015). This work aims to further examine the molecular gas evolution along the starburst sequence using both new and existing data, by adding molecular gas observations from green valley Seyfert PSBs, which were excluded from other PSB samples.
In simulations of gas-rich mergers, gas is funneled to galaxy centers, powering intense nuclear starbursts and obscured nuclear AGN activity. At the end of the starburst, the leftover gas and dust are cleared out due to feedback from the AGN (e.g., Sanders et al., 1988; Barnes & Hernquist, 1991; Silk & Rees, 1998; Di Matteo et al., 2005; Springel et al., 2005; Kaviraj et al., 2007; Hopkins et al., 2006, 2008; Wild et al., 2009; Snyder et al., 2011; Cen, 2012). For instance, Narayanan et al. (2008) found that galactic winds are a natural consequence of merger-induced star formation and black hole growth. In their simulated galaxies, the galactic winds can entrain molecular gas of M⊙, which, the authors showed, should be observable in CO emission. The molecular gas entrained in the winds driven by AGN are predicted to be longer-lived than the gas entrained solely in starburst-driven winds. The wind velocities in the simulated galaxies with AGN-feedback can reach close to 2.5 times the circular velocity. Thus, making AGN-feedback a viable mechanism to get rid off a residual gas and dust at the end of a starburst.
Despite its theoretical appeal, the evidence that connects AGN activity with the end of star-formation in galaxies has been elusive, with evidence both for (Schawinski et al., 2009; Alatalo et al., 2011; Cicone et al., 2014; García-Burillo et al., 2014) and against (Fabello et al., 2011; French et al., 2015; Geréb et al., 2015; Rowlands et al., 2015; Alatalo et al., 2016).
Now we review previous works on molecular gas contents of PSBs and AGN. Using IRAM CO observations, Rowlands et al. (2015) investigated the evolution of molecular gas and dust properties in 11 PSBs on the starburst to quenched post-starburst sequence at . Two of these PSBs are Seyfert galaxies while the rest are either star-forming or composite galaxies of star formation and AGN activity. 10/11 of the PSBs were detected in the CO (1–0) transition and 9/11 of the PSBs were detected in CO (2–1) transition. The gas and dust contents, the star-formation efficiency, the gas depletion time of majority of these PSBs are similar to those of local star-forming spiral galaxies (Saintonge et al., 2011; Boselli et al., 2014) and gas-rich elliptical galaxies (Young et al., 2011; Davis et al., 2014). In addition, the authors found a decrease in dust temperature with the starburst age but they did not find evidence for dust heating by AGN at late times.
Similarly, Alatalo et al. (2016) studied 52 PSBs with shock signatures at using IRAM and CARMA. About of half of these PSBs are at , 14/52 are Seyferts, and have CO (1–0) detections. The molecular gas properties of these PSBs are also similar to those of normal star-forming galaxies. More than of the PSBs in Alatalo et al. (2016) and Rowlands et al. (2015) samples are located in the blue-cloud.
French et al. (2015) studied 32 PSBs in the green valley at using the IRAM 30m and the Sub-millimeter Telescope (SMT). Almost all of these PSBs have signatures mimicking low-ionization nuclear emission line regions (LINERs), and 53% of them have CO detections. Those detected in CO have gas masses and gas to stellar mass fractions comparable to those of star-forming galaxies while the non-detected PSBs have gas fractions more consistent with those observed in quiescent galaxies.
The three aforementioned studies on the molecular gas contents of PSBs suggested that the end of starburst in these galaxies cannot be ascribed to a complete exhaustion or removal or destruction of molecular gas. The studies also suggested that multiple episodes of starburst or/and AGN activities may be needed for the eventual migration of these galaxies to the red-sequence and that a transition time longer than 1 Gyr may be needed for this migration to take place.
Saintonge et al. (2012) found that, among the gas-rich, disk-dominated galaxy population, those which are ongoing mergers or are morphologically disturbed have the shortest molecular gas depletion times. They found no link between the presence of AGN and the long depletion times observed in bulge-dominated galaxies. Even though their AGN sample has lower molecular gas fractions than the control sample matched in NUV-r color and stellar mass surface density, the depletion times of the two populations are similar. More than 90% of the AGN studied by Saintonge et al. (2012) are not Seyferts, and instead are LINERs.
In contrast, Schawinski et al. (2009) presented evidence that AGN are responsible for the destruction of molecular gas in morphologically early-type galaxies at . Their sample included 10 star-forming galaxies, 10 star-formation and AGN composite galaxies and 4 Seyfert galaxies. The galaxies studied by Schawinski et al. (2009) are not post-starbursts but might have experienced mild recent star-formation (see Schawinski et al., 2007). The authors found that the molecular gas mass drops significantly 200 Myr after a recent star formation in the composite galaxies, and none of their Seyferts have CO detections. The authors interpreted their observations as evidence for a destruction of molecular gas and for a suppression of residual star formation by low-luminosity AGN. Likewise, many studies have reported molecular outflows with high mass-outflow rates as evidence for AGN feedback in non-PSB AGN host galaxies (e.g., Fischer et al., 2010; Feruglio et al., 2010; Sturm et al., 2011; Spoon et al., 2013; Veilleux et al., 2013; Cicone et al., 2014; García-Burillo et al., 2014; Sun et al., 2014).
In this work, we study molecular gas in 22 green-valley, Seyfert PSBs candidates using SMT CO (2–1) observations, in combination with an existing sample of 94 PSBs from the literature. Our observations were motivated by French et al. (2015) and Rowlands et al. (2015) and were designed to be complementary to the samples in these two works. Our sample is also complementary to the recently published sample of shocked PSB galaxies (Alatalo et al., 2016), which contains 14 galaxies with Seyfert-like emission line ratios, which are mainly located in the blue-cloud. Our sample is comparable in number to the existing sample of Seyfert PSBs but represents those in the UV-optical green valley. When combined with other samples, our sample is indispensable in sampling PSBs with a variety of AGN properties.
1.1 Simple energetic argument for no feedback or delayed AGN feedback after the molecular gas fraction is
In this section, we present the condition required for momentum-driven AGN wind to clear gas in a galactic disk or very close to the galaxy, following Silk & Nusser (2010). These authors argued, from the condition they derived, that AGN cannot supply enough momentum in radiation to unbind gas out of halos of galaxies. They theoretically estimated the total gas mass within a dark matter halo assuming a gas to total mass fraction of 10%. In this work, we measure the molecular gas mass to the stellar mass fraction, , in the disks of our galaxies (or very close to the vicinities of the galaxies). Our estimated condition is local, while Silk & Nusser (2010) were interested if the AGN-driven winds eventually escape from the halos of galaxies. We recast their derivation in terms of molecular gas fraction to show that AGN may only impart sufficient momentum to clear galactic disks once the molecular gas fraction is below about , perhaps explaining the delayed AGN molecular gas destruction hinted in this work, and the minor role of AGN in quenching starbursts (e.g., Wild et al., 2010; Yesuf et al., 2014). Note that starbursts have molecular gas fractions of 20–30% while normal star-forming galaxies have gas fractions of about 10%.
Let us assume an isothermal sphere galaxy. Within a halo radius , its total mass is M, where G is Newton’s gravitational constant and is the velocity dispersion.
The total gas fraction, , in terms of the molecular hydrogen gas fraction is :
| (1) |
If is the ratio between stellar mass and the total (halo) mass of the galaxy, , then :
| (2) |
Assuming the AGN luminosity, , is a fraction of the Eddington luminosity, , where is the Eddington ratio and the Eddington luminosity is . If the the radiation pressure force balances and gravitational force (Murray et al., 2005),
| (3) |
| (4) |
which has similar scaling as the observed relation.
The total energy radiated by the black hole, , while driving the gas at radius near the vicinity of the host galaxy by the radiation pressure is , where is the escape speed at the radius . For an isothermal sphere truncated at , . The work done by radiation pressure in moving the gas from to must be greater than the kinetic energy required for the gas to the escape, . Thus,
| (5) |
| (6) |
The accretion energy of the black hole must also satisfy :
Dividing both sides by leads to the condition
Using the observed ratio (e.g., Kormendy, 2013), , , km s-1, (Saintonge et al., 2011) and gives,
| (7) |
The above assumed values are reasonable for post-starburst galaxies. Similar assumption of is also made by Rupke et al. (2002) in studying galactic winds in local ultraluminous infrared galaxies (ULIRGs). The gas measurements are made within kpc of our galaxies while their dark matter halos may extend to few 100 kpc. may range between 10 and 100. Adopting instead will only change our limit by a factor of 1.3. Only few percent of the AGN luminosity is expected to coupled to the gas. Therefore, the above lower limit is very liberal estimate since it assumes 100% feedback efficiency. 5% feedback efficiency is often used in AGN feedback models (e.g., Scannapieco & Oh, 2004; Di Matteo et al., 2005; Zubovas & King, 2012). Therefore, our estimate implies that that AGN feedback may only be effective in late-stage post-starbursts after the molecular gas fraction is below .
The rest of the paper is organized as follows: section 2 presents the sample selection. Section 3 presents overview of statistical methods used in the paper. Section 4 presents the main results. Section 5 discusses our sample in comparison with other samples of PSBs. Section 6 summarizes the main findings of this work. Section 7 provides ancillary information on how our sample relates to existing samples of PSBs with molecular gas measurements. We assume cosmology.
2 Sample Selection & Observations
2.1 Sample selection
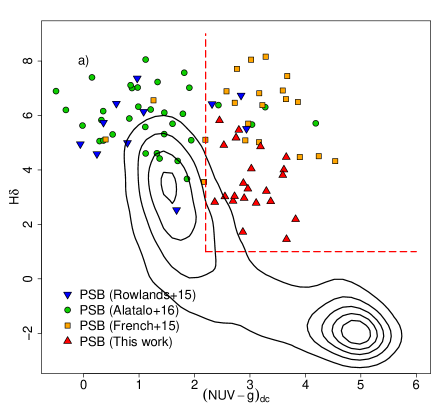
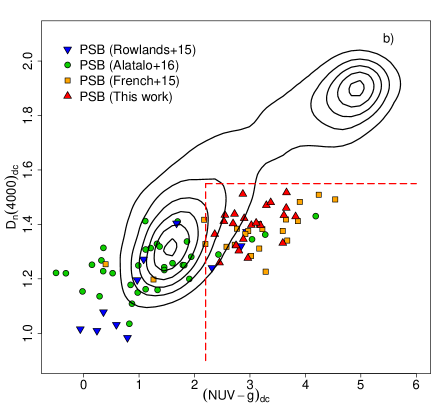
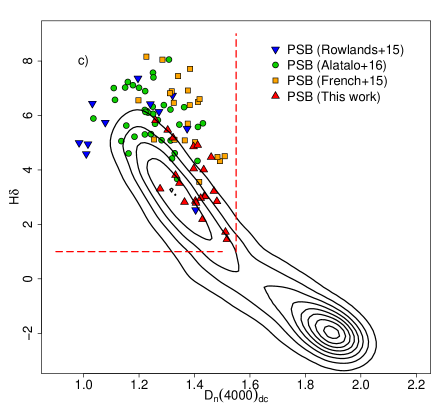
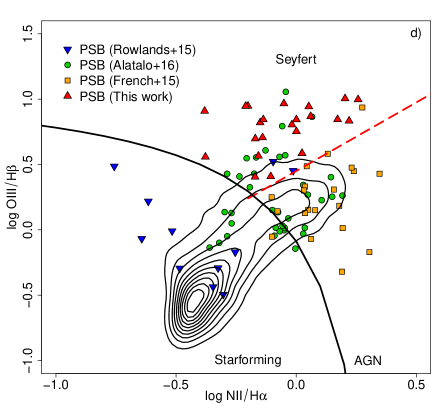
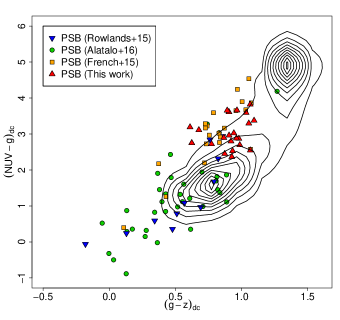
Using the cross-matched catalog of SDSS, GALEX and WISE (Martin et al., 2005; Wright et al., 2010; Aihara et al., 2011; Yesuf et al., 2014), we select a sample of 22 transition post-starburst Seyfert galaxy candidates based on the evolutionary path that starbursts and post-starbursts follow in the dust-corrected NUV-g color, H absorption equivalent width and the 4000Å break (Yesuf et al., 2014), and based on the BPT line ratio AGN diagnostic (Baldwin et al., 1981; Kewley et al., 2001; Kauffmann et al., 2003), as shown in Figure 1. probes the average temperature of the stars responsible for the continuum emission and is a good indicator of the mean stellar age (Bruzual A., 1983; Balogh et al., 1999). The combination NUV-g color with H and is useful in identifying late stage post-starburst galaxies, which are outliers at intermediate age from loci of galaxies with regular (continuous) star formation histories. As discussed in Yesuf et al. (2014), we acquired the measurements for physical parameters such as stellar masses and spectral indices from the publicly available catalogs on SDSS website 111https://www.sdss3.org/dr8/spectro/galspec.php (Aihara et al., 2011). Our sample is restricted to galaxies with redshift, , stellar mass, M M⊙, (NUV-g) and and HÅ. The subscript “dc" denotes dust-correction. We use the H/H flux ratio with two-component dust attenuation model of Charlot & Fall (2000) to correct for dust attenuation of the nebular emission lines, and the empirical relationship between the emission line and continuum optical depths found in Wild et al. (2011) to correct the continuum fluxes (for more details, see Yesuf et al., 2014). Two candidate PSB galaxies with CO observations are removed from the main analyses because they do not satisfy the above cuts. TPSB12 is removed because it has HÅ while TPSB13 is removed because it has (NUV-g) and it is also an ongoing merger. Including these two PSBs instead does not change the main conclusions. Furthermore, note that in Figure 1 we only show galaxies with NUV detections (Yesuf et al., 2014) in previous samples of PSBs (French et al., 2015; Rowlands et al., 2015; Alatalo et al., 2016). In later analyses, this restriction is not required.
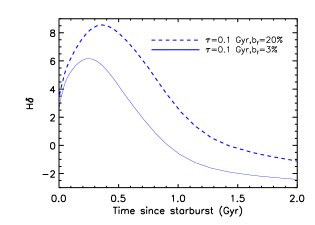
The redshift cut, , was imposed due to the sensitivity of the SMT to achieve the desired signal-to-noise ratio in 6–8 hours. This severely limited the number of Seyferts available for the observation. In addition, in the second year of the observation, the sample was restricted to be above a declination of 35∘(away from the sun avoidance zone for the SMT and the bulge of the Galaxy), further limiting the observable sample. Therefore, we did not impose the H 4 Å absorption cut that was done in the original sample selection of Yesuf et al. (2014). Most (19/22) of the galaxies in our sample have, within the measurement errors, H absorptions Å, which is expected in post-starbursts with weak or strong bursts or rapidly truncated star-forming galaxies (e.g., Poggianti et al., 1999). Our sample on average has lower H than do the aforementioned previous samples. Our PSBs are consistent with being later stage PSBs or PSBs with weaker starbursts compared to most of the PSBs in the other samples considered here. Note that the H equivalent width is Å at 1 Gyr after a starburst with star-formation timescale Gyr and burst mass fraction 20%. For starburst with Gyr and 3%, H at 1 Gyr (see Figure 9 in the Appendix). Thus, not imposing H 4Å cut helps select old PSBs. However, it remains uncertain whether these galaxies underwent weak or strong starbursts or rapidly truncated star-formation.
It should be noted that at , the SDSS fiber covers only kpc of the central region of a galaxy, and the spectroscopic measurements may not reflect the galaxy-wide values. On the other hand, the NUV-g color is an integrated galaxy-wide quantity. By combining the spectroscopic measurements with NUV-g color , we select only (PSB) galaxies that are fading galaxy-wide.
2.2 SMT CO observations
The observations were carried out using the ARO Submillimeter Telescope (SMT) on Mount Graham, Arizona. The observing runs were in February 25 – March 10, 2015 and in March 4 – 25, 2016. We follow the same instrument set up and observing strategy as French et al. (2015). Namely, we used the 1 mm ALMA Band 6 dual polarization sideband separating SIS (superconductor-insulator-superconductor) receiver and 1 mHz filterbank to measure the CO (2–1) 230.5 GHz emission line. The beam size of the SMT for this line is about 33′′. Beam switching was done with the secondary at 2.5 Hz switching rate and a throw of 120′′, in the BSP (beam switching plus position switching) mode. Calibration using a hot load and the standard chopper wheel method was performed every 6 minutes. Calibration using a cold load was performed at every tuning. The observing times range between 4 – 9 hours. French et al. (2015) observed a subset of 13 PSBs using both SMT and IRAM, which we use to guide comparisons between SMT- and IRAM- observed samples.
The data reduction is done using CLASS, a program within the GILDAS software package222http://www.iram.fr/IRAMFR/GILDAS/. The main beam efficiency is calculated using Jupiter in each polarization. A first-order polynomial baseline is subtracted from the spectra using data between [-600, 600] km s-1, excluding the central regions of [-300, 300] km s-1. The spectra are scaled using the main beam efficiency, and are coadded by weighting with the root-mean square (RMS) noise. The spectra are rebinned to 14 km s-1 velocity bins. The typical RMS error per bin is 1–2 mK. Thus, we achieve similar sensitivity as previous works (Saintonge et al., 2011; French et al., 2015; Rowlands et al., 2015; Alatalo et al., 2016).
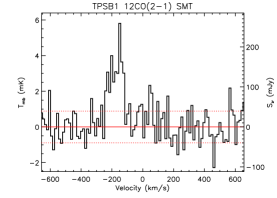
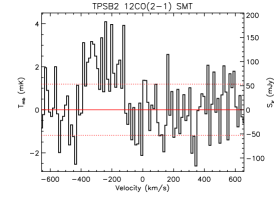
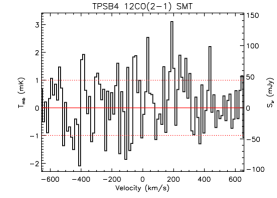
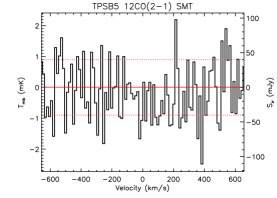
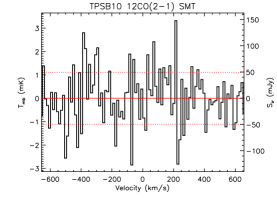
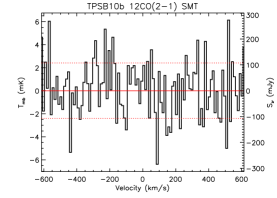
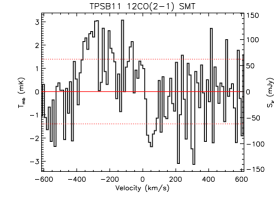
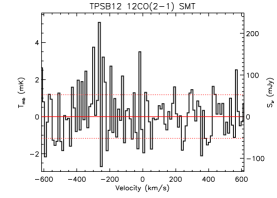
To calculate the integrated CO line intensity, , we fit a Gaussian profile to each line, allowing the peak velocity to differ from the optical systemic velocity by up to 200 km s-1. The statistical uncertainty in the line intensity is calculated following Young et al. (2011) as , where is the channel velocity width, is the channel RMS noise, is the number of channels used to integrate over the line, and is the number of channels used to fit the baseline. When the line is not detected, the upper limits of the line intensity is calculated as three times the statistical uncertainty. Following Solomon et al. (1997), the CO line luminosity in K km s-1 pc2 is where is the solid angle of the source convolved with the beam, is the redshift from the SDSS optical spectrum, and is the luminosity distance in Mpc. If the source is much smaller than the beam, then . We do not know the CO emitting sizes of our galaxies. We adopt this approximation as a simplifying assumption. We do not expect this to affect our conclusion. Previous works also adopt the same approximation. The fact that SMT has larger beam-size than IRAM, and CO (2–1) is known to be more centrally concentrated than CO (1–0), make the effect of this approximation less significant in this work compared to previous works. French et al. (2015) estimated for their sample that the may be underestimated by about because of this effect.
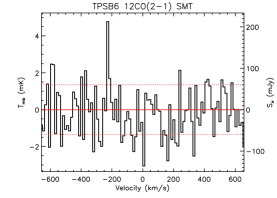
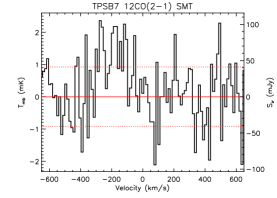
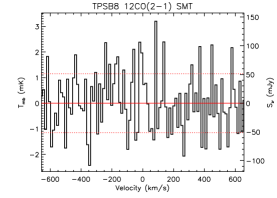
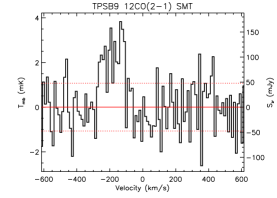
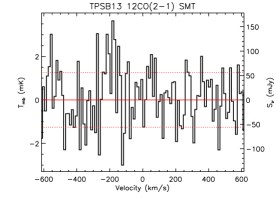
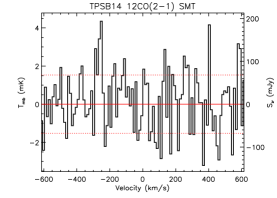
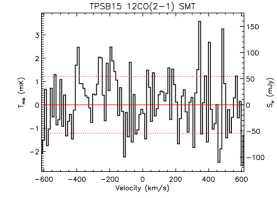
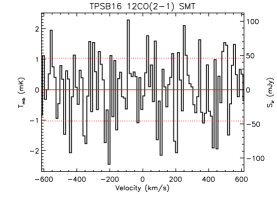
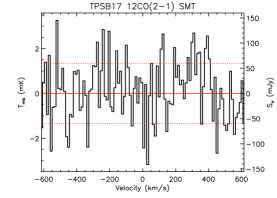
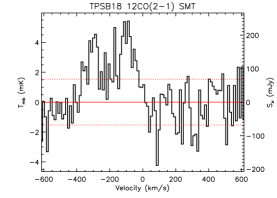
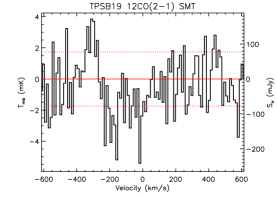
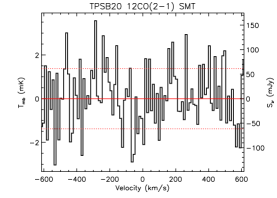
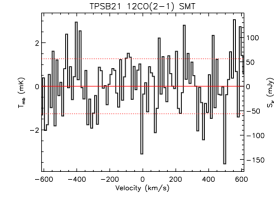
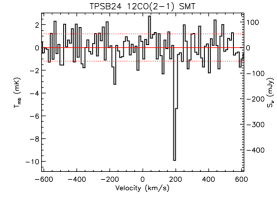
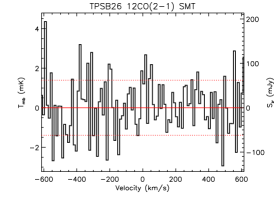
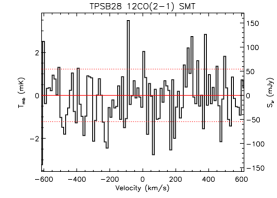
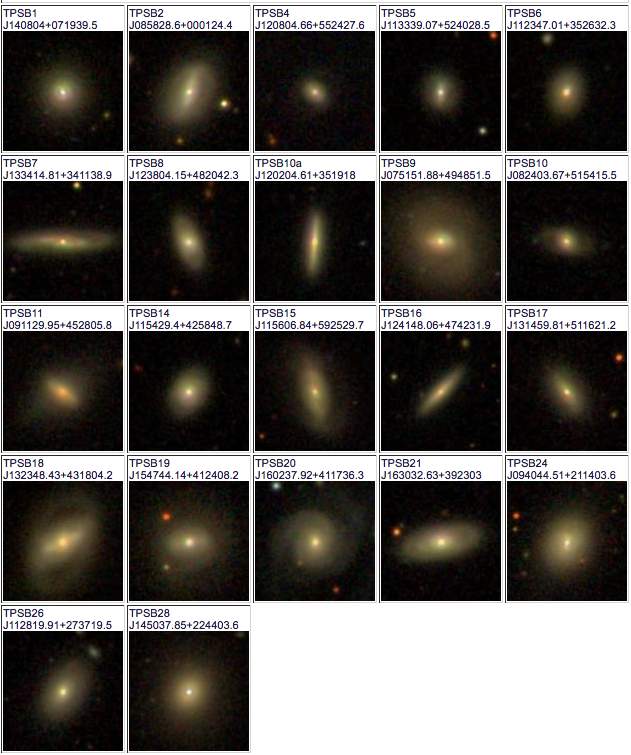
The molecular gas mass can be calculated from by assuming a CO conversion factor (mass-to-light ratio) , M(H. We assume an in Milky Way disk (Bolatto et al., 2013) and . As discussed in section 5.3, choosing a lower value of strengthens our main conclusion. The ratio is uncertain (Leroy et al., 2013; Sandstrom et al., 2013). Leroy et al. (2013) found in nearby disk galaxies. We adopt the Galactic value throughout the paper unless explicitly stated and all previous measurements are adjusted to our assumed value of . The observation are summarized in Table 1, the co-added spectra are given in Figure 2 & 3 and the SDSS cutout images of the Seyfert PSBs are shown in Figure 4.
| Target | RA | Dec. | (NUV-g)dc | H | log f12/f4.6 | log M⋆/M⊙ | log M/M⊙ | log M/M⋆ | ||
|---|---|---|---|---|---|---|---|---|---|---|
| TPSB1 | 212.01668 | 7.32762 | 0.0238 | 1.26 | 2.5 | 5.8 | 0.62 | 10.04 | 8.79 | |
| TPSB2 | 134.61915 | 0.02347 | 0.0285 | 1.32 | 2.8 | 5.2 | 0.59 | 10.40 | 8.64 | |
| TPSB4 | 182.01943 | 55.40766 | 0.0513 | 1.40 | 3.0 | 4.0 | 0.66 | 10.30 | ||
| TPSB5 | 173.41286 | 52.67458 | 0.0490 | 1.40 | 3.2 | 4.9 | 0.22 | 10.19 | ||
| TPSB6 | 170.94591 | 35.44231 | 0.0341 | 1.42 | 2.5 | 4.9 | 0.52 | 10.29 | ||
| TPSB7 | 203.56173 | 34.19415 | 0.0236 | 1.31 | 2.8 | 5.5 | 0.44 | 10.15 | 8.62 | |
| TPSB8 | 189.51736 | 48.34506 | 0.0306 | 1.44 | 3.6 | 4.0 | 0.04 | 10.21 | ||
| TPSB9 | 180.51923 | 35.32168 | 0.0341 | 1.48 | 3.7 | 4.5 | 0.31 | 10.54 | ||
| TPSB10 | 117.96618 | 49.81432 | 0.0244 | 1.40 | 2.7 | 2.9 | 0.41 | 10.45 | 9.29 | |
| TPSB10b | 126.01534 | 51.90432 | 0.0315 | 1.36 | 2.4 | 2.8 | 0.72 | 10.12 | ||
| TPSB11 | 137.87485 | 45.46828 | 0.0268 | 1.43 | 2.6 | 3.0 | 0.64 | 10.70 | ||
| TPSB12 | 139.49938 | 50.00218 | 0.0342 | 1.41 | 3.1 | 0.8 | 0.53 | 10.33 | ||
| TPSB13 | 173.16774 | 52.95040 | 0.0266 | 1.50 | 1.8 | 2.4 | 0.48 | 10.54 | ||
| TPSB14 | 178.62255 | 42.98021 | 0.0235 | 1.51 | 2.9 | 1.7 | 0.57 | 10.05 | ||
| TPSB15 | 179.02851 | 59.42492 | 0.0320 | 1.52 | 3.7 | 1.5 | 0.41 | 10.49 | ||
| TPSB16 | 190.45029 | 47.70888 | 0.0308 | 1.48 | 3.3 | 3.2 | 0.45 | 10.25 | ||
| TPSB17 | 198.74928 | 51.27259 | 0.0249 | 1.48 | 3.4 | 2.8 | 0.34 | 10.02 | ||
| TPSB18 | 200.95187 | 43.30118 | 0.0273 | 1.28 | 3.0 | 3.3 | 0.74 | 10.68 | 9.21 | |
| TPSB19 | 236.93394 | 41.40230 | 0.0327 | 1.35 | 2.9 | 3.5 | 0.69 | 10.47 | ||
| TPSB20 | 240.65806 | 41.29344 | 0.0348 | 1.45 | 2.7 | 3.0 | 0.08 | 10.59 | ||
| TPSB21 | 247.63604 | 39.38420 | 0.0305 | 1.42 | 2.9 | 3.0 | 0.55 | 10.54 | ||
| TPSB24 | 145.18542 | 21.23427 | 0.0244 | 1.43 | 3.8 | 2.2 | 0.71 | 10.33 | ||
| TPSB26 | 172.08298 | 27.62209 | 0.0321 | 1.42 | 3.1 | 2.8 | 0.18 | 10.31 | ||
| TPSB28 | 222.65772 | 22.73433 | 0.0210 | 1.33 | 3.6 | 3.8 | 0.60 | 10.09 |
-
•
For the non-detections, the given molecular masses are 3 upper limits.
3 Overview of Statistical Methods
In this section, we briefly review the statistical methods and tests used in the next section. Readers interested in more details of the methods should refer to the references provided.
In this section, we are concerned with how to analyze data that include both CO detections and CO upper limits, and make inference that is consistent with the incomplete information at hand. In statistics, a data set is called censored when the value of a measurement is only partially known to be above or below a threshold. Survival analysis is an area of statistics that mostly deals with modeling censored data such as time to an event (e.g., Klein & Moeschberger, 2005; Feigelson & Nelson, 1985; Halsel, 2012). We use existing survival analysis methods to properly extract information from our censored CO observations.
Let T denote a positive random variable representing time to an event of interest, say death. The survival function is the probability that an individual survives beyond time t, , where is the cumulative distribution function (CDF). The Kaplan-Meier estimator (Kaplan & Meier, 1958) is a non-parametric maximum likelihood estimator of the survival function, even in the presence of censoring. A non-parametric method does not require an assumption that the data follow a specific probability distribution. Instead, the data are ranked from smallest to largest, providing information on the relative positions of each observation. In the case of ties, Kaplan-Meier method assigns the smallest rank to each observation. The censored observations are also used in calculating the ranks. Let there be a set of data points and of these let be ranked, distinct uncensored values. At each time point , we observe , the number of deaths, , the number of censored observations between the time and and, , the number of individuals at risk just prior to the time . In other words, is the total sample size minus those who are censored or have died before , . The Kaplan-Meier estimator has a form : . It is a step function with jumps at times .
To compute the empirical cumulative distribution function (ECDF), using the Kaplan-Meier method, we use the NADA package in R programing language (Halsel, 2012; Lee & Lee, 2015). We use the function cenfit in the NADA package to compute the Kaplan-Meier estimator for the CO data (Halsel, 2012; Lee & Lee, 2015).
The survival curves or ECDF of two groups can be compared using the log-rank test, which tests the null hypothesis that two groups have the same distribution against the alternative hypothesis that two groups have different distributions (Mantel, 1966; Cox, 1972; Harrington & Fleming, 1982; Martinez, 2007). If the data are uncensored, the log-rank test gives similar result to the Mann-Whitney test. We use the routine cendiff in the NADA package to do the the log-rank test.
The Kendall’s is a non-parametric correlation coefficient that can be used for testing trends in both censored and uncensored data (e.g., Halsel, 2012). ranges between -1 and 1. is no correlation, is a perfect correlation, and is a perfect anti-correlation.
In the uncensored case, the slope a linear regression can be estimated using the Theil-Sen slope (Sen, 1968), which is the median of all pairwise slopes between two data points. This slope results in the Kendall’s of 0 for the correlation between the residuals and the covariate, X. For censored data, the slope can be estimated using the extended version called Akritas - Theil - Sen estimator (Akritas et al., 1995). The intercept of the linear regression is the median of the residual. We use the cenken routine in NADA package to compute the Kendall’s correlation coefficient and fit the ATS regression line to our censored CO data (Halsel, 2012; Lee & Lee, 2015).
4 Results
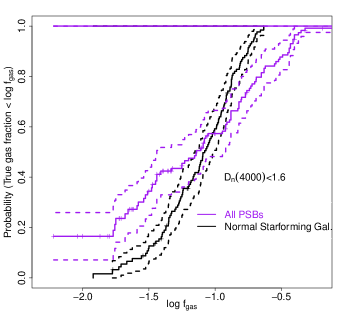
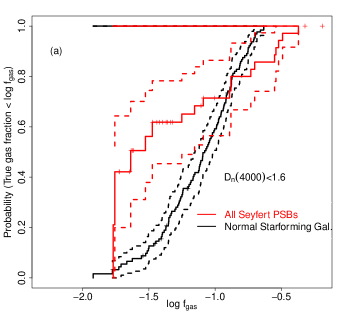
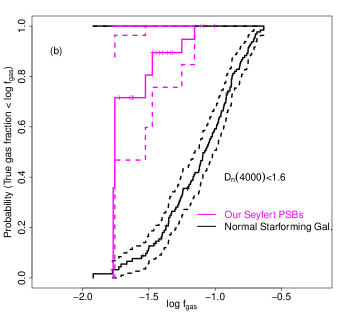
Figure 5 compares the empirical cumulative distribution functions (ECDF) of of normal star-forming galaxies () with that of PSBs while Figure 6 compares the ECDF of the star-forming galaxies with Seyfert PSBs. The vertical probability axis in both plots tracks the estimated Kaplan-Meier percentiles of galaxies with gas fraction less than a given threshold (Kaplan & Meier, 1958; Halsel, 2012). The curves for the PSBs and non-PSBs are similar at high gas fractions but are different at lower gas fractions. The log-rank test indicates that ECDF of all PSBs or Seyfert only PSBs are significantly different from that of the young non-PSBs. When the ECDF for Seyfert PSBs is compared to that of the young non-PSBs, the test gives a of 24 on one degrees of freedom corresponding to a -value of . Therefore, the null-hypothesis that the EDCFs for these two populations are the same can be rejected at a significance level. Similarly, the test gives a of 11.4 on one degrees of freedom, corresponding to a -value of , when EDCFs of all PSBs and non-PSBs with are compared.
Having established that there is a statistically significant difference between the gas fraction of young star-forming non-PSB galaxies and of PSBs in general, and of Seyfert PSBs in particular, in the rest of this section we explore in more detail where these trends come from. We first demonstrate that the WISE flux ratio between m and m is an excellent proxy for using the COLD GASS sample of non-PSBs (Saintonge et al., 2011) and then use it as a tool to constrain the gas fraction evolution in PSBs. Stellar populations younger than 0.6 Gyr dominate the m emission and, this ratio is known to correlate well with the specific star formation rate (sSFR, Donoso et al., 2012). The AGN hot dust emission is mostly between m, some have suggested that this ratio is not appreciably affected by AGN emission and that it can trace the sSFR in AGN (Donley et al., 2012; Donoso et al., 2012). Yesuf et al. (2014) have shown that starbursts and post-starbursts form a time sequence in this ratio, with starbursts having the highest ratios and quiescent PSBs having ratios similar to those of green-valley and red-sequence galaxies.

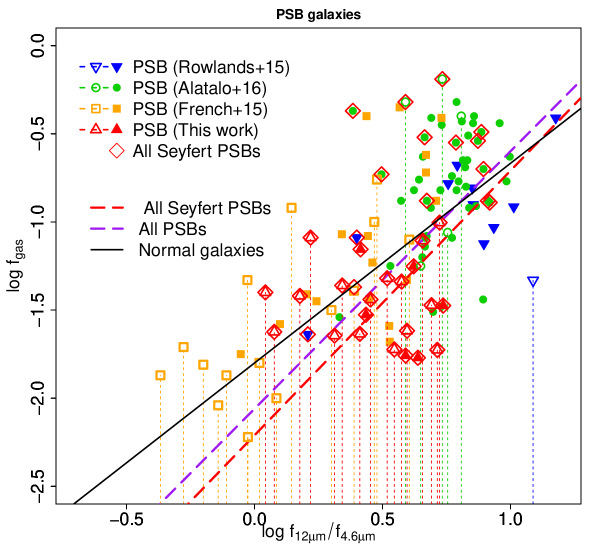
Figure 7 shows the WISE flux ratio versus for all normal galaxies in the COLD GASS survey. As shown in the Appendix Figure 11, the general population of SDSS galaxies show bimodal distribution that correlates with . Star-forming galaxies have ratios between 0.2 – 1 while quiescent galaxies have ratios between -0.8 – 0.0. A tight correlation is observed between and in the COLD GASS sample, indicating an evolutionary process in normal galaxies in which sSFR declines as gas is used up. The slope of the best fit line is and its intercept is . The Kendall’s correlation coefficient for the fit is 0.64. The statistical significance of the correlation is more than 5. One can easily show that and are related to the logarithm of the molecular gas depletion time at a given sSFR by the relation: , where , , where and define the relation: (. Donoso et al. (2012) computed the relation between sSFR and 4.6 - 12m color in Vega magnitude and 0.769 is subtracted to change the color to AB magnitude. They found and for the SDSS star-forming galaxies. Using these values with our fitted values of and gives and . In comparison, Huang & Kauffmann (2014) found and for the COLD GASS sample. The authors used the GALEX FUV and WISE 22m to estimate the sSFR. Our inferred depletion times are consistent with Huang & Kauffmann (2014) but there is likely a systematic offset in the two SFR estimates.
Figure 8 shows the relationship between the WISE flux ratio and for PSBs. They also show statistically significant () correlation between these two quantities. The slope of the best fit line is and its intercept is -2.1. Collectively, the broad overall trend, suggests same correlation is at work: lower molecular gas fractions means lower sSFR or dust-heating. But the scatter is much larger, and looking in detail we can see that certain sub-populations of PSBs statistically differ. A major insight from this figure is that the sSFR histories of the PSBs and of Seyferts PSBs may not be as simple or well-behaved as normal galaxies. Hence, the use of standard age indicators may lead to different results depending on indicator used. This topic will be explored in future papers. The reason for the low of Seyferts in Figure 6 is consistent with low sSFR upper limits inferred from .
Table 2 summarizes the distribution of molecular gas fraction of our sample and of the previous samples of PSBs. Our sample has a distribution with mean of 0.025 and dispersion 0.018. 95% of our PSBs have gas fractions below 0.07 while 50% have gas fractions below 0.02. The previous samples have means and dispersions of . It is particularly interesting that the French et al. (2015) sample, which may also contains late stage PSBs, has distribution with mean of 0.08 and dispersion 0.12. The majority of PSBs from Rowlands et al. (2015) and Alatalo et al. (2016) samples have both high and high molecular gas fractions in comparison to our sample. The PSBs in these two works may be precursors to the PSBs in our sample or to those in the French et al. (2015) sample.
5 Discussion
In this section, we discuss in detail how gas fractions in our sample compare with those observed in previous samples of PSBs. We will also discuss the general implication of our result and the uncertainty in the hitherto assumed CO conversion factor.
5.1 Comparison of our sample with the previous samples of PSBs
We study the molecular gas evolution of 116 post-starburst galaxies, of which 22 have new observations undertaken by us while the rest are compiled from the literature (Rowlands et al., 2015; French et al., 2015; Alatalo et al., 2016). The galaxies in the new sample are selected using their spectral indices and NUV-g colors, to identify them as green valley PSBs, and their emission line ratios, to identify them as Seyferts. Our sample represents about two-thirds of the Seyferts PSBs in the combined sample. The Seyfert PSBs from the previous works were serendipitously selected and are mostly in the blue-cloud. We show that distribution of the Seyfert PSBs and of PSBs in general are significantly different from that of normal star-forming galaxies. The molecular gas fraction in the Seyfert PSBs decreases with the WISE ratios . If there is an evolutionary sequence in Figure 8, from upper right to lower left, it would be plausible to conclude that our new Seyferts are fairly aged galaxies located nearing the middle of the gas-exhaustion cycle. This conclusion would be consistent with our selection of these galaxies based on integrated UV color as members of the green valley and well on their way to gas exhaustion. The systematically lower gas content of the new Seyferts relative to the PSBs in Figure 8 might then be interpreted as the action of late AGNs in them in finally clearing out the gas.
However, we call attention to an important puzzle: In Figure 8 the French et al. (2015) sample as a whole shows a significant correlation between and ; the PSBs with high have high gas fractions. This is puzzling because the French et al. (2015) galaxies were selected to have very low H, which is the gold-standard for star-formation rate. Thus, the and H as SFR indicators disagree for the subset of the French et al. (2015) sample with high . However, A-star heating is significant during the post-starburst phase, which can artificially boost IR-based SFR indicators (Utomo et al., 2014; Hayward et al., 2014). An analysis of multiple SFR indicators, including extinction-free 1.4 GHz measurements in §2.5 of French et al. (2015) shows these galaxies are unlikely to have significant dust obscuration. Analyses of the near and far IR properties of this sample are the subject of a forthcoming study (Smercina et al. in prep).
| Study | Mean | Std deviation | 5% | 25% | 50% | 75% | 95% |
|---|---|---|---|---|---|---|---|
| This work (Seyfert) | 0.025 | 0.018 | - | 0.017 | 0.017 | 0.030 | 0.070 |
| French el al (2015) | 0.081 | 0.122 | - | - | 0.026 | 0.083 | 0.398 |
| Alatalo et al. (2016) | 0.216 | 0.214 | 0.031 | 0.083 | 0.170 | 0.288 | 0.426 |
| Rowlands et al. (2016) | 0.133 | 0.103 | 0.023 | 0.075 | 0.122 | 0.165 | - |
| Seyferts in all works | 0.088 | 0.116 | 0.017 | 0.017 | 0.023 | 0.132 | 0.324 |
| PSBs in all works | 0.133 | 0.176 | - | 0.021 | 0.075 | 0.182 | 0.398 |
-
•
The summary statistics in the table are estimated using the Kaplan-Meier method and therefore take into account the CO non-detections. The percentiles show the probability that the gas fraction of a sample is below the given value. Our late stage Seyfert sample has a distribution of gas fraction with the lowest mean and standard deviation compared to other samples (French et al., 2015; Rowlands et al., 2015; Alatalo et al., 2016). The French et al. (2015) sample, which may also be late stage PSBs, has a wider range of gas fraction distribution.
The episodic lifetime of an individual AGN event is currently not well-constrained and it may range between times the effective AGN lifetime (Hopkins & Hernquist, 2009). The effective AGN lifetime for the Seyfert PSBs is likely to be Gyr. This estimate uses the median km s-1 to estimate the median black hole mass, M⊙, from the M relation (Kormendy, 2013), the median dust-corrected O iii luminosity, L⊙, to estimate the Eddington ratio, , (Lamastra et al., 2009), and Figure 9 of Hopkins & Hernquist (2009) to estimate the effective AGN lifetime from MBH & . The effective AGN lifetime for the Seyfert PSBs is longer than the quenched PSB lifetime of Gyr, which suggests that, given the above estimate of the episodic lifetime, the quenched PSBs may experience second episode of AGN activity or no AGN activity at all within their typical lifetime. Perhaps the variation in AGN activity timescale is linked to wide range in gas fraction observed in the French et al. (2015) sample, if these PSBs are truly quiescent galaxies, and AGN are linked to the removal of gas in the French et al. (2015) galaxies with low and in our sample.
We used the ratio as a crude first-order indicator of star formation activity in both AGN and non-AGN galaxies. Some variation is expected between the ratios of the two classes (Donoso et al., 2012). It is not clear if these variations are due to additional AGN dust heating or preferentially aged stellar populations in AGN host galaxies. Understanding the details of this variation is not important for conclusions of the current work, but future studies of the effect of AGN contamination on will be useful.
Furthermore, it should be noted that the gas fractions in very nearby early type galaxies are found to be (e.g., Young et al., 2011). Many of the PSBs considered here have molecular gas fractions already consistent with detections in these early type galaxies. A full comparison with early-type galaxies is complicated by the lower redshifts and smaller physical apertures of the Young et al. (2011, ATLAS 3D) sample. Deeper observations of the non-detected PSBs will be necessary to study the full range in their molecular gas properties, and to compare to the deep observations of the ATLAS 3D sample of early-type galaxies.
5.2 Implication for galaxy evolution
It is thought that star formation quenching happens in both slow and fast modes (e.g., Faber et al., 2007; Cheung et al., 2012; Barro et al., 2013; Fang et al., 2012; Dekel & Burkert, 2014; Schawinski et al., 2014; Yesuf et al., 2014; Woo et al., 2015). The existence of these modes, their relative importance and the physical mechanisms that drive them are still open questions in galaxy evolution. Some works have indicated that PSBs quench rapidly and may exemplify an important mode quenching for the build-up of the red sequence (Kaviraj et al., 2007; Wild et al., 2009; Wong et al., 2012; Yesuf et al., 2014; Wild et al., 2016), while others have questioned their importance (De Lucia et al., 2009; Dressler et al., 2013).
Recent studies found large gas fractions in PSBs complicating the picture of their rapid evolution to the red sequence (Rowlands et al., 2015; French et al., 2015; Alatalo et al., 2016). However, these works have been biased against finding PSBs with Seyfert-like emission lines in the UV-optical green valley. In this work, we have observed the molecular gas properties of 22 such galaxies. The combined data presented in this work cannot rule out AGN feedback, and as a whole are consistent with a removal or destruction of molecular gas at later stages by AGN feedback or no AGN feedback at all if different subsamples of PSBs are not evolutionary connected. Better and deeper observations, especially at a later stage of PSB evolution, are needed to firmly and more directly test the merger-induced AGN feedback hypothesis. In the theoretical front, developments in cosmological simulations with AGN feedback are needed to be compared to these future observations.
5.3 The effect of CO conversion factor
The CO luminosity to the molecular hydrogen conversion factor is a widely acknowledged source of uncertainty in studies that use CO as a tracer of molecular hydrogen (Bolatto et al., 2013). Up to this point, we have assumed that all objects including PSBs have a conversion factor similar to the factor observed in the Milky Way disk. There is no study to date that measured the conversion factor in PSBs. As discussed in detail in Bolatto et al. (2013), departure from the Galactic conversion factor are both observed and expected in starburst galaxies. It has been shown that adopting the Galactic conversion factor would cause the inferred molecular gas mass to exceed the dynamical mass for the central region of a starburst galaxy (Solomon et al., 1997; Downes & Solomon, 1998). Using galaxy merger hydrodynamic simulations, which incorporate dust and molecular line radiative transfer calculations, Narayanan et al. (2011) have shown that in merger-induced starbursts, the combined effect of increased velocity dispersion and kinetic temperature increases the velocity-integrated CO intensity, and lowers the CO conversion factor from the Galactic value by a factor of . The authors also note that in the PSB phase, it is less trivial to simply relate the conversion factor to the gas velocity dispersion and temperature owing to varying physical conditions in the PSB galaxy. Some of their merger simulations returned to a Galactic conversion factor value quickly after the peak of the starburst, while others remained low. Furthermore, if AGN heat the bulk of molecular gas, the conversion factor could be lower from the Galactic value in PSBs with AGN. Note that a lower CO conversion factor than the assumed Galactic value will lower the gas fractions observed in PSBs compared normal galaxies.
6 Summary & Conclusions
Using the SMT, we undertook new CO (2–1) observations of 22 green-valley Seyfert post-starburst candidate galaxies at redshift 0.02 – 0.06. The sample was selected using the dust-corrected NUV-g color, H absorption and 4000Å break to indicate a PSB signature, and the emission line ratios to indicate Seyfert activity. We analyzed our sample with previous samples of 94 PSBs. The combined sample probes a variety of stages in a possible evolutionary sequence, and spans a range of AGN properties. Our main results are:
-
•
We detect molecular gas in only 6 out of 22 Seyfert PSB galaxies we targeted. Using comparable sensitivity limits, this is consistent with the detection in PSB sample by French et al. (2015) using the SMT. However, taking into account our upper limits, the mean and the dispersion of the distribution of the gas fraction in our green-valley Seyfert PSBs () are much smaller than previous samples of Seyfert PSBs or PSBs in general (, French et al., 2015; Rowlands et al., 2015; Alatalo et al., 2016). This difference may partly be explained by the evolution of molecular gas fraction with post-starburst age if our sample probes the late stage of the evolution. However, PSBs in French et al. (2015) are also have similar green-valley colors but they show a wider range of gas fraction, despite their low star-formation rate inferred from their H emission. The comparison between these samples is complicated by the differing selections on H absorption, as weaker H is consistent with either a weaker starburst, or a later post-starburst age.
-
•
The distribution of gas fraction in PSBs is significantly different from young star-forming galaxies from COLD GASS survey (Saintonge et al., 2011). PSBs are more likely to have lower gas fraction. The Seyfert PSBs have a distribution of gas fraction which is even more significantly different from that of normal star-forming galaxies of similar .
-
•
The WISE flux ratio, , is an excellent proxy for gas fraction for both PSBs and non-PSBs. We find a statistically significant () relationship between and for both PSBs and normal star-forming galaxies.
Acknowledgements
We thank Xavier Prochaska and Ann Zabludoff for their useful comments and suggestions. H. Yesuf would like to acknowledge support by NSF grants AST-0808133 and and AST-1615730. KDF acknowledges support from NSF grant DGE-1143953, PEO, and the ARCS Phoenix Chapter and Burton Family.
The SMT is operated by the Arizona Radio Observatory (ARO), Steward Observatory, University of Arizona. We thank the operators and staff of the ARO.
Funding for the SDSS and SDSS-II has been provided by the Alfred P. Sloan Foundation, the Participating Institutions, the National Science Foundation, the U.S. Department of Energy, the National Aeronautics and Space Administration, the Japanese Monbukagakusho, the Max Planck Society, and the Higher Education Funding Council for England. The SDSS Web site is http://www.sdss.org/.
The SDSS is managed by the Astrophysical Research Consortium for the Participating Institutions. The Participating Institutions are the American Museum of Natural History, Astrophysical Institute Potsdam, University of Basel, University of Cambridge, Case Western Reserve University, University of Chicago, Drexel University, Fermilab, the Institute for Advanced Study, the Japan Participation Group, Johns Hopkins University, the Joint Institute for Nuclear Astrophysics, the Kavli Institute for Particle Astrophysics and Cosmology, the Korean Scientist Group, the Chinese Academy of Sciences (LAMOST), Los Alamos National Laboratory, the Max-Planck-Institute for Astronomy (MPIA), the Max-Planck-Institute for Astrophysics (MPA), New Mexico State University, Ohio State University, University of Pittsburgh, University of Portsmouth, Princeton University, the United States Naval Observatory, and the University of Washington.
References
- Aihara et al. (2011) Aihara H., et al., 2011, ApJS, 193, 29
- Akritas et al. (1995) Akritas M. G., Murphy S. A., LaValley M. P., 1995, Journal of the American Statistical Association, 90, 170
- Alatalo et al. (2011) Alatalo K., et al., 2011, ApJ, 735, 88
- Alatalo et al. (2014) Alatalo K., Cales S. L., Appleton P. N., Kewley L. J., Lacy M., Lisenfeld U., Nyland K., Rich J. A., 2014, ApJ, 794, L13
- Alatalo et al. (2016) Alatalo K., et al., 2016, ApJ, 827, 106
- Assef et al. (2013) Assef R. J., et al., 2013, ApJ, 772, 26
- Baldwin et al. (1981) Baldwin J. A., Phillips M. M., Terlevich R., 1981, PASP, 93, 5
- Balogh et al. (1999) Balogh M. L., Morris S. L., Yee H. K. C., Carlberg R. G., Ellingson E., 1999, ApJ, 527, 54
- Barnes & Hernquist (1991) Barnes J. E., Hernquist L. E., 1991, ApJ, 370, L65
- Barro et al. (2013) Barro G., et al., 2013, ApJ, 765, 104
- Bolatto et al. (2013) Bolatto A. D., Wolfire M., Leroy A. K., 2013, ARA&A, 51, 207
- Boselli et al. (2014) Boselli A., Cortese L., Boquien M., Boissier S., Catinella B., Lagos C., Saintonge A., 2014, A&A, 564, A66
- Bruzual & Charlot (2003) Bruzual G., Charlot S., 2003, MNRAS, 344, 1000
- Bruzual A. (1983) Bruzual A. G., 1983, ApJ, 273, 105
- Cen (2012) Cen R., 2012, ApJ, 755, 28
- Charlot & Fall (2000) Charlot S., Fall S. M., 2000, ApJ, 539, 718
- Cheung et al. (2012) Cheung E., et al., 2012, ApJ, 760, 131
- Cicone et al. (2014) Cicone C., et al., 2014, A&A, 562, A21
- Couch & Sharples (1987) Couch W. J., Sharples R. M., 1987, MNRAS, 229, 423
- Cox (1972) Cox D. R., 1972, JRSS, 34, 187
- Davis et al. (2014) Davis T. A., et al., 2014, MNRAS, 444, 3427
- De Lucia et al. (2009) De Lucia G., Poggianti B. M., Halliday C., Milvang-Jensen B., Noll S., Smail I., Zaritsky D., 2009, MNRAS, 400, 68
- Dekel & Burkert (2014) Dekel A., Burkert A., 2014, MNRAS, 438, 1870
- Di Matteo et al. (2005) Di Matteo T., Springel V., Hernquist L., 2005, Nature, 433, 604
- Donley et al. (2012) Donley J. L., et al., 2012, ApJ, 748, 142
- Donoso et al. (2012) Donoso E., et al., 2012, ApJ, 748, 80
- Downes & Solomon (1998) Downes D., Solomon P. M., 1998, ApJ, 507, 615
- Dressler & Gunn (1983) Dressler A., Gunn J. E., 1983, ApJ, 270, 7
- Dressler et al. (2013) Dressler A., Oemler Jr. A., Poggianti B. M., Gladders M. D., Abramson L., Vulcani B., 2013, ApJ, 770, 62
- Fabello et al. (2011) Fabello S., Kauffmann G., Catinella B., Giovanelli R., Haynes M. P., Heckman T. M., Schiminovich D., 2011, MNRAS, 416, 1739
- Faber et al. (2007) Faber S. M., et al., 2007, ApJ, 665, 265
- Fang et al. (2012) Fang J. J., Faber S. M., Salim S., Graves G. J., Rich R. M., 2012, ApJ, 761, 23
- Feigelson & Nelson (1985) Feigelson E. D., Nelson P. I., 1985, ApJ, 293, 192
- Feruglio et al. (2010) Feruglio C., Maiolino R., Piconcelli E., Menci N., Aussel H., Lamastra A., Fiore F., 2010, A&A, 518, L155
- Fischer et al. (2010) Fischer J., et al., 2010, A&A, 518, L41
- French et al. (2015) French K. D., Yang Y., Zabludoff A., Narayanan D., Shirley Y., Walter F., Smith J.-D., Tremonti C. A., 2015, ApJ, 801, 1
- García-Burillo et al. (2014) García-Burillo S., et al., 2014, A&A, 567, A125
- Geréb et al. (2015) Geréb K., Morganti R., Oosterloo T. A., Hoppmann L., Staveley-Smith L., 2015, A&A, 580, A43
- Gladders et al. (1998) Gladders M. D., López-Cruz O., Yee H. K. C., Kodama T., 1998, ApJ, 501, 571
- Halsel (2012) Halsel D., 2012, Statistics for Censored Environmental Data, 2 edn. Wiley
- Harrington & Fleming (1982) Harrington D. P., Fleming T. R., 1982, Biometrika, 69, 553
- Hayward et al. (2014) Hayward C. C., et al., 2014, MNRAS, 445, 1598
- Hopkins & Hernquist (2009) Hopkins P. F., Hernquist L., 2009, The Astrophysical Journal, 698, 1550
- Hopkins et al. (2006) Hopkins P. F., Hernquist L., Cox T. J., Di Matteo T., Robertson B., Springel V., 2006, ApJS, 163, 1
- Hopkins et al. (2008) Hopkins P. F., Hernquist L., Cox T. J., Kereš D., 2008, ApJS, 175, 356
- Huang & Kauffmann (2014) Huang M.-L., Kauffmann G., 2014, MNRAS, 443, 1329
- Kaplan & Meier (1958) Kaplan E. L., Meier P. M., 1958, JASA, 53
- Kauffmann et al. (2003) Kauffmann G., et al., 2003, MNRAS, 346, 1055
- Kaviraj et al. (2007) Kaviraj S., Kirkby L. A., Silk J., Sarzi M., 2007, MNRAS, 382, 960
- Kewley et al. (2001) Kewley L. J., Dopita M. A., Sutherland R. S., Heisler C. A., Trevena J., 2001, ApJ, 556, 121
- Klein & Moeschberger (2005) Klein J. P., Moeschberger M. L., 2005, Survival analysis: techniques for censored and truncated data. Springer Science & Business Media
- Kormendy (2013) Kormendy J., 2013, in Thomas D., Pasquali A., Ferreras I., eds, IAU Symposium Vol. 295, The Intriguing Life of Massive Galaxies. pp 241–256, doi:10.1017/S174392131300495X
- Lamastra et al. (2009) Lamastra A., Bianchi S., Matt G., Perola G. C., Barcons X., Carrera F. J., 2009, A&A, 504, 73
- Lee & Lee (2015) Lee L., Lee M. L., 2015, Package NADA
- Leroy et al. (2013) Leroy A. K., et al., 2013, AJ, 146, 19
- Mantel (1966) Mantel N., 1966, Cancer chemotherapy reports. Part 1, 50, 163
- Martin et al. (2005) Martin D. C., et al., 2005, ApJ, 619, L1
- Martinez (2007) Martinez R. L. M. C., 2007, Diagnostics for choosing between Log-rank and Wilcoxon tests. ProQuest
- Murray et al. (2005) Murray N., Quataert E., Thompson T. A., 2005, ApJ, 618, 569
- Narayanan et al. (2008) Narayanan D., et al., 2008, ApJS, 176, 331
- Narayanan et al. (2011) Narayanan D., Krumholz M., Ostriker E. C., Hernquist L., 2011, MNRAS, 418, 664
- Pawlik et al. (2016) Pawlik M. M., Wild V., Walcher C. J., Johansson P. H., Villforth C., Rowlands K., Mendez-Abreu J., Hewlett T., 2016, MNRAS, 456, 3032
- Poggianti et al. (1999) Poggianti B. M., Smail I., Dressler A., Couch W. J., Barger A. J., Butcher H., Ellis R. S., Oemler Jr. A., 1999, ApJ, 518, 576
- Rowlands et al. (2015) Rowlands K., Wild V., Nesvadba N., Sibthorpe B., Mortier A., Lehnert M., da Cunha E., 2015, MNRAS, 448, 258
- Rupke et al. (2002) Rupke D. S., Veilleux S., Sanders D. B., 2002, ApJ, 570, 588
- Saintonge et al. (2011) Saintonge A., et al., 2011, MNRAS, 415, 32
- Saintonge et al. (2012) Saintonge A., et al., 2012, ApJ, 758, 73
- Sanders et al. (1988) Sanders D. B., Soifer B. T., Elias J. H., Madore B. F., Matthews K., Neugebauer G., Scoville N. Z., 1988, ApJ, 325, 74
- Sandstrom et al. (2013) Sandstrom K. M., et al., 2013, ApJ, 777, 5
- Scannapieco & Oh (2004) Scannapieco E., Oh S. P., 2004, ApJ, 608, 62
- Schawinski et al. (2007) Schawinski K., Thomas D., Sarzi M., Maraston C., Kaviraj S., Joo S.-J., Yi S. K., Silk J., 2007, MNRAS, 382, 1415
- Schawinski et al. (2009) Schawinski K., et al., 2009, ApJ, 690, 1672
- Schawinski et al. (2014) Schawinski K., et al., 2014, MNRAS, 440, 889
- Sen (1968) Sen P. K., 1968, JASA, 63, 1379
- Silk & Nusser (2010) Silk J., Nusser A., 2010, ApJ, 725, 556
- Silk & Rees (1998) Silk J., Rees M. J., 1998, A&A, 331, L1
- Snyder et al. (2011) Snyder G. F., Cox T. J., Hayward C. C., Hernquist L., Jonsson P., 2011, ApJ, 741, 77
- Solomon et al. (1997) Solomon P. M., Downes D., Radford S. J. E., Barrett J. W., 1997, ApJ, 478, 144
- Spoon et al. (2013) Spoon H. W. W., et al., 2013, ApJ, 775, 127
- Springel et al. (2005) Springel V., Di Matteo T., Hernquist L., 2005, MNRAS, 361, 776
- Sturm et al. (2011) Sturm E., et al., 2011, ApJ, 733, L16
- Sun et al. (2014) Sun A.-L., Greene J. E., Zakamska N. L., Nesvadba N. P. H., 2014, ApJ, 790, 160
- Toomre & Toomre (1972) Toomre A., Toomre J., 1972, ApJ, 178, 623
- Utomo et al. (2014) Utomo D., Kriek M., Labbé I., Conroy C., Fumagalli M., 2014, ApJ, 783, L30
- Veilleux et al. (2013) Veilleux S., et al., 2013, ApJ, 776, 27
- Wild et al. (2009) Wild V., Walcher C. J., Johansson P. H., Tresse L., Charlot S., Pollo A., Le Fèvre O., de Ravel L., 2009, MNRAS, 395, 144
- Wild et al. (2010) Wild V., Heckman T., Charlot S., 2010, MNRAS, 405, 933
- Wild et al. (2011) Wild V., Charlot S., Brinchmann J., Heckman T., Vince O., Pacifici C., Chevallard J., 2011, MNRAS, 417, 1760
- Wild et al. (2016) Wild V., Almaini O., Dunlop J., Simpson C., Rowlands K., Bowler R., Maltby D., McLure R., 2016, MNRAS, 463, 832
- Wong et al. (2012) Wong O. I., et al., 2012, MNRAS, 420, 1684
- Woo et al. (2015) Woo J., Dekel A., Faber S. M., Koo D. C., 2015, MNRAS, 448, 237
- Wright et al. (2010) Wright E. L., et al., 2010, AJ, 140, 1868
- Yesuf et al. (2014) Yesuf H. M., Faber S. M., Trump J. R., Koo D. C., Fang J. J., Liu F. S., Wild V., Hayward C. C., 2014, ApJ, 792, 84
- Young et al. (2011) Young L. M., et al., 2011, MNRAS, 414, 940
- Zabludoff et al. (1996) Zabludoff A. I., Zaritsky D., Lin H., Tucker D., Hashimoto Y., Shectman S. A., Oemler A., Kirshner R. P., 1996, ApJ, 466, 104
- Zubovas & King (2012) Zubovas K., King A., 2012, ApJ, 745, L34
7 Appendix
This section presents materials that support the analysis in the main sections of the paper.
7.1 Evolution of H equivalent width after a starburst
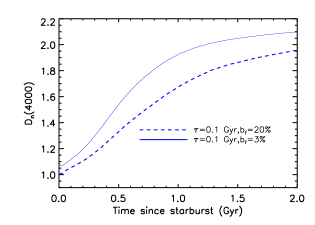
Figure 9 shows the evolution of H equivalent width for Bruzual & Charlot (2003) starburst models, with a star formation timescale, Gyr, and a burst mass fraction () or . As detailed in Yesuf et al. (2014). The H is dependent on the magnitude of the burst and there is generally a degeneracy between the burst mass fraction and the burst timescale. The figure, demonstrates with particular models above, that late stage PSBs can have HÅ, which is lower than the threshold often used to define PSBs.
7.2 A comparison of our PSB sample with previous samples
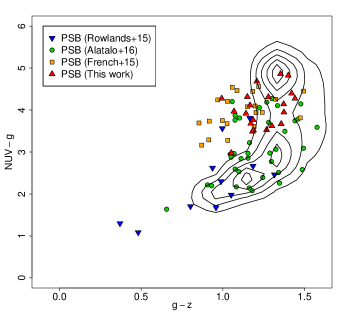
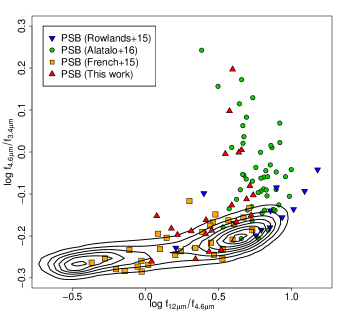
This section present additional figures that compare the stellar population of our Seyfert PSBs with previous samples of PSBs (French et al., 2015; Rowlands et al., 2015; Alatalo et al., 2016). Figure 10 shows the NUV-g versus g-z colors before and after the dust correction. Before the dust-correction, starforming galaxies form a diagonal track which stretches from blue to red colors. The red end of this track is inhabited by dusty galaxies. The quiescent galaxies form a separate concentration above the dusty starforming galaxies. The locations our Seyfert PSBs in the two color diagrams indicate that they are not dusty star-forming galaxies but are transitional galaxies in green valley. The dust-corrected diagram in addition shows that stellar ages of our PSBs and the PSBs in French et al. (2015) are comparable and the PSBs in Rowlands et al. (2015) and Alatalo et al. (2016) are younger than our sample. Figure 11 depicts versus (Wright et al., 2010). Stellar populations younger than 0.6 Gyr dominate the 12 m emission and is known to correlate well with sSFR (Donoso et al., 2012) and is sensitive to hot dust emission from AGN. Normal galaxies form a tight bi-modal sequence with some vertical scatter. Starforming galaxies are located at high , while quiescent galaxies are located at low .
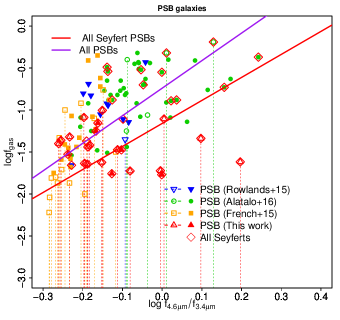
Figure 12 depicts the WISE flux ratio versus for PSBs. The criterion can identify hot dust emission from AGN albeit only with reliability (Assef et al., 2013). Anti-correlation between and may naively expected if AGN feedback destroys the molecular gas by heating it. Such trend is not seen in the data. There is instead somewhat significant () correlation between and for the BPT-identified Seyfert PSBs. The current data cannot rule out AGN feedback, and the observed trend is consistent with delayed AGN feedback, which is inefficient at earlier times when the molecular gas fraction is above %. Future study with large number of PSBs with may constrain this model better. It should be noted that correlation between and for all PSBs in the combined sample is highly significant (>) and it is likely tracing stellar dust heating process that declines with the starburst age.
7.3 CO luminosities of Seyfert PSBs
Table 3 presents the observed CO luminosities of our new Seyfert PSB sample or 3 upper limits in the case of no detections. Note that TPSB2 and TPSB23 are the same object, which is observed twice and we have combined the two observations in the analysis in presented in the main text of the paper.
| Target | RA | Dec. | L | FWHM |
|---|---|---|---|---|
| (degree) | (degree) | (107 K km s-1 pc2) | (km s | |
| TPSB1 | 212.01667 | 7.3276444 | ||
| TPSB2 | 134.61917 | 0.02346944 | ||
| TPSB4 | 182.01942 | 55.407672 | … | |
| TPSB5 | 173.41283 | 52.674611 | … | |
| TPSB6 | 170.94588 | 35.442308 | … | |
| TPSB7 | 203.56175 | 34.194147 | ||
| TPSB8 | 189.51733 | 48.345097 | … | |
| TPSB9 | 117.96617 | 49.814314 | ||
| TPSB10 | 180.51921 | 35.321681 | … | |
| TPSB11 | 137.87483 | 45.468278 | ||
| TPSB12 | 139.49937 | 50.002175 | … | |
| TPSB13 | 173.16771 | 52.950400 | … | |
| TPSB14 | 178.62254 | 42.980203 | … | |
| TPSB15 | 179.02850 | 59.424919 | … | |
| TPSB16 | 190.45025 | 47.708878 | … | |
| TPSB17 | 198.74925 | 51.272583 | … | |
| TPSB18 | 200.95183 | 43.301181 | ||
| TPSB19 | 236.93392 | 41.402294 | … | |
| TPSB20 | 240.65804 | 41.293433 | … | |
| TPSB21 | 247.63600 | 39.384192 | … | |
| TPSB23 | 134.61913 | 0.02346944 | ||
| TPSB24 | 145.18546 | 21.234358 | … | |
| TPSB26 | 172.08300 | 27.622097 | … | |
| TPSB28 | 222.65771 | 22.734336 | … |