NEARBY GROUPS OF GALAXIES IN THE HERCULES–BOOTES CONSTELLATIONS
I. D. Karachentsev(*)(*)footnotemark: (*),
O. G. Kashibadze1,
V. E. Karachentseva2
1Special Astrophysical Observatory of Russian AS, Nizhnij Arkhyz 369167, Russia
2Main Astronomical Observatory, National Academy of Sciences of Ukraine, Kiev, 03143 Ukraine
(Received March 2, 2017; Revised March 17, 2017)
We consider a sample of 412 galaxies with radial velocities km s-1 situated in the sky region of –, … between the Local Void and the Supergalactic plane. One hundred and eighty-one of them have individual distance estimates. Peculiar velocities of the galaxies as a function of Supergalactic latitude SGB show signs of Virgocentric infall at and motion from the Local Void at . A half of the Hercules–Bootes galaxies belong to 17 groups and 29 pairs, with the richest group around NGC 5353. A typical group is characterized by the velocity dispersion of km s-1, the harmonic radius of kpc, the stellar mass of and the virial-to-stellar mass ratio of . The binary galaxies have the mean radial velocity difference of km s-1, the projected separation of kpc, the mean integral stellar mass of and the mean virial-to-stellar mass ratio of about . The total dark-matter-to-stellar mass ratio in the considered sky region amounts to being almost the same as that in the Local Volume.
Keywords: galaxies: kinematics and dynamics—galaxies: distances and redshifts—galaxies: groups
1 Introduction
Mass radial-velocity measurements of galaxies in the recent optical and radio sky surveys like the SDSS [1], HIPASS [2, 3, 4], and ALFALFA [5, 6] led to a significant enrichment in our understanding of the large-scale structure and galaxy motions in the nearby universe. Based on the data on approximately galaxies with radial velocities relative to the centroid of the Local Group km s-1, Karachentsev and Makarov [7, 8, 9] compiled catalogs of galaxy systems of different multiplicity throughout the sky, with the total number of about a thousand. For galaxy clustering, a new algorithm was applied that took into account individual masses (luminosities) of galaxies. Using the mutual separations, radial velocities and luminosities of galaxies in the -band, they determined virial and stellar masses of galaxy systems in the volume of a Mpc radius, which covers the entire Local Supercluster and its nearest neighborhood.
One of important results of these studies was the estimation of the bulk matter density, enclosed in the systems of galaxies, , which proved to be 3 to 4 times lower than the average global matter density [10]. Various assumptions were made to explain this discrepancy, listed in [11]:
-
a) groups and clusters are surrounded by extended dark haloes, and their main dark mass is localized outside the virial radius of the system;
-
b) the considered volume of the Local Universe is not representative, being located in a giant cosmic void;
-
c) a large part of dark matter in the universe is not enclosed in groups and clusters, but is distributed between them in diffuse large-scale structures (filaments, knots).
5mm \captionstylenormal
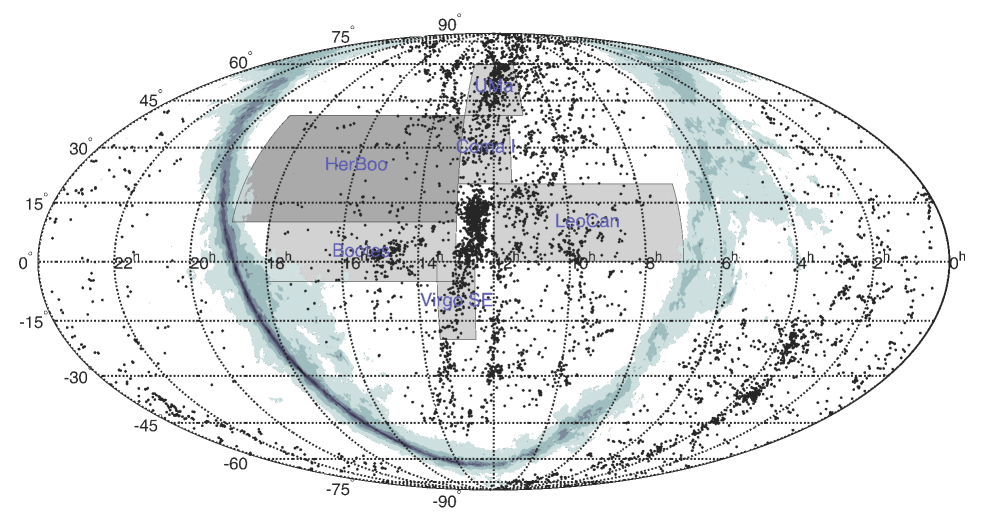
However, none of these assumptions has yet received any convincing observational evidence. Further accumulation of data on the radial velocities and distances of galaxies is obviously required, as well as the verification of the effectiveness of the criterium unifying the galaxies into groups. Following this idea, we conducted an analysis of observational data on galaxies in 5 areas with a fairly representative number of objects. Three of them are located along the plane of the Local Supercluster to the north [12, 13] and to the south [14] from the Virgo cluster. Two other: the Bootes region [15] and the Leo–Cancer region [16] cover the zones at high supergalactic latitudes. Location of the studied sky regions is demonstrated in Fig. 1 in equatorial coordinates. Points mark the positions of 5725 galaxies with radial velocities of km s-1, a ragged ring-shaped band denotes a zone of strong extinction in the Milky Way. In addition to the 5 previous zones (marked in a light gray tone), we are considering here a new region, bounded by the following coordinates: RA from to , and Dec from to . Since the relative number of galaxies with distance estimates steeply drops with increasing radial velocity of galaxies, we confined ourselves to considering only the objects with the velocities of km s-1, which corresponds to a somewhat larger volume than those in our previous studies.
2 Observational data
The region in question partially overlaps with the SDSS, HIPASS and ALFALFA sky survey regions. The main source of galaxy data we used is the NASA Extragalactic Database (NED)(**)(**)(**)http://ned.ipac.caltech.edu with additions from the HyperLEDA [17]. Each object with a radial velocity estimate was visually inspected, and a large number of false ‘galaxies’ with radial velocities of around zero was discarded. For many galaxies, we have refined the morphological types and integral -magnitudes. In the absence of photometric data the apparent magnitudes of a number of galaxies, usually dwarf ones, were estimated comparing them with the images of other objects having a similar structure and reliable photometry.
0mm\onelinecaptionstrue\captionstylenormal Name RA (2000.0) Dec T Method Group (1) (2) (3) (4) (5) (6) (7) (8) (9) UGC 8085 125817.3+143325 1971 Scd 14.5 204 32.37 tf N 4866 NGC 4866 125927.1+141016 1911 Sb 12.14 514 32.21 tf N 4866 NGC 4880 130010.6+122900 1293 S0a 13.12 AGC 233925 130015.7+292859 2482 dIr 18.08 90 AGC 239030 130018.9+293305 970 dIr 18.7 40 31.57 bTF AGC 233574 130022.1+125525 1838 dIr 17.6 70 32.74 TF N 4866 UGC 08114 130025.0+134013 1909 Sm 15.85 130 32.91 TF N 4866 PGC 1876816 130242.8+294458 2520 dIm 18.30 AGC 732482 130336.8+243132 816 Sm 16.2 97 32.15 TF AGC 233930 * 130402.7+281833 674 dIm 17.17 98 KK 181 130433.8+264627 1916 dIr 16.88 86 32.74 TF KUG 1302+329 130439.4+324054 2372 BCD 16.6 SDSS J130440 130440.0+184439 766 BCD 17.73 IC 4171 130518.8+360610 1026 Sdm 15.9 89 31.73 TF UGC 08181 130524.6+325400 900 Sdm 15.59 84 31.30 TF IC 4178 130541.5+360103 1215 dIm 16.53 64 31.48 TF NGC 4961 130547.6+274400 2525 Scd 13.7 216 33.00 tf N 4961 IC 4182 130549.6+373618 357 Sm 12.00 35 28.36 cep N 4736 BTS 165 130549.8+274240 2516 dIr 17.0 N4961 AGC 230077 130623.3+102600 841 dIm 15.66 46 30.79 TF KK 183 130642.5+180008 1496 dIr 17.90 75 31.98 bTF AGC 230084 130656.0+144826 915 dIm 16.39 49 30.40 TF PGC 2134801 130717.2+384321 2423 dIm 17.1 AGC 239031 130812.3+290517 822 dIr 18.3 23 29.96 TF AGC 742775 * 130828.4+200202 1430 dIr 18.2 146 PGC 1958740 130936.9+314034 1449 BCD 17.8 AGC 742788 * 131000.8+185530 2365 BCD 18.1 157 UGC 08246 131004.9+341051 825 SBc 14.82 116 30.90 tf U 8246 2MFGC 10495 131024.2+213434 2547 Sc 16.28 MU 2012 J13 131029.2+341413 873 dIm 17.4 U 8246 NGC 5002 131038.2+363804 1125 Sm 14.69 90 30.42 tf N 5005 PGC 2089756 131051.1+365623 1061 dIr 17.8 NGC 5005 131056.3+370333 983 Sb 10.54 490 31.54 tf N 5005 UGC 08261 131101.0+353008 881 Sm 16.36 94 31.70 bTF N 5005 SDSS J131115 131115.8+365912 992 dIr 18.43 PGC 2097739 131126.8+371843 998 dIm 17.48
In total, there are 412 galaxies in this region of the sky possessing radial velocities of km s-1. Their list is presented in Table 1, the full version of which is available in the electronic form in the VizieR database(***)(***)(***)http://cdsarc.u-strasbg.fr//viz-bin/qcat?J/other/AstBu/72.2. The columns of the table contain: (1) the name of the galaxy or its number in well- known catalogs; (2) equatorial coordinates for the epoch (2000.0); (3) radial velocity (in km s-1) relative to the centroid of the Local Group with the apex parameters accepted in the NED; (4) morphological type of the galaxy according to the de Vaucouleurs classification; (5) integral apparent magnitude of the galaxy in the -band; (6) the FWHM of the 21 cm radio line (in km s-1); (7) the distance modulus corrected for the extinction in the Galaxy [18] and internal extinction [19]; (8) the method by which the distance modulus is determined; (9) the name of the brightest galaxy in the group/pair to which this galaxy belongs according to [8, 9] or [7].
The considered region of the sky contains only one galaxy with a high-accuracy measurement of distance by the cepheids (“cep”). For four early-type galaxies the distances are determined by the surface brightness fluctuations (“sbf”, [20]), and for nine very nearby galaxies the distances are measured by the luminosity of the red giant branch (“rgb”). In the remaining galaxies of our sample the distance moduli are determined by the Tully–Fisher relationship [21] with the calibration according to [22]:
where is the absolute magnitude in the -band, and the width of the HI line (in km s-1) is corrected for the inclination of the galaxy. These estimates are denoted in Table 1 as “TF”. For late-type galaxies (dIr, dIm, Sm) in which the HI-value HI is brighter than the apparent magnitude, , we introduced the “baryon correction”, replacing the -magnitude in the distance modulus by . We designated these cases as “bTF”. Galaxies with the average distance modulus values from the NED are marked in column (8) by lower-case letters “tf”. In total in the region considered, there are 167 galaxies with distance estimates by Tully–Fisher, among them our new estimates make up about 70%.
In some galaxies from the ALFALFA HI-survey [5, 6] the width of the radio line does not correspond to the structural type of the galaxy and its apparent magnitude . The reason for this discrepancy may be a confusion during the optical identification of a radio source, or a low signal-to-noise ratio in the HI line. Such galaxies are marked in Table 1 with an asterisk.
5mm \captionstylenormal
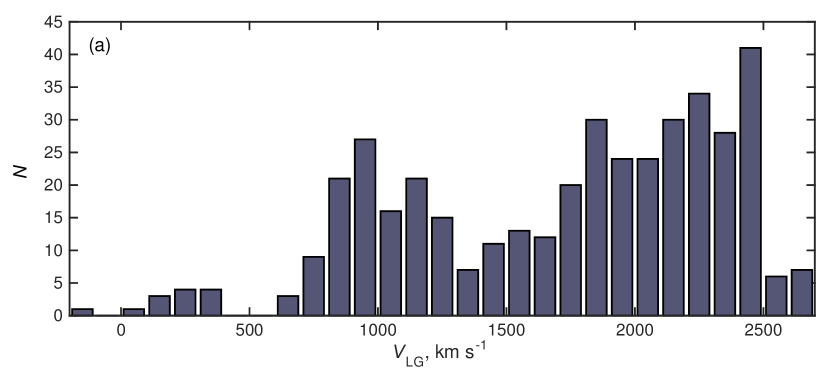
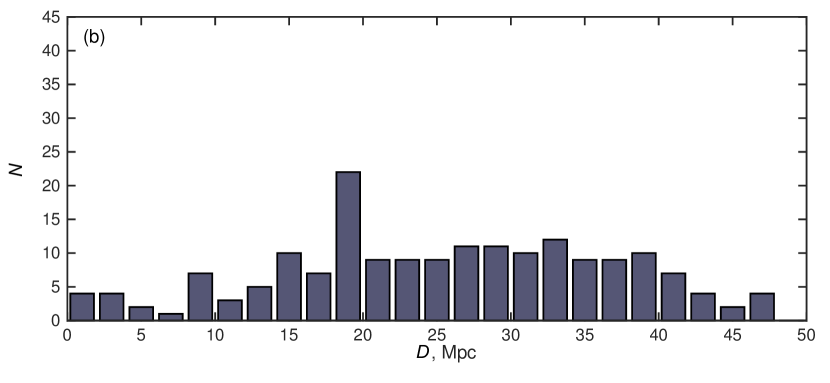
The distribution of 412 galaxies by radial velocity and 181 galaxies by the distance are shown in Figs. 2a, b, respectively. Several galaxies with velocities greater than km s-1 belong to the NGC 5353 and NGC 6181 group members, the average velocity of which lies at the boundary of the selected range . Figure 2a reveals a local excess of galaxies with the velocities of about km s-1, which is obviously due to the presence of galaxies, associated with the spurs of the Virgo cluster in the considered region. A part of these galaxies apparently causes a peak that is noticeable in the distribution at the distance of Mpc (Fig. 2b).
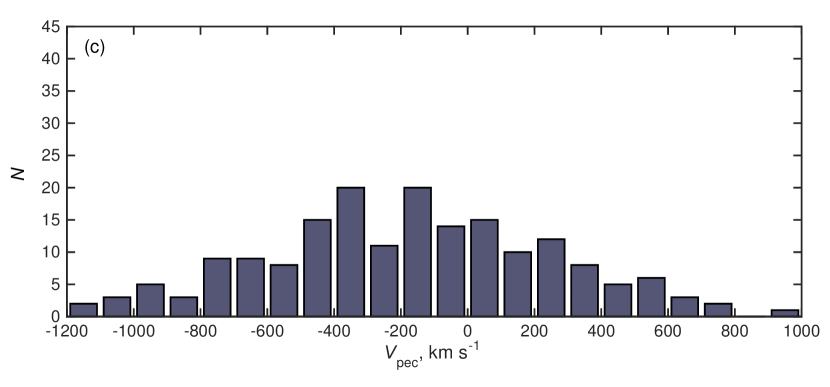
Figure 2c reproduces the distribution of 181 Hercules–Bootes galaxies throughout the peculiar velocity , given the value of the Hubble parameter of km s-1Mpc-1. The histogram has a completely symmetrical shape with the average value of km s-1 and the variance of km s-1. With an average distance of the sample galaxies of about Mpc and a typical distance error of around 20%, the expected accuracy of peculiar velocity is km s-1. The excess of the observed velocity dispersion over the expected dispersion may indicate the existence of large-scale motions of galaxies in the Hercules–Bootes region. Note that in the volume we consider, the number of galaxies with peculiar velocity estimates is approximately twice as large as that contained in the Cosmicflows-2 and Cosmicflows-3 databases of galaxy distances [23, 24].
5mm \captionstylenormal
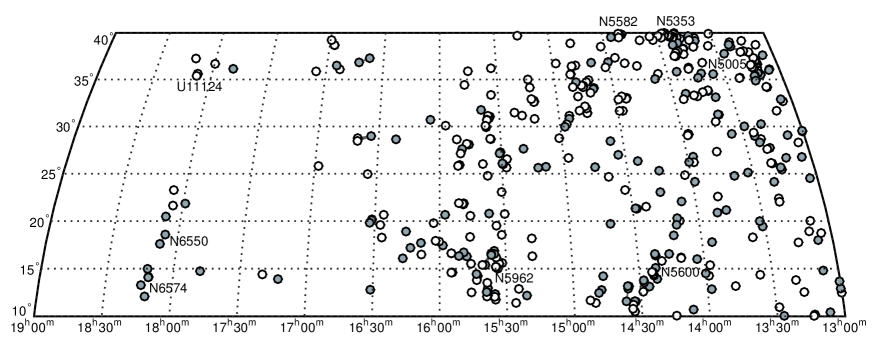
The total distribution of 412 Hercules–Bootes galaxies in equatorial coordinates is shown in Fig. 3. Galaxies with distance estimates and without them are marked by dark and bright circles, respectively. The most populated groups are designated by the names of their brightest members. This diagram demonstrates the clustering of galaxies into systems of different multiplicity, as well as a global increase in the number density of galaxies from the left to the right edge approaching the equator of the Local Supercluster.
3 Groups and pairs of galaxies
Combining the galaxies into systems of different multiplicity, we were guided by the criterion proposed in the paper [9]. According to it, each virtual pair must satisfy the condition of negative total energy
where is the gravity constant, and the condition of finding its components inside the “zero-velocity sphere”, which isolates this pair relative to the global Hubble expansion
where is the Hubble parameter. Here and are the differences between the radial velocities and the projection of mutual separations of the virtual pair components, is their total mass expressed through the -luminosity . To estimate the total mass of the galaxy, we took the value of the dimensionless parameter , at which the structure and virial mass of the well-studied nearby groups is best reproduced. The clustering algorithm involves a sequential revision of all the galaxies of the initial selection and the subsequent grouping of all pairs possessing common members.
0mm\onelinecaptionstrue\captionstylenormal Group J2000.0 (1) (2) (3) (4) (5) (6) (7) (8) (9) (10) (11) (12) (13) NGC 4736 125053.1+410714 13 352 50 338 10.64 12.33 13 28.28 0.14 4.5 NGC 4866 125927.1+141016 5 1909 58 156 11.21 12.68 4 32.56 0.28 32.5 NGC 5005 131056.2+370333 13 1010 114 224 11.48 12.97 9 31.24 0.41 17.7 NGC 5117 132256.4+281859 4 2414 27 424 9.97 11.95 2 32.80 0.09 36.3 NGC 5353 135539.9+402742 62 2593 195 455 12.07 13.69 16 32.73 0.39 35.2 NGC 5375 135656.0+290952 3 2311 47 66 10.62 11.68 1 32.94 – 38.7 NGC 5582 142043.1+394137 6 1685 106 93 10.60 12.44 2 31.82 0.54 23.1 NGC 5600 142349.5+143819 6 2295 81 275 10.69 12.38 3 32.05 0.91 25.7 UGC 9389 143533.2+125429 4 1822 45 204 9.68 12.08 4 32.54 0.19 32.2 PGC 55227 152929.2+260024 3 2119 14 17 9.21 10.05 2 32.34 0.17 29.4 NGC 5961 153516.2+305152 5 1891 63 86 10.14 12.20 1 32.51 – 31.8 NGC 5962 153631.7+163628 8 1996 97 60 11.23 13.01 6 32.60 0.35 33.1 NGC 5970 153830.0+121110 4 1949 92 141 10.81 12.54 3 32.45 0.28 30.9 UGC 10043 154841.3+215210 5 2214 67 65 10.37 11.88 1 33.03 – 40.4 NGC 6181 163221.0+194936 4 2568 53 196 11.06 12.14 3 32.65 0.19 33.9 UGC 10445 163347.4+285904 3 1118 23 230 9.92 11.60 1 31.57 – 20.6 NGC 6574 181151.2+145854 3 2456 15 70 11.08 10.71 2 32.36 0.43 29.6 Average 9 1924 67 182 10.63 12.14 4 32.15 0.34 29.2 205
Therefore, 17 galaxy groups with populations of three or more members were selected in the considered region of the sky. The main data about them are presented in the columns of Table 2: (1) the name of the brightest member of the group; (2) the equatorial coordinates of the center of the group; (3) the number of members with measured radial velocities; (4) the average radial velocity of the group (km s-1); (5) the root-mean-square velocity of galaxies relative to the average (km s-1); (6) the harmonic average radius of the group (kpc); (7) the logarithm of the total stellar mass of the group (in units), determined from the -band luminosity of its members at ; (8) the logarithm of the projected (virial) mass in units:
where and are the radial velocity and the projection distance of the -th galaxy relative to the center of the system; (9) the number of members with measured distances; (10) the average distance modulus of the group; (11) the variance of the moduli of the group members; (12) linear distance in Mpc at the mean modulus ; (13) peculiar velocity of the center of the group, , (km s-1). The last row of the table corresponds to the average values of the parameters.
As follows from these data, the characteristic radius of the group ( kpc) and the characteristic dispersion of radial velocities ( km s-1) prove to be typical of the Local Group and other nearby groups in the Local Volume [25]. The characteristic stellar mass of the group in Table 2, , and virial-to-stellar mass ratio, , are also typical for the well-studied nearby groups.
0mm\onelinecaptionstrue\captionstylenormal Name (1) (2) (3) (4) (5) (6) (7) (8) UGC 8246 849 48 15.1 27 8.48 10.86 – UGC 8318 2417 18 41.5 56 9.71 10.22 – AGC 732599 1902 24 26.1 55 8.13 10.57 – UGC 8507 980 29 12.6 132 9.25 11.11 0.87 PGC 169748 728 13 14.6 77 7.87 10.18 – UGC 8667 1417 26 19.4 13 8.63 10.02 – NGC 5303 1473 22 18.7 15 9.81 9.93 – IC 4341 2386 39 38.4 103 10.06 11.26 – NGC 5611 2076 80 25.2 54 10.23 11.61 – UGC 9274 1162 12 15.4 42 8.82 9.85 0.10 IC 1014 1278 2 18.3 73 9.37 8.53 0.43 UGC 9320 864 8 12.6 133 7.08 9.99 – UGC 9356 2181 56 35.0 61 9.76 11.35 0.96 NGC 5727 1578 4 23.5 55 9.20 9.01 – UGC 9504 1592 11 21.8 8 8.98 9.05 – UGC 9519 1711 18 23.4 101 10.00 10.58 – NGC 5762 1798 7 29.1 218 9.92 10.10 0.32 PGC 2080256 1978 1 27.1 10 8.70 7.07 – UGC 9562 1334 112 18.3 21 9.19 11.49 – NGC 5798 1881 24 25.1 152 9.98 11.01 – AGC 733735 2100 42 38.3 106 8.90 11.34 – NGC 5958 2119 12 29.0 43 10.17 9.86 – NGC 5956 1905 70 26.1 143 10.59 11.91 – NGC 6012 2012 175 21.7 48 10.50 12.24 – UGC 10086 2378 166 32.6 9 10.18 11.44 – NGC 6207 1035 4 17.5 360 10.16 9.83 0.28 NGC 6255 1100 23 19.9 194 9.60 11.08 – UGC 10625 2256 1 33.3 16 9.03 7.27 – NGC 6550 2410 15 24.2 454 10.85 11.08 0.21 Average 1686 37 24.3 96 9.42 10.34 0.45
5mm \captionstylenormal
If the clustering algorithm for galaxies is correctly selected, then the distance modulus variance of group members should be determined by the distance measurement errors. In our case, the distances of most galaxies are measured by the Tully–Fisher method, the error of which is approximately 20% or 0.4. The average modulus variance for members of 17 groups amounts to 0.34, i.e. it is in agreement with the expected value.
Among the 17 groups listed in Table 2, a group of galaxies around NGC 5353 is distinguished by large stellar and virial masses. The structure and morphological composition of this group were investigated in [26]. From the radial velocities of fifteen brightest members of the group the authors have identified the virial mass of this system as . Our estimate of the total mass of the NGC 5353 group from 62 galaxies with measured velocities gives a twice higher value. In this case, the ratio for it also looks typical of rich groups, similar to the nearby group Leo I. Considering the filamentary structures of galaxies in the broad vicinity of the Virgo cluster, Kim et al. [27] suggested that the NGC 5353 group is connected to the Virgo by a long (about ) thin filament. However, our data on the velocities and distances of galaxies in this area does not support this assumption.
In addition to 17 groups, this region contains 29 pairs of galaxies, a summary on which is presented in Table 3. The designations of the columns in it are similar to the previous table. A typical pair has a difference of the component radial velocities of km s-1, the projection distance between the components of kpc and the stellar mass of . The projected (orbital) mass of the pair,
is on the average 8 times the total stellar mass: . The mean difference of the distance moduli for the components of the pairs, 0.45, testifies to an insignificant share of fictitious optical pairs among them.
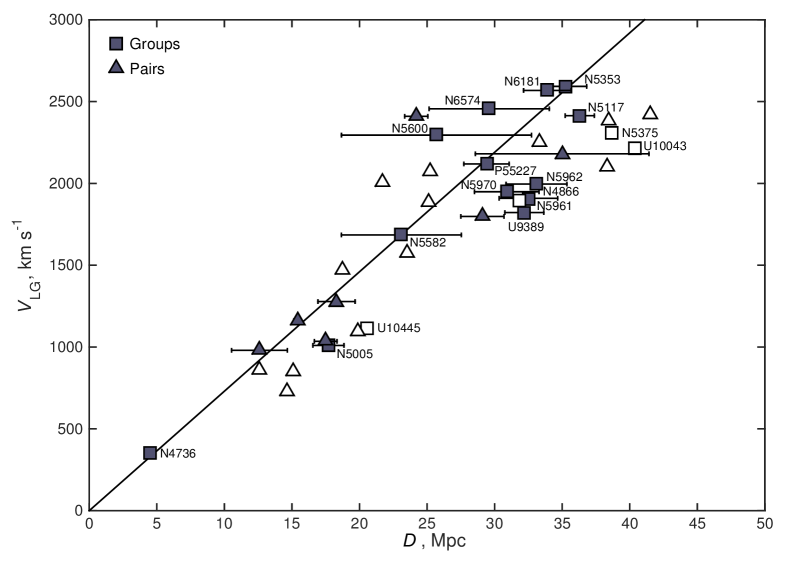
Figure 4 shows the Hubble velocity–distance diagram for the centers of groups and pairs of galaxies in the Hercules–Bootes region. Groups with individual distance estimates for two or more members are denoted by solid squares, while the groups with are shown as empty squares. The pairs of galaxies with and are depicted, respectively, by solid and empty triangles. The straight line corresponds to the Hubble parameter of km s-1Mpc-1. It is clear from these data that an increase in the number of group members with Tully–Fisher distance estimates favours to reduce dispersion of peculiar velocities in the group centers. We expect that groups of galaxies identified by the criterion [9] with have a typical error of the average distance measurement of about 10%, i.e. their average velocities and average distance estimates by the Tully–Fisher method can be successfully used for tracing the field of peculiar velocities along with other high-accuracy methods (“cep”, “SN”, “rgb”).
4 Peculiar motions in the Hercules–Bootes region
5mm \captionstylenormal
Considering the observational data on radial velocities and distances of the galaxies in the Local Supercluster and its environs, Tully et al. [28] have identified two main factors, forming the local field of peculiar velocities: the infall of galaxies to the center of the Virgo cluster (the so-called Virgocentric infall) at a characteristic rate of about km s-1 and the outflow of galaxies from the center of the expanding Local Void with the typical velocity of about km s-1. It is obvious that both these effects should influence the peculiar velocity field in the Hercules–Bootes region, stretching between the Local Void and the Virgo cluster.
Since the suspected center of the Local Void is located near the northern supergalactic pole at the latitude SGB [29], and the center of Virgo is almost on the equator of the Local Supercluster (SGB ), then the approximate orthogonality of these directions facilitates the analysis of the peculiar velocity field between them.
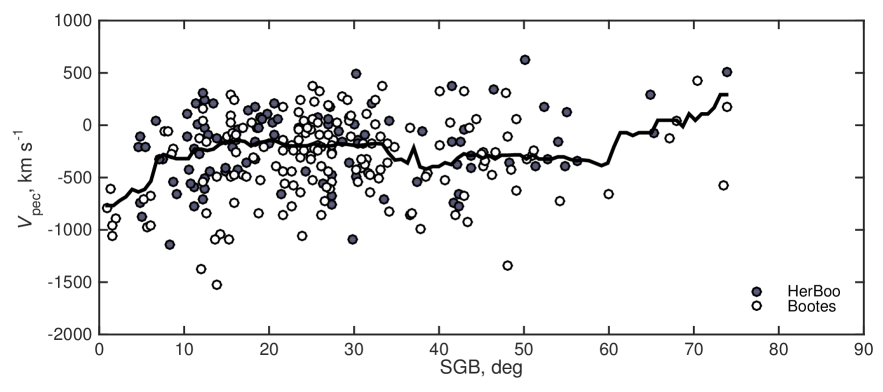
For all the galaxies in the RA [], Dec [] region with the and estimates we have determined supergalactic coordinates SGL and SGB. To make the picture complete we added 161 galaxy from the Bootes strip to this sample: RA [], Dec [], with radial velocities of km s-1. The behavior of the median value of peculiar velocity of galaxies along the supergalactic latitude is shown in Fig. 5. The solid broken line corresponds to a running median with an averaging window of 2.5. In order to make the combined sample more homogeneous, we excluded from it the Hercules–Bootes galaxies with km s-1. The galaxies of the Hercules–Bootes and Bootes strip regions are depicted in the figure by solid and open circles, respectively.
As follows from these data, at intermediate supergalactic latitudes of SGB [] the values of the median peculiar velocity of galaxies vary in a narrow range from to km s-1. At low supergalactic latitudes, SGB , the median value drops to the minimum value of about km s-1. Most of the galaxies in the SGB zone have the distances of Mpc, i.e. they are behind the Virgo cluster. Falling in the direction of the Virgo cluster as a massive local attractor, these galaxies acquire a significant negative line of sight peculiar velocity. The observed amplitude of the flow to Virgo proves to be comparable with the virial dispersion of the cluster velocities km s-1.
On the other side of the diagram at SGB the statistics of the peculiar velocity data is poor. Nevertheless, there is a tendency of growth of the galaxy median velocity to the region of positive values. The interpretation of this effect depends on the model assumptions on the structure and kinematics of the Local Void. If its center is located at the distance of Mpc [30] at SGB, then the galaxies with a typical distance of Mpc around the expanding void will have a positive component of the line of sight peculiar velocity. However, the real configuration of the Local Void according to the data of [31] looks more complicated. According to these authors, the Local Void is a chain of empty volumes, which, meandering like a horseshoe, covers both the Local Volume and the Virgo cluster.
Rizzi et al. [32] have recently measured
with high accuracy the rgb-distances to two close dwarf
galaxies located not far from the direction to the center of the Local Void:
KK246 ( Mpc, ),
as well as ALFAZOA1952+1428
( Mpc, ).
The galaxies have an
average peculiar velocity of km s-1. Given the
recession velocity of the Milky Way itself from the center of the
Local Void of about km s-1 this corresponds to the
recession velocity of these galaxies from the center of the void of
about km s-1. Therefore, four different sets of
observational data
([28, 30, 32],
this article) on peculiar velocities of galaxies in the vicinity of
the nearest void show that the walls of the void move outward from
its center at a characteristic velocity of several
hundred km s-1.
5 Discussion
0mm\onelinecaptionstrue\captionstylenormal Parameter Leo–Cancer Bootes strip Hercules–Bootes Sky area, sq.deg. 1477 1121 2447 , km s-1 2000 2000 2500 Volume, Mpc3 3084 2337 9975 543 361 412 290 161 181 Number density, Mpc-3 0.176 0.154 0.042 (groups+pairs) 23+20 13+11 17+29 Fraction of isolated 0.51 0.44 0.50 3.50 2.63 2.62 2.47 2.45 0.57 9.10 8.80 9.58 26 33 37
As it was repeatedly noted (see [9, 11]), the total virial mass of groups and clusters in the Local Universe with a diameter of about Mpc is only 8–10% of the critical density, which is about 3 times smaller than the global density of dark matter, . A significant enlargement of the observational base thanks to the recent optical and HI sky surveys left this contradiction almost unchanged. In this regard, it is useful to consider how the problem of missing dark matter looks like based on the data for various regions of the Local Supercluster.
Table 4 presents the main characteristics of the three regions of the sky we have studied: Leo–Cancer, the Bootes strip and Hercules–Bootes, located outside the plane of the Local Supercluster, which is laden with the projection effects. The first three lines of the table contain: the area of each region in square degrees, the maximum velocity, up to which the galaxies were considered, and the volume of each region in Mpc3 at km s-1Mpc-1. The following two lines (4 and 5) contain the number of galaxies in these zones with measured radial velocities and distances . As shown in line 6, the number densities of galaxies with measured velocities are approximately the same in the Leo–Cancer and Bootes regions, while in the Hercules–Bootes zone this density is significantly lower than in the others. The number of groups and pairs of galaxies (line 7) varies significantly from zone to zone, while the least dense area, Hercules–Bootes contains an increased number of pair systems consisting of low-luminosity galaxies. The relative number of single (non-clustered) galaxies (line 8) makes up about a half in each region, along with that, the field population is dominated by dwarf galaxies. Line 9 shows the total stellar mass of galaxy members in systems of different multiplicity. Line 10 contains the value of stellar density, expressed in relation to the average cosmic density Mpc-3 according to [33] at [34]. As we can see, the Leo–Cancer and Bootes regions have the average stellar density 2.5 times larger than the global density, and the Hercules–Bootes region is located lower than the level of average cosmic density. The last two lines present: the total virial (projected) mass of all groups and pairs, as well as its relation to the stellar mass sum of these systems. Note that the ratio varies in a small range from 26 to 37, despite significant differences in the average stellar density from one area to another.
Given the global average stellar matter density of Mpc-3, which is currently known with the error of about 30%, a dimensionless ratio of critical matter density to stellar density amounts to [35]. The observed values of in the three considered regions prove to be an order of magnitude smaller than the critical ratio.
Note that we did not take into account single non-clustered galaxies, which account for about a half of the total number of galaxies in each region. However, additional analysis shows that their contribution in the total stellar mass does not exceed 20%, since the majority of field galaxies have a low luminosity. In addition, single galaxies with their dark haloes contribute to both the denominator and the numerator of the ratio. This is why accounting for single galaxies can not significantly affect the values presented in the last row of Table 4. It is important to emphasize that the value of is typical of the dark haloes of the Milky Way, M 31, M 81 and other brightest galaxies of the Local Volume [25]. Therefore, the observed lack of virial mass in the nearby systems of galaxies is still an actual problem for the cosmology of the Local Universe.
Acknowledgments
In this paper we used the NASA Extragalactic Database (NED) and HyperLEDA database, as well as the HIPASS, ALFALFA and SDSS sky survey data. IDK and OGK are grateful to the Russian Science Foundation for the support (grant no. 14–02–00965).
References
- [1] K. N. Abazajian, J. K. Adelman-McCarthy, M. A. Agüeros, et al., Astrophys. J. Suppl. 182, 543 (2009).
- [2] B. S. Koribalski, L. Staveley-Smith, V. A. Kilborn, et al., Astronom. J. 128, 16 (2004).
- [3] O. I. Wong, E. V. Ryan-Weber, D. A. Garcia-Appadoo, et al., Monthly Notices Roy. Astronom. Soc. 371, 1855 (2006).
- [4] L. Staveley-Smith, R. C. Kraan-Korteweg, A. C. Schröder, et al., Astronom. J. 151, 52 (2016).
- [5] R. Giovanelli, M. P. Haynes, B. R. Kent, et al., Astronom. J. 130, 2598 (2005).
- [6] M. P. Haynes, R. Giovanelli, A. M. Martin, et al., Astronom. J. 142, 170 (2011).
- [7] I. D. Karachentsev and D. I. Makarov, Astrophysical Bulletin 63, 299 (2008).
- [8] D. I. Makarov and I. D. Karachentsev, Astrophysical Bulletin 64, 24 (2009).
- [9] D. Makarov and I. Karachentsev, Monthly Notices Roy. Astronom. Soc. 412, 2498 (2011).
- [10] N. A. Bahcall and A. Kulier, Monthly Notices Roy. Astronom. Soc. 439, 2505 (2014).
- [11] I. D. Karachentsev, Astrophysical Bulletin 67, 123 (2012).
- [12] I. D. Karachentsev, O. G. Nasonova, and H. M. Courtois, Astrophys. J. 743, 123 (2011).
- [13] I. D. Karachentsev, O. G. Nasonova, and H. M. Courtois, Monthly Notices Roy. Astronom. Soc. 429, 2264 (2013).
- [14] I. D. Karachentsev and O. G. Nasonova, Monthly Notices Roy. Astronom. Soc. 429, 2677 (2013).
- [15] I. D. Karachentsev, V. E. Karachentseva, and O. G. Nasonova, Astrophysics 57, 457 (2014).
- [16] I. D. Karachentsev, O. G. Nasonova, and V. E. Karachentseva, Astrophysical Bulletin 70, 1 (2015).
- [17] D. Makarov, P. Prugniel, N. Terekhova, et al., Astronom. and Astrophys. 570, A13 (2014).
- [18] E. F. Schlafly and D. P. Finkbeiner, Astrophys. J. 737, 103 (2011).
- [19] M. A. W. Verheijen and R. Sancisi, Astronom. and Astrophys. 370, 765 (2001).
- [20] J. L. Tonry, A. Dressler, J. P. Blakeslee, et al., Astrophys. J. 546, 681 (2001).
- [21] R. B. Tully and J. R. Fisher, Astronom. and Astrophys. 54, 661 (1977).
- [22] R. B. Tully, L. Rizzi, E. J. Shaya, et al., Astronom. J. 138, 323 (2009).
- [23] R. B. Tully, H. M. Courtois, A. E. Dolphin, et al., Astronom. J. 146, 86 (2013).
- [24] R. B. Tully, H. M. Courtois, and J. G. Sorce, Astronom. J. 152, 50 (2016).
- [25] I. D. Karachentsev and Y. N. Kudrya, Astronom. J. 148, 50 (2014).
- [26] R. B. Tully and N. Trentham, Astronom. J. 135, 1488 (2008).
- [27] S. Kim, S.-C. Rey, M. Bureau, et al., Astrophys. J. 833, 207 (2016).
- [28] R. B. Tully, E. J. Shaya, I. D. Karachentsev, et al., Astrophys. J. 676, 184 (2008).
- [29] A. V. Tikhonov and I. D. Karachentsev, Astrophys. J. 653, 969 (2006).
- [30] O. G. Nasonova and I. D. Karachentsev, Astrophysics 54, 1 (2011).
- [31] A. A. Elyiv, I. D. Karachentsev, V. E. Karachentseva, et al., Astrophysical Bulletin 68, 1 (2013).
- [32] L. Rizzi, R. B. Tully, E. J. Shaya, et al., Astrophys. J. 835, 78 (2017).
- [33] D. H. Jones, B. A. Peterson, M. Colless, and W. Saunders, Monthly Notices Roy. Astronom. Soc. 369, 25 (2006).
- [34] E. F. Bell, D. H. McIntosh, N. Katz, and M. D. Weinberg, Astrophys. J. Suppl. 149, 289 (2003).
- [35] M. Fukugita and P. J. E. Peebles, Astrophys. J. 616, 643 (2004).
Translated by A. Zyazeva