Comparison of CPMG and Uhrig Dynamic Decoupling (UDD) for tissue refocusing in MRI
Abstract
Two different dynamic decoupling strategies, the classic CPMG and the more recently proposed UDD protocol are compared in the context of magnetic resonance imaging (MRI). Both sequences were implemented on a 3T human MRI system and relaxometry was performed for a variety of tissue-mimicking agarose gels. We find that CPMG provides moderately better decoupling than UDD. The results are consistent with experimental noise spectra obtained from in vivo spectroscopy results, which suggest that the type of noise spectra obtained would favor CPMG. Theoretical coherence pathway analysis further suggests that UDD is more susceptible to systematic errors due to static magnetic and radio-frequency field inhomogeneity or imperfect excitation and refocusing pulse profiles.
pacs:
87.19.lf, 87.61.Hk, 87.61.HBjI Introduction
Refocusing is a technique widely used in nuclear magnetic resonance (NMR) to compensate for systematic errors, e.g., arising from static magnetic field inhomogeneities, and as a way to modify image contrast in MRI. The oldest technique is the Hahn spin echo (SE), which involves a refocusing pulse inserted halfway between the excitation and readout pulse Hahn1950 . Modern fast spin echo (FSE) techniques utilize the same basic 90∘-180∘ SE but with multiple 180∘ refocusing pulses to reduce image acquisition times. SE and FSE sequences form the basis of many clinical imaging protocols.
Hahn’s work was later extended by Carr, Purcell, Meiboom and Gill Carr1954 ; Meiboom1958 . The resulting CPMG sequence consists of two refocusing pulses applied at time and , where is the echo readout time. Unlike for the Hahn spin echo, the refocusing pulses are usually applied about an axis orthogonal to that of the excitation pulse. The two-pulse CPMG sequence can be repeated times, resulting in a sequence of regularly spaced refocusing pulses. Regular spacing of the refocusing pulses was assumed to be optimal, especially in mitigating the effects of free diffusion Meiboom1958 .
More recently Uhrig showed that changing the spacings between the refocusing pulses can improve decoupling for a spin- particle coupled to a noisy environment characterized by an Ohmic bath Uhrig2007 . In UDD the pulse spacings are chosen to make the first derivatives of the modulation function with respect to the frequency vanish at , the modulation function being the Fourier transform of the piecewise constant switching function that changes sign whenever a decoupling or refocusing pulse is applied. It was later argued that this choice of timings should provide better refocusing for a range of noise spectra, not limited to Ohmic-bath-like spectra Yang2008 ; Uhrig2010 .
This has spurred a number of recent papers investigating the efficiency of different dynamic decoupling (DD) schemes. In Ref. Szwer2011 it was observed that both UDD and CPMG afforded comparable protection from the ambient noise environment with regard to extending the coherence time of a memory qubit consisting of a single trapped 43Ca+ ion. Ref. Du2009 found that UDD outperformed CPMG in preserving electron spin coherence in irradiated malonic acid crystals at a wide range of temperatures, while CPMG outperformed UDD for a qubit consisting of a 13C nuclear spin coupled to a proton spin bath with a close-to-Gaussian spectral density distribution Ajoy2011 .
One of the applications suggested for UDD is contrast enhancement in MRI. Warren et al. compared the UDD sequence to the standard CPMG sequence and concluded that it appeared to result in improvements in contrast in cancerous tissue in mice Warren2009 . However, the observed effects were generally small and signal differences could be due various non-idealities in the experimental setup. In more recent work on endogenous magnetic resonance contrast based on the localized composition of fat, it was further observed that CPMG appeared more effective in refocusing oil while UDD appeared better at refocusing fat tissue Warren2013 .
These preliminary results suggest that advanced dynamic decoupling sequences such as UDD could have interesting applications in MRI. To assess this possibility and gain a better understanding the performance of novel decoupling sequence and their potential for applications in MRI, we perform relaxometry experiments to determine the observed transverse relaxation times for a set of tissue-mimicking agarose and agar hydrogel phantoms in a standard human MRI scanner. Specifically we determine the relaxation times for -pulse refocusing sequences with CPMG and UDD spacing, respectively. We further compare the performance of both sequences for different types of noise spectra using simulations and apply coherence pathway analysis to explain apparent differences in contrast observed in terms of differences in the sensitivity to tissue inhomogeneities as a result of interference effects for different echo pathways.
II Dynamic Decoupling and MRI contrast
The main sources of image contrast in conventional MRI are differences in the spin density and effective longitudinal and transverse relaxation rates, and respectively, of proton spins in different tissues. By decoupling the system from its environment to various degrees, dynamic decoupling pulses can change the effective relaxation rates and thus image contrast.
Inhomogeneities in the magnetic field, whether due to imperfections in the static magnetic field (), dynamic magnetic field gradients applied, tissue susceptibility effects or other sources, give rise to variations in the Larmor frequencies of the spins within a voxel. As a result the proton spins precess at different frequencies and the ensemble dephases over time. Applying a refocusing pulse halfway between the excitation and readout, inverts the phase of the spins, causing the ensemble to rephase at the target time. Thus a Hahn spin echo effectively compensates for the static or zero-frequency component of the combined resonance offset resulting from all sources . If the precession frequencies are not constant in time then a single refocusing pulse will refocus the spins only partially. Using average Hamiltonian theory it can be shown that refocusing can be improved by increasing the number of refocusing pulses.
Intuitively, equidistant spacing of the refocusing pulses, as in the repeated CPMG scheme, appears the most natural choice. However, it is not necessarily optimal. Specifically, it was show in Ref. Uhrig2007 that choosing the refocusing pulse timings according to the formula
| (1) |
improves decoupling for an Ohmic bath noise spectrum with a high-frequency cut-off, in that it makes not only the zero-frequency component of the modulation function vanish but also its first derivatives at . To be precise, is the Fourier transform of the time-domain switching function of the toggling frame Hamiltonian , where is Pauli matrix
For ideal instantaneous pulses applied at times , is piecewise constant, , and each pulse simply changes its sign. Ref. Yang2008 showed using perturbation theory that the choice of pulse timings (1) suppresses pure dephasing to th order for small not just for the spin-boson model for which it was originally derived Uhrig2007 but for a much larger class of bath models. It was also observed in this work that this result still holds for more general modulation functions, provided the scaled modulation function contains only odd harmonics of .
Recent work further suggests that the refocusing performance of UDD may depend on the tissue type Warren2009 , and that the conventional CPMG sequence may provide superior refocusing for liquids such as free water and oil, while UDD may perform better for certain biological tissues such as fat Warren2013 .
III Experiment Design and Results
The CPMG and UDD pulse sequences were implemented using the Siemens integrated development environment for applications (IDEA) C++ framework provided by the manufacturer. All experiments were performed on a Siemens (Erlangen, Germany) Magnetom Skyra system with tissue-mimicking gel phantoms.
III.1 Phantom preparation
Five agarose gel samples with agarose concentrations ranging from 1% to 5% agarose (#A0169, Sigma-Aldrich, Dorset, UK) were prepared by dissolving agarose powder in deionized water heated to C while mixing for minutes. Solidification and polymerization occurred at room temperature overnight. In addition to these test-tube size gels we also prepared a larger cylindrical agar hydrogel phantom consisting of a glass jar with six gel layers with varying concentrations of agar agar ranging from per of deionized water slightly doped with manganese chloride to reduce the relaxation times. Agarose, agar agar and carageenan gels were chosen due to their tissue-mimicking properties Mitchell1986 ; 2016arXiv160808542G .
III.2 Sequence design

The pulse sequence design consists of a slice-selective excitation pulse with a flip angle of about the -axis to transfer magnetization into the transverse plane, followed by a series of slice-selective refocusing pulses about the -axis, timed to coincide with CPMG or UDD spacing as defined in Eq. (1), followed by readout at the echo time . In addition to frequency and phase encoding gradients as required for imaging, the refocusing pulses are flanked by crusher gradients with variable gradient moments as shown in the sequence diagram Fig. 1. As the objective is to elucidate the effect of changes in the pulses timing, care was taken to ensure that the CPMG and UDD sequence variants were identical except for the differences in pulse timing, which was achieved by having a single implementation with a simple toggle switch to alternate between equal (CPMG) and UDD spacing of the refocusing pulses.
While the refocusing pulse sequence fixes the spacing of the refocusing pulses, it does not prescribe the excitation and refocusing pulses. Ideal refocusing pulses should produce instantaneous rotations but this is clearly not possible as realistic pulses have finite width and there are constraints on the pulse amplitudes. In addition the pulses are generally required to be slice-selective, which restricts the pulse shapes. We choose Hanning-filtered SINC pulses with pulse envelopes
| (2) |
for and (fixed) where is the pulse duration, which can be dynamically adjusted in the sequence protocol. As pulse sequences such as UDD and CPMG are designed for instantaneous pulses, shorter RF pulses, allowing shorter , or more refocusing pulses for a given , are desirable. However, in practice the pulse durations are constrained by technical limitations of the equipment (e.g., available transmitter voltages) and deterioration in the quality of the slice profiles for very short pulses.
Following previous work in this area (e.g. Warren2009 ) only the final echo is acquired for both CPMG and UDD. This departs from common practice in MRI, where multi-echo sequences such as CPMG are mostly used to accelerate image acquisition in FSE sequences and for mapping, and usually all intermediate echoes are used. Although it is possible to acquire intermediate echoes for the UDD sequence, the non-periodicity of the refocusing pulse timings means that UDD4 is not equal to repeating UDD2 twice, and therefore the interpretation of the intermediate echoes is not obvious. The inability to utilize intermediate echoes for UDD mapping is a disadvantage in terms acquisition times. However, this drawback can be offset by using slice selective refocusing pulses to perform mapping for multiple slices at once.
III.3 Phantom placement, coil and slice selection
The test-tube-sized agarose gels were placed in a cardboard sample holder on the patient table and positioned near the isocenter of the scanner. The build-in transmit body coil was used for the excitation and refocusing pulses, while a loop coil was used as the receive coil. For all gels a coronal slice was selected as shown in Fig. 2. Field-mapping was used to select the slice to avoid the field inhomogeneities near the top and bottom of the sample. The images acquired were automatically registered using in-house matlab code and circular regions of interest (ROI) selected. The radius of the ROI was about 80% of the phantom radius to avoid edge effects near the boundary.
The larger cylindrical agar hydrogel phantom was placed in a cylindrical knee coil aligned with the -axis approximately below the isocenter of the magnet. Unlike the loop coil used for the small samples, the knee coil is a transmit-receive birdcage resonator and was thus used both for RF excitation and readout. A coronal slice through the center of the phantom was selected and six rectangular ROI were chosen as shown in Fig. 3.


III.4 Transmitter Voltage Calibration
To determine the transmitter voltages required to obtain the desired flip angles, a number of gradient echo scans with and , respectively, and varying transmitter voltage were performed. The mean signal over a selected ROI of each sample was measured for each scan, and the signal fitted according to the formula
| (3) |
The resulting signal fits yield the flip angle as a function of the voltage, , assuming linear dependence, as well as the constants related to the saturation magnetization and the longitudinal relaxation time as a bonus. The results of the flip angle characterization for our agarose gels subject to SINC pulses of length are shown in Fig. 4. We infer from the graph that the voltage required to obtain a -pulse of length is around . Notice the signal curves for all agarose gels are virtually coincident with small errorbars indicating little variation of the signal over the ROI.
The equivalent signal vs transmitter voltage curves for the six ROIs of the six-layer agar gel phantom defined above, are shown in Fig. 5. Due to RF in homogeneity there is much greater variation of the signal over each ROI and the flip angle curves and the voltages required to achieve a -pulse. This means that it is impossible to choose a transmitter voltage that achieves uniform flip angles over the entire phantom.


To further calibrate the pulses to minimize unwanted stimulated echoes, a number of CPMG experiments were performed. Each experiment was carried out with two choices for the crusher gradients flanking the refocusing pulses: (1) symmetric crushers with gradients moment and , which suppress the stimulated echo, and (2) and , which dephase the regular echo and select the stimulated echo, where and refer to the left and right-flanking crushers, respectively. The voltages were then tuned to minimize the ratio of the stimulated echo and primary echo signals. Fig. 6 shows the ratios of the signal intensity for the stimulated and regular echo, averaged over the ROI, for the test-tube sized agarose gels as stem plots versus the peak voltage of the excitation and refocusing pulse. The data suggests that the optimal voltages for all samples cluster around and for the excitation and refocusing pulses, respectively.
For the six-layer agar gel phantom RF inhomogeneity leads to considerable variation in the stimulated vs regular echo ratios across the phantom as shown in Fig. 7 and the optimal choice of voltages for the excitation and refocusing pulses is less obvious. We choose and for the amplitudes of the excitation and refocusing pulses, respectively, because it resulted the most uniform SE/PE ratio compared to other choices that resulted in lower stimulated echo contributions for some parts of the phantom but higher values elsewhere.


III.5 Transverse relaxation subject to CPMGn and UDDn
To determine the transverse relaxation rates for our phantoms subject to different decoupling sequences, a series of images were acquired for -pulse CPMG and UDD sequences with even, ranging from to . The mean signal over a fixed ROI was measured for each sequence and fitted according to
| (4) |
in both cases to obtain and . The echo times were the same for both CPMGn and UDDn. For the agarose gels we compared two cases: (a) no crushers, i.e., crusher gradient moments zero and (b) symmetric crusher gradients with unequal moments designed to suppress all but the target pathway echo. For the six-layer agar gel phantom only the results without crusher gradients were used for fitting due to low signal values with crusher gradients applied, as expected considering the large stimulated echo contributions for this phantom. The results are shown in A and summarized in Fig. 8. As expected, we observe an almost linear increase in with concentration in all cases. Comparison of the values for CPMG and UDD, however, shows that CPMG consistently outperforms UDD in the sense that the observed relaxation rates with CPMG decoupling are consistently lower than for UDD decoupling. The fits for CPMG and UDD with uniform crusher gradients in Fig. 21 in the Appendix, further show that the difference between CPMG and UDD is negligible for the middle layers (3 and 4), for which the field maps show high homogeneity, while the CPMG performs significantly better than UDD for the outer layers, which are subject to significant inhomogeneity.
Although the transverse relaxation rates obtained from our fits are likely to be overestimated due to fractional signal losses for each refocusing pulse, the comparison should still be valid as these losses should be the same for both UDD and CPMG, considering that they differ only in the timing of the refocusing pulses. However, there are a number of ways the sequence could be improved. underestimation due to fractional signal loss could be corrected using mapping Poon1992 and by optimizing the refocusing angles to maximize in final echo amplitudes Henning2001 .


IV Dynamic Decoupling Simulations for Ideal Pulses
To explain these results, we performed simulations comparing the performance of ideal dynamic decoupling sequences with CPMG and UDD spacing, respectively, for different noise spectra. Assuming (i) that we start with all the magnetization transferred to the plane, , and (ii) that transverse magnetization loss due to relaxation is negligible on the relevant time scale, i.e., , we can assume for and reduce the Bloch equation to a single equation for the transverse magnetization ,
| (5) |
with . Integrating this equation yields the explicit formula
| (6) |
for the transverse magnetization at time . To investigate the effect of different noise spectra, we set , where is either noise with a flat frequency spectrum (white noise), noise with a spectral density proportional to (pink noise) or noise a spectral density proportional to (blue noise). For each case, 10,000 instances of are generated. As we are not interested in the constant offset here, which is refocused by a single spin echo, we set . We also drop the term, which is independent of the dephasing resulting from resonance frequency fluctuations. In our simulations there was no explicit high-frequency cut-off but the frequency resolution is limited by the time resolution of the noise sampling of and the length of the signal of . Examples of the different types of noise in the the time and frequency domain are shown in Fig. 9. Note that in a slight departure from convention we are applying the terms pink, white and blue to amplitude spectra, not the power spectral density, as the former are directly related to the induced dephasing. The evolution of the magnetization is calculated for each and the average magnetization computed by averaging the trajectories.


Fig. 10 shows that the refocusing pulses are effective for pink noise in that the average transverse magnetization reduces more slowly subject to refocusing pulses. Fig. 11 further shows that the effect increases with the number of refocusing pulses, as expected. However, there is little difference in between UDD and CPMG. In fact the transverse magnetization loss for CPMG is slightly smaller than for UDD. For blue noise UDD appears to have a slight advantage over CPMG for but comparing the magnetization loss subject to either CPMG or UDD refocusing and without refocusing for white and blue noise shows that refocusing is actually detrimental in this case in that it accelerates the loss of transverse magnetization. For white noise the effect appears independent of the number of refocusing pulses, while for blue noise the magnetization loss increases with the number of refocusing pulses.
These results are not too surprising considering that the cumulative effects of high frequency fluctuations on the phases of the proton spins tend to cancel over longer periods of time, and the longer the time averaged over, the better the averaging of the high-frequency components. On the other hand, if noise is dominated by low frequencies as in the case of pink () noise, then the echo time is too short for averaging to occur and refocusing becomes beneficial. They are also consistent with other theoretical work.
For example, Cywinski2008 found that for and random telegraph noise, UDD is optimal for suppressing initial decoherence in the presence of a hard ultraviolet cut-off in the Gaussian noise spectrum, but if the cut-off cannot be reached then CPMG is the better practical approach. The results were corroborated in Lange2010 ; Biercuk2009 and Pasini and Uhrig noted that for a pure-dephasing spin boson model for baths with power law spectra, the numerical optimization yielded dynamic decoupling sequences very close to CPMG for bath spectra with a soft cut-off but the solutions approached UDD as the cut-off became harder Pasini2010 .
Ref. Biercuk2009 examined the efficacy of dynamic decoupling sequences with regard to phase error suppression applied to a model quantum memory. The ambient magnetic field fluctuations in the high-field superconducting magnet were measured directly, showing a spectrum (power spectrum ) with a soft high-frequency cut-off. CPMG was found to perform similarly to UDD. Numerical simulations with artificially injected noise showed that UDD significantly outperformed CPMG when Ohmic noise with a high-frequency cut-off was injected, whereas CPMG performed similarly to UDD when noise with a high-frequency cut-off was injected.
V Experimental noise spectra for gel phantoms and tissue


To assess which noise model best describes the noise spectra for tissue and tissue-mimicking gel phantoms, we obtained experimental noise spectra for both using standard spectroscopy sequences for point-resolved single voxel spectroscopy and chemical shift imaging (CSI), PRESS and sLASER. The noise spectra were obtained from the normal spectra following the technique described in Relano2002 . For the prostate data informed consent was obtained from a volunteer under the centre’s ethical approval for pilot studies.
Fig. 12 shows that the amplitude noise spectra derived from experimental spectra for a gel phantom and prostate in vivo scans strongly resemble pink noise spectra. More specifically, they resemble pink noise spectra with a high frequency spike near the frequency cut-off determined by the sampling rate of the receive coils. Thus, the noise spectra are almost opposite of blue noise with a high-frequency cut-off. Therefore, our empirical observation that CPMG provides better refocusing in tissue-mimicking gels makes sense, and given the similarity between the noise spectra of our gels and in vivo spectra for human tissue, it stands to reason that the same results are likely to apply for tissue imaging. Pink noise also appears to be a more realistic noise model for biological systems and tissue-mimicking gels on theoretical grounds, considering that fluctuations due to -coupling and diffusive motion effects are typically low-frequency, on the order of a few hundred Hertz at most.
However, the simulations do not explain the empirical data fully. The differences in the observed signal strength between UDD and CPMG appear larger than the small differences observed in the simulations. Furthermore, the simulations do not explain the apparent enhancement of tissue inhomogeneities observed in the literature Warren2009 . To elucidate these observations requires more in depth analysis considering the effects of various non-idealities that can result in imperfect excitation and refocusing pulses.
VI Non-idealities and Coherence Pathways Analysis
An ideal excitation pulse converts the longitudinal magnetization of the entire slice uniformly to transverse magnetization and a perfect refocusing pulse inverts the sign of this transverse magnetization. Realistic excitation and refocusing pulses, however, are not perfect for various reasons ranging from inevitable variations across slices due to non-rectangular pulse profiles, especially for short excitation and refocusing pulses, to and RF inhomogeneity either due to technical imperfections in the equipment or tissue susceptibility effects, for example.
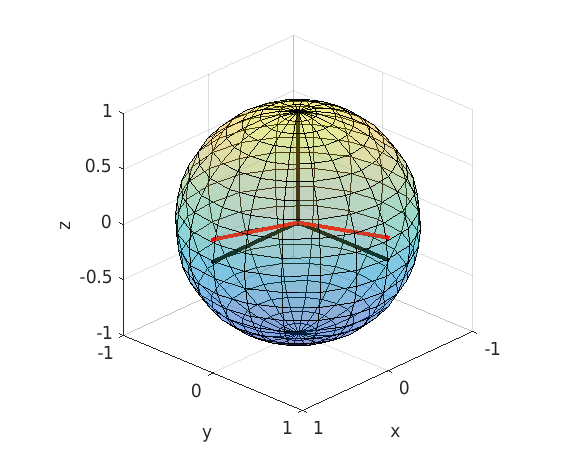
To elucidate the effects of applying a sequence of imperfect pulses on the evolution of an ensemble of spins we use coherence pathways analysis Scheffler1999 . Let be the longitudinal magnetization and decompose the transverse magnetization into dephasing and rephasing components, and . An instantaneous pulse effecting a rotation about a general axis maps the magnetization to the new magnetization vector by a linear transformation with
| (7) |
for a rotation about the axis , where and are the polar and azimuthal angles, respectively. Substituting and we can easily derive the corresponding linear transformation mapping the pre-pulse coherence vector to the post-pulse vector . Each pulse splits the ensemble into three components, which evolve between pulses according to
| (8) |
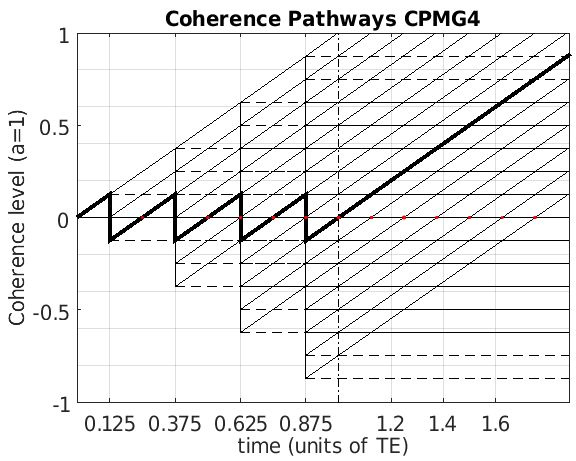
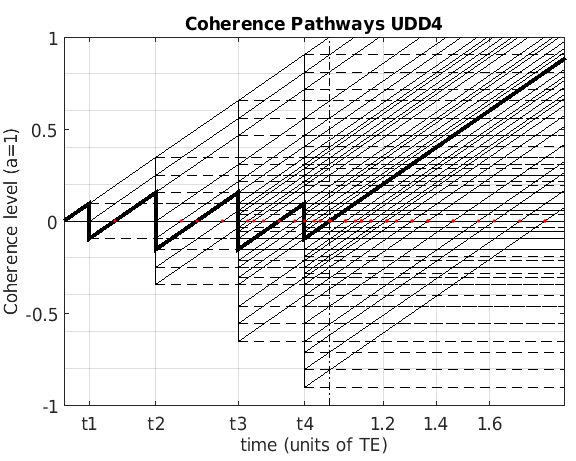
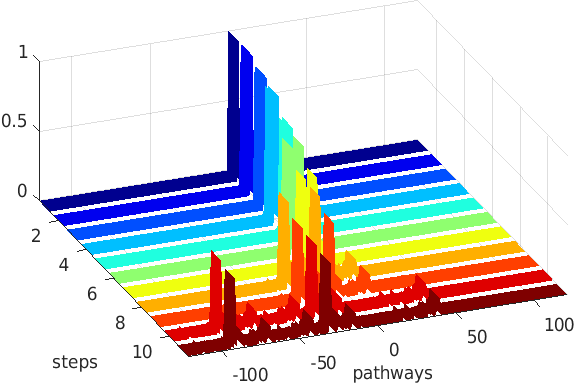
where is the time elapsed since the last pulse and and are the longitudinal and transverse relaxation rates, respectively. Combining these results enables us to compute the amplitudes of the coherences , and for all coherence pathways for a multi-pulse sequence of instantaneous rotations and delays. The coherence pathways and echo formation can be visualized diagrammatically as shown in Fig. 13.
We can label the pathways by the action of the pulses, using if the pulse does not change the magnetization, if it results in a rotation and if it results in a rotation. With this labeling of the pathways, careful analysis of the pathway diagrams shows that for constant dephasing the pathways 12222, 12020, 10202, 11001, 11221, 10110, 11111, 11122, 12112, 11012, 12101, 12211 are simultaneously refocused at the echo time for CPMG4, while for UDD4 pulse timing, four distinct echoes are formed around : pathway 11122 forms an echo at time , pathways X1211, XX120 with form an echo at time , pathways 12222, 11001, 11221, 10110, 12112 form an echo at time , and pathways 11012, 12101, 12211 form an echo at time .
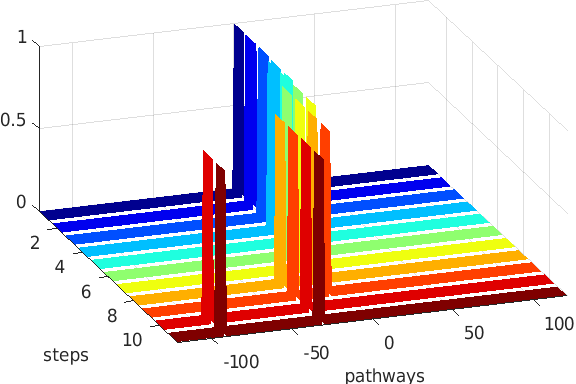
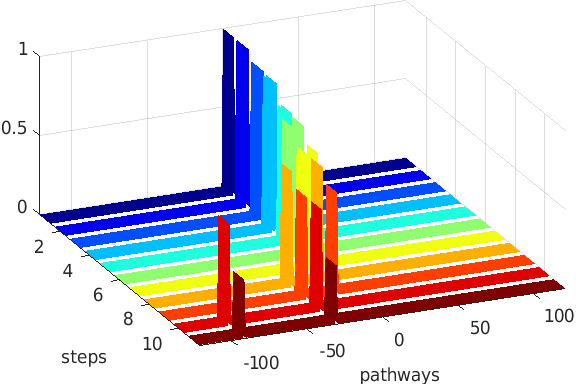
If all pulses are perfect then the only coherence pathway excited by the four-pulse CPMG or UDD sequence is the pathways shown in bold in Fig. 13. This is reflected in coherence amplitude plot in Fig. 14 (a) showing that there are only two non-zero amplitudes at each step in the sequence, corresponding to the and magnetization of the target pathway. With relaxation between pulses the amplitudes decay (b) but there are still only two matched peaks corresponding to and magnetization of the target pathway. Any rotation axis or angle error, however, leads to population of many other coherence pathways as shown in Fig. 14(c).
Crusher gradients can be applied to selectively dephase coherence pathways by ensuring that their total gradient moments are non-zero and preferably large. Our implementation allows crusher gradients with arbitrary gradient moments and before and after the th refocusing pulse but to preserve the target pathway, the crusher gradient moments before and after each refocusing pulse must be equal . Uniform crusher gradient moments , the default choice for the standard CPMG sequence Bernstein2004 , suppress unwanted FID signals but still refocus many stimulated echo pathways. Dephasing the latter requires the crusher gradient moments for different refocusing pulses to be mutually distinct for . For the explicit conditions that should be satisfied are
For sequences with more refocusing pulses the number and complexity of the equations increase dramatically.
Computation of the coherence amplitudes for CPMG and UDD pulse spacings shows negligible differences in the coherence amplitudes as a result of the different pulse spacing for typical values of the echo time and and relaxation times. However, Fig. 13 shows that the difference between CPMG and UDD lies in the timings at which the echoes occur. The many possible coherence pathways give rise to many echoes for both sequences. However, for CPMG pulse spacing many of these echoes coincide, leaving only a limited number of well-separated echoes. This endows the CPMG sequence with significant robustness with regard to pulse imperfections — even if other pathways are populated, most of these are refocused to form echoes concomitant with the target echo or well before or after the target echo. The latter are likely to be almost entirely dephased during the measurement of the target echo and thus irrelevant.
UDD pulse spacing, on the other hand, results in a multitude of possible echoes, several of which occurring close to but not concomitant with the target echo. Hence, if some of these other pathways are populated, we are likely to see interference of multiple echoes around the target time, resulting in complicated measurement signals. At the least the different coherence levels of the pathways, if excited, will reduce the overall coherence of the ensemble and thus the magnitude of the (transverse magnetization) readout signal. Thus, UDD is more sensitive than CPMG to imperfect excitation and refocusing pulses unless the crusher gradients are large enough to completely dephase all unwanted excitation pathways. As the differences in the coherence amplitudes of the various pathways for UDD and CPMG are marginal (at least for ), if unwanted pathways are completely dephased the differences between UDD and CPMG should decrease. Dephasing of the population in these pathways will reduce the magnetization signal in both cases.
Interference of echo pathways is a likely explanation why UDD appears to enhance inhomogeneities in tissue. Such inhomogeneities tend to result in slight variations in the effective amplitudes of the RF pulses, resulting in pulse angle errors that lead to population of non-target pathways and echo interference effects. Local magnetic susceptibility effects, for example, change the local -field by a factor of , being the susceptibility. As , local susceptibility effects lead to resonance offsets in a voxel and result in rotation axis errors as shown in Fig. 15. Thus UDD can enhance local susceptibility effects. However, it will also enhance inhomogeneities resulting from other sources, such as intrinsic or inhomogeneities, for example.
The echo interference effect due to local susceptibility variations can be seen in the images of a slice through a cylindrical water phantom with a small aluminum block (not visible) affixed on top in Fig. 16. The top left CPMG4 image with uniform crusher gradients shows almost no evidence of the aluminum block as the stimulated echo coherences created in the non-target pathways are refocused and create echoes concomitant with the target echo. When the crusher gradient moments are made unequal to dephase the population in the non-target pathways a dark spot becomes visible in the vicinity of the aluminum block in the top right CPMG4 image due to reduced population in the target pathway. For UDD4, on the other hand, the bottom left image, acquired with uniform crusher gradients, shows a clear interference fringe, which is significantly reduced when non-equal crushers are applied (bottom right). The fact that the fringe is reduced but still visible is most likely due to the applied crusher gradients being insufficiently strong to completely dephase the non-target pathways.

Chemical shifts can have a similar effect. Assuming the excitation and refocusing pulses are calibrated to produce perfect and rotations for water protons then chemical shift offsets, e.g., for oil or fat, result in imperfect rotations that spread the population over many coherence pathways producing effects similar to or inhomogeneity.


Example 1 (Water-Oil Chemical Shift Effect.)
The chemical shift for oil relative to water at is . If we apply a -pulse at the resonance frequency of water then the nominal Rabi frequency is . Hence, , the actual Rabi frequency and azimuthal angle of the rotation axis , i.e., the rotation angle error is 5% and rotation axis error is 18% for the excitation pulse. Similarly, for a nominal -pulse we have and and , i.e., a rotation axis error of 11% and angle error of about 1%.
The effect of these pulse errors on the coherence amplitudes is shown in Fig. 17. The amplitudes for oil are overall lower due to much greater relaxation. The off-resonant pulses convert a significant amount of magnetization to longitudinal magnetization, and of the remaining transverse magnetization, the population of the target pathway is only 93%. The differences in the coherence amplitudes between UDD and CPMG are negligible but as CPMG refocuses the populations of the main alternative pathways at along with the main pathway, while UDD does not, CPMG will result in the appearance of better refocusing, especially for uniform or no crusher gradients.
Finally, we observe that the resulting longitudinal coherences created by imperfect pulses decay slowly, having decayed only by at the beginning of the next scan, even in a single echo scan. Unless this may result in complex features and characteristics commonly seen with short- steady-state free precession sequences.
To better understand the performance of dynamic decoupling sequences such as UDD in the presence of various experimental imperfections, and optimize the sequence parameters, the coherence pathway analysis could be extended to include full Bloch equation simulations incorporating experimental slice profiles for the excitation and refocusing pulses to calculate the predicted echo signal Lebel2010 ; Petrovic2015 .
VII Conclusion
Despite suggestions in previous work that UDD may provide better refocusing of tissue than the conventional and widely used CPMG sequence Warren2009 ; Warren2013 , our relaxometry results for carefully calibrated experiments using tissue-mimicking gel phantoms suggest that the conventional CPMG sequence with regular spacing of the refocusing pulses provides better refocusing of tissue and greater robustness than UDD.
These results are supported by theoretical considerations and simulations. UDD has been shown to provide superior decoupling for a two-level system coupled to a bath characterized by a power spectrum of the form with a high-frequency cutoff Uhrig2007 . Our simulations suggest that UDD still performs marginally better than CPMG if the resonance frequency offset is characterized by a blue noise amplitude spectrum. However, in the context of MRI, no refocusing is preferable to either CPMG or UDD refocusing in the presence of white or blue noise as the effects of resonance offset fluctuations with frequencies much greater than the inverse echo time, , tend to average and refocusing interferes with this averaging effect. The simulations show that refocusing is beneficial in the presence of pink noise, characterized by a amplitude spectrum and dominated by low-frequency fluctuations. Both theoretical and empirical observations suggest that biological systems such as tissue are generally subject to noise. Our simulations show that CPMG outperforms UDD even for ideal instantaneous refocusing pulses for pink noise, consistent with our empirical observations.
Coherence pathway analysis furthermore suggests that regular pulse spacing such as CPMG benefits from robustness with regard to imperfect excitation and refocusing pulses. Imperfect pulses lead to the accumulation of population in a multitude of coherence pathways and the formation of a multitude of echoes in addition to the main echo at time . For the regular pulse spacing of CPMG many of these additional echoes coincide with the main echo. This simultaneous refocusing of alternative echo pathways endows CPMG with special robustness in the presence of imperfect pulses. For non-uniform spacing of the refocusing pulses, as in UDD, additional echoes occur at different times. For UDD4 spacing, for example, there are three additional echoes offset from the main echo by less than 10%, which can interfere, producing interference patterns in the image. This effect renders sequences such as UDD more susceptible to pulse imperfections and both and RF inhomogeneity.
While the sensitivity to inhomogeneity is problematic in the presence of inhomogeneity caused by technical imperfections of the equipment, it also renders UDD more sensitive to resonance offsets due to chemical shifts — which may explain some of the differences observed in the refocusing of oil and water — as well as sensitivity to small variations in tissue susceptibility – which may explain the apparent enhancement of inhomogeneities in tissue observed in Warren2009 — and suggests that decoupling sequences with non-equal pulse spacing may be useful for certain imaging tasks. Given that UDD spacing is less effective than CPMG for noise, however, we conjecture that decoupling sequences with non-equal spacing different from UDD spacing exist that outperform UDD and CPMG in refocusing tissue. The design of such sequences requires further experimental characterization of noise spectra for different types of healthy and diseased tissue.
Another area of future work suggested by our results are dynamic decoupling sequences optimized for realistic RF pulses. Although it has been observed in Uhrig2010 that in principle, the effect of finite pulse durations can be mitigated by using optimized, shaped pulses, in MRI the need for slice-selective pulses imposes constraints on the duration of the pulses and optimization of pulse shapes. This limits the number of decoupling pulses that can be applied and suggests a need for more robust, simultaneously time and slice-profile optimized RF pulses. Furthermore, much greater static magnetic and RF field inhomogeneity in large-bore or clinical MR systems compared to high-field NMR spectrometers, make robustness of dynamic decoupling sequences to such imperfections critical for applications in MRI.
References
References
- (1) Hahn E L 1950 Phys. Rev. 80(4) 580–594 URL http://link.aps.org/doi/10.1103/PhysRev.80.580
- (2) Carr H Y and Purcell E M 1954 Phys. Rev. 94(3) 630–638 URL http://link.aps.org/doi/10.1103/PhysRev.94.630
- (3) Meiboom S and Gill D 1958 Review of Scientific Instruments 29 688 ISSN 0034-6748 URL http://dx.doi.org/10.1063/1.1716296
- (4) Uhrig G S 2007 Phys. Rev. Lett. 98(10) 100504 URL http://link.aps.org/doi/10.1103/PhysRevLett.98.100504
- (5) Yang W and Liu R B 2008 Phys. Rev. Lett. 101(18) 180403 URL http://link.aps.org/doi/10.1103/PhysRevLett.101.180403
- (6) Uhrig G S and Pasini S 2010 New Journal of Physics 12 045001 URL http://stacks.iop.org/1367-2630/12/i=4/a=045001
- (7) Szwer D J, Webster S C, Steane A M and Lucas D M 2011 Journal of Physics B: Atomic, Molecular and Optical Physics 44 025501 URL http://stacks.iop.org/0953-4075/44/i=2/a=025501
- (8) Du J, Rong X, Zhao N, Wang Y, Yang J and Liu R B 2009 Nature 461 1265–1268 ISSN 1476-4687 URL http://dx.doi.org/10.1038/nature08470
- (9) Ajoy A, Alvarez G A and Suter D 2011 Physical Review A 83 032303 ISSN 1094-1622 URL http://dx.doi.org/10.1103/PhysRevA.83.032303
- (10) Jenista E R, Stokes A M, Branca R T and Warren W S 2009 J. Chem. Phys. 131 204510
- (11) Stokes A M, Feng Y, Mitropoulos T and Warren W S 2012 Magn. Reson. Med. 69 1044–1055 ISSN 0740-3194 URL http://dx.doi.org/10.1002/mrm.24340
- (12) Mitchell M D, Kundel H, Axel L and Joseoph R 1986 Magnetic Resonance Imaging 4 263–266 URL http://www.ncbi.nlm.nih.gov/pubmed/3669940
- (13) Portakal G Z, Shermer S, Spezi E, Perrett T, Tuncel N and Phillips J 2016 ArXiv e-prints (Preprint eprint 1608.08542)
- (14) Cywiński , Lutchyn R M, Nave C P and Das Sarma S 2008 Physical Review B 77 174509 ISSN 1550-235X URL http://dx.doi.org/10.1103/PhysRevB.77.174509
- (15) de Lange G, Wang Z H, Riste D, Dobrovitski V V and Hanson R 2010 Science 330 60–63 ISSN 1095-9203 URL http://dx.doi.org/10.1126/science.1192739
- (16) Biercuk M J, Uys H, VanDevender A P, Shiga N, Itano W M and Bollinger J J 2009 Nature 458 996–1000
- (17) Pasini S and Uhrig G S 2010 Physical Review A 81 012309 ISSN 1094-1622 URL http://dx.doi.org/10.1103/PhysRevA.81.012309
- (18) Relaño A, Gómez J M G, Molina R A, Retamosa J and Faleiro E 2002 Physical Review Letters 89 ISSN 1079-7114 URL http://dx.doi.org/10.1103/PhysRevLett.89.244102
- (19) Scheffler K 1999 Concepts in Magnetic Resonance 11 291–304 ISSN 1099-0534 URL http://dx.doi.org/10.1002/(SICI)1099-0534(1999)11:5<291::AID-CMR2>3.0.CO;2-J
- (20) 2004 Handbook of {MRI} Pulse Sequences ed BERNSTEIN M A, KING K F and ZHOU X J (Burlington: Academic Press) pp iv – ISBN 978-0-12-092861-3 URL http://www.sciencedirect.com/science/article/pii/B9780120928613500303
- (21) Lebel R M and Wilman A H 2010 Magn. Reson. Med. 64 1005–1014
- (22) Petrovic A, Scheurer E and Stollberger R 2015 Magnetic Resonance in Medicine 73 818–827 ISSN 1522-2594 URL http://dx.doi.org/10.1002/mrm.25170
- (23) Poon C S and Henkelman R M 1992 Journal of Magnetic Resonance Imaging 2 541–553 ISSN 1522-2586 URL http://dx.doi.org/10.1002/jmri.1880020512
- (24) Hennig J and Scheffler K 2001 Magnetic Resonance in Medicine 46 6–12 ISSN 1522-2594 URL http://dx.doi.org/10.1002/mrm.1153
Appendix A fits for CPMGn and UDDn for all samples


