A complex network analysis of ethnic conflicts and human rights violations
Abstract
News reports in media contain records of a wide range of socio-economic and political events in time. Using a publicly available, large digital database of news records, and aggregating them over time, we study the network of ethnic conflicts and human rights violations. Complex network analyses of the events and the involved actors provide important insights on the engaging actors, groups, establishments and sometimes nations, pointing at their long range effect over space and time. We find power law decays in distributions of actor mentions, co-actor mentions and degrees and dominance of influential actors and groups. Most influential actors or groups form a giant connected component which grows in time, and is expected to encompass all actors globally in the long run. We demonstrate how targeted removal of actors may help stop spreading unruly events. We study the cause-effect relation between types of events, and our quantitative analysis confirm that ethnic conflicts lead to human rights violations, while it does not support the converse.
I Introduction
The quantitative analyses of the gigantic amount of data associated with human social conditions have gained much momenta in the recent years, especially through the multidisciplinary tools and approaches. The traditional theories of social science together with complex network analysis newman2006structure ; Albert:2002 ; barabasi2016network and addition of new tools and paradigms from several science disciplines like theoretical physics, applied mathematics, computer science, as well as psychology, have developed into what is presently known as computational social science lazer09 and have helped uncover new patterns of social behavior, including social dynamics Castellano:2009 ; Sen:2013 . Data made available digitally, has drawn attention of researchers across disciplines who have collaborated and contributed in their own ways to scientifically analyze and understand complex social phenomena in the recent years, previously not known to the present scale of detail.
Social behavior, conditions, events, organizations, which have given shape to the history of human civilization, have often been positive or constructive – building societies, shaping cultures, and at other times negative or destructive – conflicts, wars and battles followed by reorganization of countries or nations. Human civilization has evolved in a complicated manner and created a variety in ethnic characters and cultures, in languages, beliefs and customs. It is widely understood toft2005geography that historically, certain groups pay priority to their linguistic, cultural, racial, and religious ties of individuals within the groups, which are then passed down through generations. Ethnic violence arises when groups attempt to maintain their boundaries against pressure from historical enemies. In another possible scenario, when the authority of a multi-ethnic state declines, the central regime ceases to protect the interests of ethnic groups, creating a void in which ethnic groups start competing to establish and control a new regime that will protect their interests. Socio-political tension in such a situation is likely to incite violence.
Ethnic heterogeneity is a characteristic feature observed in most countries and regions worldwide. With time, these variations often reduce locally, where socio-economic and political forces are less dominant in favor of ethnic mixing. However, the course of political history along with that of religion and culture often encounters conflicts at various scales. Ethnic conflicts are comparatively frequent in certain regions and rare elsewhere. Ethnic heterogeneity does not necessarily breed war and its absence does not ensure peace. Even today, ethnic wars continue to be globally the most common form of armed conflicts, but the mechanisms that lead a society down the path of ethnic conflict are yet to be fully understood. What is intriguing, is the connection between democratization and the occurrence of ethnic conflict. While stable democracies are unlikely to wage war with other democracies, a country that is socio-politically unstable may very well find conflicts between groups with opposing interests vorrath2007linking . Human rights are internationally agreed values, standards or rules regulating the conduct of states towards their own citizens and towards non-citizens. Interestingly, the violation of human rights appears to be more associated with ethnic conflicts than abuses of economic and social rights thoms2007human . Other political, economic and social preconditions may also influence the causes of ethnic conflicts, and the conscious promotion by the political actors of any polarizing dimension based on these factors is sufficient to lead to conflict. It is often seen that changes in political regime can lead to conflicts which are often ethnic in various parts of the world, sparking human rights violations. Therefore, spatio-temporal analyses of regional conflict formations and political dynamics, and the statistical studies of the different variables are important.
Temporal data of events like human to human communications and physical contacts/proximity has been studied in recent years (see e.g., Holme and Saramäki holme2013temporal ) in connection to study of epidemics and contagion, spreading of information using mobile phone communication data onnela2007structure as well as data from proximity sensors carried by human entities cattuto2010dynamics .
Here we provide a quantitative analysis of the scale and topology of ethnic tensions, related conflicts and violations of human rights, using the reports in digital media. We look at data from a publicly accessible database, which keeps account of events from news available in media. We particularly focus on ethnic conflicts (EC) and human rights violations (HR) by suitably filtering keywords present in the digital text transcript of the news. With the availability of high precision data containing precise spatio-temporal information, one can look towards finding correlations between events, involved actors (individuals, groups, organizations or states), the geographical pattern of spreading of conflicts etc. Although there have been studies on conflicts, wars and terror attacks richardson1960statistics ; clauset2007frequency ; becerra2012natural ; chatterjee2017fat , and speculation of ethnic conflicts using census data for segregated population lim2007global , a comprehensive study of the actors involved in ethnic conflicts and human rights violation has been lacking. In this work, for the first time, we provide a quantitative and qualitative understanding of the relative activity of the actors, frequently engaging actor pairs, the network of actors, and give insights into the static and dynamical aspects of the actor network in a scenario involving ethnic conflicts and human rights violations.
II Results
GDELT Event Database GDELT contains the database of news articles from all over the world in several languages. Using a query, it is possible to extract data for events, about ethnic conflicts (EC) and human rights violations (HR) happening around the world, spanning over a large time scale. Each event data contains information such as the pair of actors involved, a unique time stamp, names of individuals, organizations or groups, the location information of the event, as well as latitude, longitude data of actors and the event. The news event and subsequently the data serves as a proxy for the actual event and its intensity (in terms of number of reports). Although we do not analyze the actual news reports, we consider a report on EC to be an actual instance of ethnic conflict or its possibility, and similarly for HR. We analyzed events of EC and of HR for a 15 year period (2001-2015).
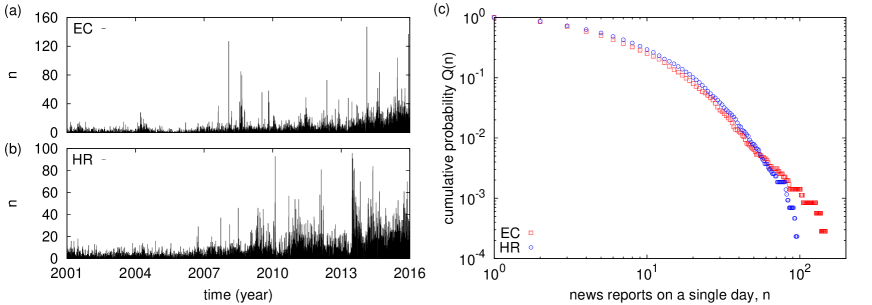
The number of news entries per day is a stochastic variable, and often there is a burst of activity noted (Fig. 1a,b). The amount of data cataloged is also observed to have increased since the late 2000’s. The number of news entries/ reports on a single day has a broad distribution due to the large inter-day fluctuations in the number of reports and bursty nature of the data. Fig 1c shows the complementary cumulative distribution function (CCDF) that a day has more than news reports, . For EC, the distribution has a short lognormal body with a rather prominent power law tail (decay exponent close to ); for HR, the bulk of the distribution fits to a stretched exponential ( with and ) The details of the database, data extraction and different attributes are described in Supplementary Information. In our study, we focus on a relatively recent time span (2001-2015) and extract the data for actor pairs and geographical location of events from the database.
II.1 Static properties of the network
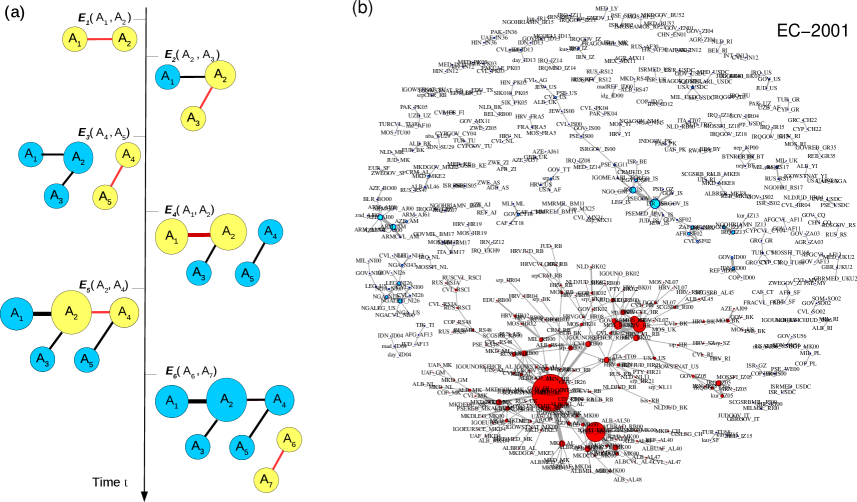
We construct the aggregate network over a given period of time, for the entire 15 year period (2001-2015) as well as for each of the 15 individual years, for the two datasets. Each event is visualized as a link between the actors involved, which are the nodes, thus creating a network of actors connected by events. The details of the construction is given in the Methods section. A schematic representation of the network construction is given in Fig. 2a and a typical network is shown in Fig. 2b for EC data aggregated over the year 2001.
In our study, the temporal granularity of the data is one day. We extracted (i) the number of mentions of each individual actor and (ii) the number of co-mentions of an unique pair of actors (actor pair mentions), as well as the number of unique actors , one actor is involved with. In terms of the network, measures node strength, the link weight and the degree of a node. While and measure the importance, activity or visibility of a single actor, measures the involvement of an actor pair in inciting an event. These quantities are measured for each year for the 15 year period (2001-2015) as well as through the whole period (aggregate over 15 years).
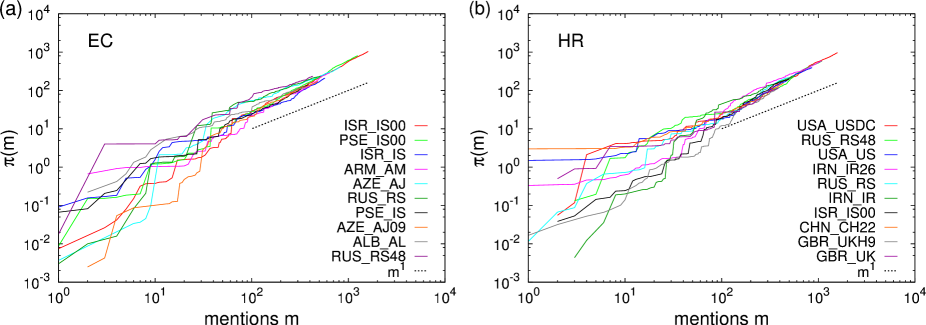
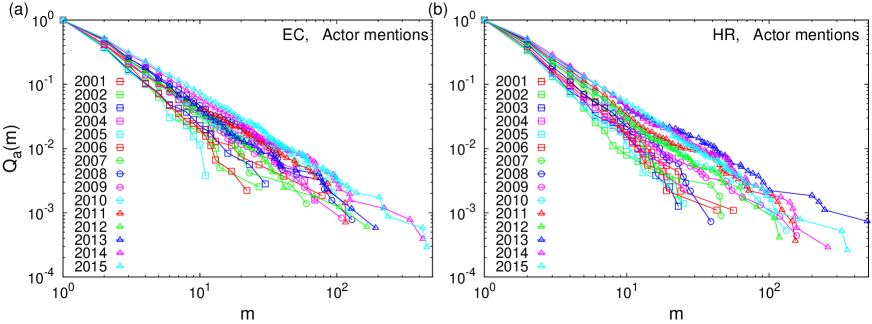
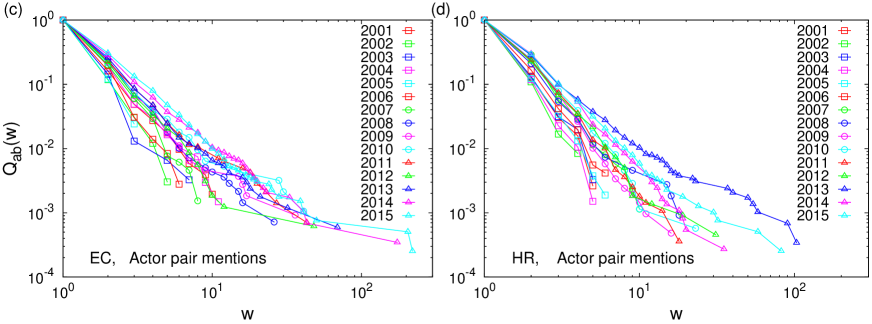
It is often perceived that certain actors frequently engage in reported events than others and the same is true for pairs of actors engaging in ethnic conflicts or human rights violations. We computed the complementary cumulative probability distribution (CCDF) for different quantities for the aggregated network in (refer to Fig. 3a,b,c).
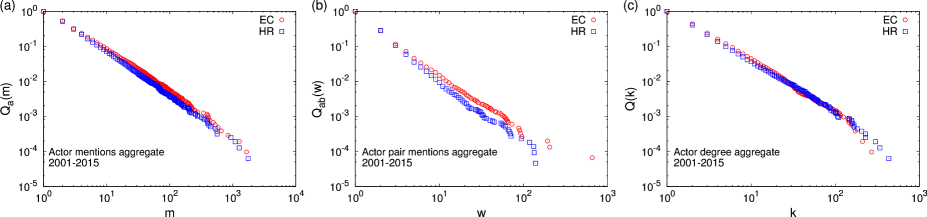
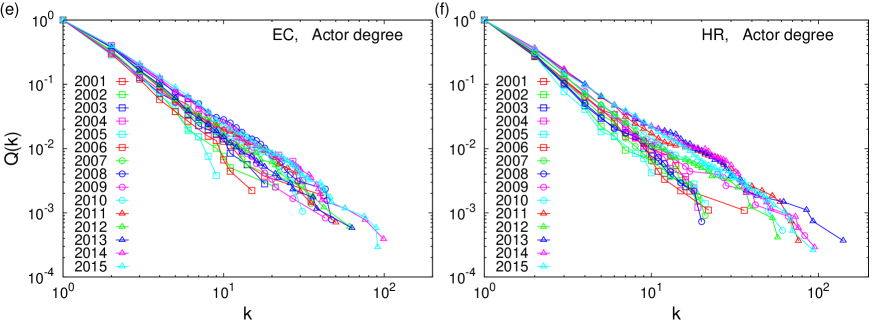
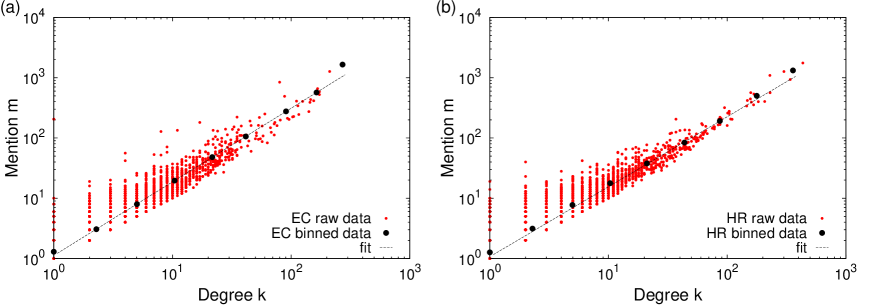
For the actor mentions, the probability that an actor is mentioned times or more fits to a power law for the largest values, , with decay exponents for EC and for HR. The exponents are computed, along with the values of the standard errors (uncertainties) and significances, using Maximum Likelihood Estimates Clauset:2009 . The probability that an actor pair is mentioned times or more fits well to power laws with exponents as for EC and for HR data. The actor mentions and actor pair mentions are respectively the node weights and edge weights in network terminology. The probability that an actor was involved with or more actors during the time span (degree of the actor) fit well to power laws with exponents as for EC and for HR data. For the individual years, due to less aggregation, the counts are less and data naturally seems noisy. However, the data still seem to exhibit the power law tail in the probability distributions (see Supplementary Fig. S7). The fitting exponents for the individual years are given in Supplementary Table S1. The correlation between actor degree and mentions, as well as the relationship between the power law exponents and are shown in Supplementary Fig. S8.
The above results quantitatively characterize the heterogeneity in the activity of actors, while most actors are relatively less active: the power law distributions for actor mentions indicate that there are a significant few who constantly engage in ethnic conflicts and human rights violations issues. The power law distributions in actor pair mentions indicate similar characteristic for pairs of actors. The broad degree distributions are indicative of the fact that the number of actors engaging with very large number of actors are also significant.
II.2 Clusters
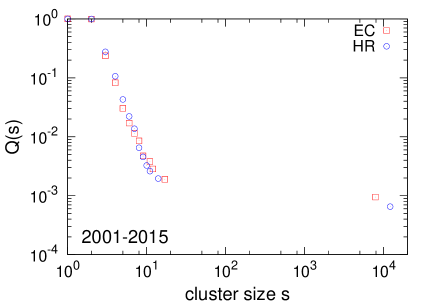
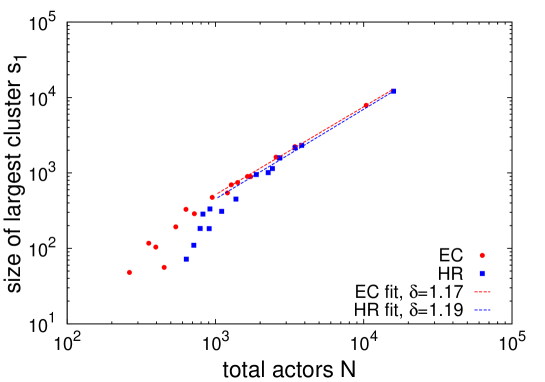
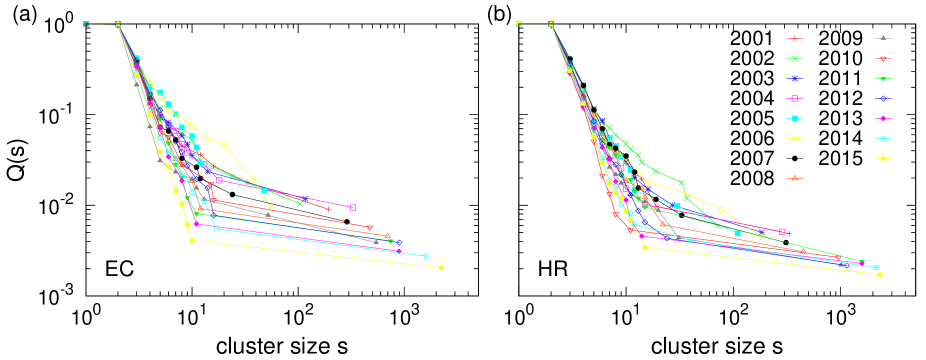
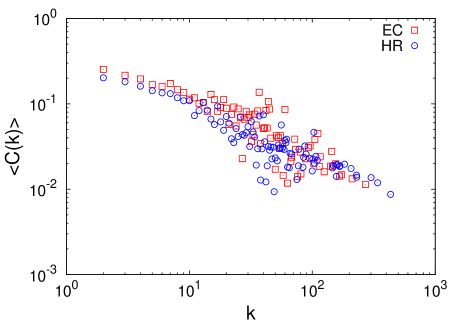
The aggregated network is found to be composed of several disconnected components or ‘clusters’. Physically this means that the actors constituting one cluster have never been involved with any actor from a different cluster. For both sets, the largest connected component is times the smaller clusters, which are large in number (see Supplementary Table. S2). In fact, the largest cluster grows superlinearly with the size of the network , as we found (from the data in Supplementary Table. S2), , with for EC and for HR (Supplementary Fig. S9). This tells us that the fraction of nodes in the largest cluster grows with the total size of the network quite fast so that eventually the fraction of nodes outside the largest cluster will be negligible. We computed the CCDF of cluster size and find that it roughly has a power law decay for components except the largest one, with a decay exponent roughly close to 3 (see Fig. 4). The CCDF for individual years has been shown in Supplementary Fig. S10. The largest clusters in both sets have a slowly decaying clustering coefficient with degree (see Supplementary Fig. S11).
II.3 Network growth properties
In order to explore the dynamics of the process that leads to the broad distribution of the mentions and degrees, we investigate the dynamics of growth for these quantities over the span of 15 years (2001-2015). For good statistics, we ranked the actors according to the number of mentions and degrees, and analyzed the data for the top 10 actors.
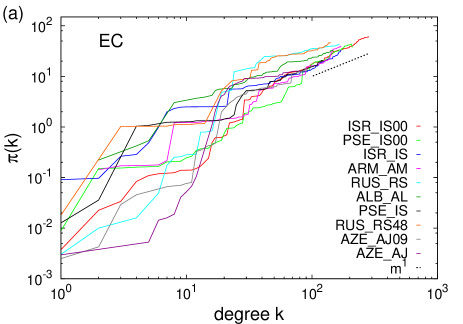
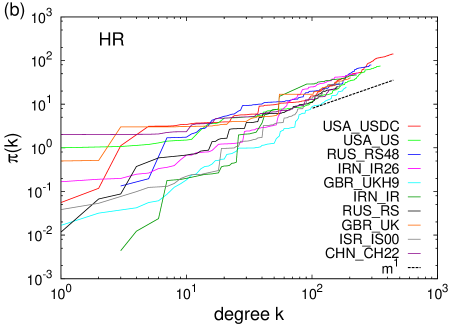
We first measured the growth of the degrees and mentions for the top 10 actors of EC and HR data, with respect to the time when they were first mentioned. The long time behavior (asymptotic) indicates a growth law of with .
To extract the rate of growth for a quantity , we computed . in real data turns out to be very noisy, so we computed the cumulative integral which turns out to be less noisy. We observe that data for degree has a shorter span and is noisier than that for mentions . The plots suggest that both and are superlinear functions of their respective arguments, i.e., with (see Fig. 5 for mentions and Supplementary Fig. S12 for degree). Thus the asymptotic growth rate is still weakly dependent on the respective arguments. We thus identify that the growth rate of the system (network) is not independent of the size of the node (degree or mentions). The growth exponents are computed using Maximum Likelihood Estimates Clauset:2009 and tabulated in Supplementary Table. S4. A superlinear growth rate implies that the network will, in the long run, consist of a very large ‘condensate’ with a small fraction of nodes in isolated smaller clusters, which is consistent with our analysis of the cluster size distribution.
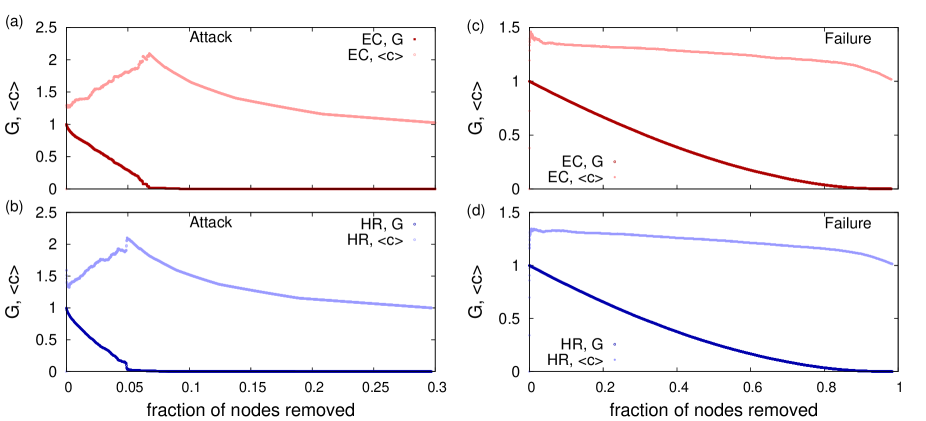
II.4 Tolerance to attack and failure
We also study how the network breaks down under attack, in order to investigate the possibility of preventing unruly events to spread albert2000error . The largest connected component of the network is subjected to targeted attack by removal of the most connected nodes. We start by removing the node with the highest degree, followed by the next highest and so on. This results in rapid fragmentation or destruction of the network. We compute the fraction of nodes present in the largest cluster, which is observed to decrease very quickly (Fig. 6a). In fact, the network of actors can be destroyed by targeted attack just by removing much less than 10% of the nodes compared to when randomly selected nodes are removed (random failure) one after another (Fig. 6b). This exercise indicates that targeted intervention may help stop spreading of ethnic conflicts and human rights violations.
II.5 Measuring causality
Considering that we have time series data for the number of mentions of ethnic conflicts and human rights violations from news articles it would be interesting to study if there is a clear cause and effect relation between these events with time. To determine the causal effect purely from the observations of the past data, we apply Granger Causality granger1969investigating which estimates the causal relationship by observing the changes in the distribution of the variables over time.
Let us consider two random variables depicting counts of EC and HR. To say that EC causes HR, Granger causality computes a regression of variable HR on the past values of itself and the past values of EC and then tests the significance of coefficient estimates associated with EC. We consider a bivariate linear autoregressive model on EC and HR, and assume the L.H.S. to be dependent on the history of EC and HR,
where is the maximum number of lagged observations (for both EC and HR). The coefficients , are the contributions of each lagged observation to the predicted value of and respectively and is the prediction error.
We set up a null hypothesis and to test the significance of the coefficients, compute the value. If the -value is less than , one can reject the null hypothesis. We tested the counts for year wise as well as month wise mentions. Comparing the values for both cases, we found that: (a) one cannot conclude that HR causes EC, but (b) EC causes HR. Hence, we can confirm that ethnic conflicts cause human rights violations, while human rights violations are not responsible for ethnic conflicts. The details of the analysis are provided in the Supplementary Information.
III Discussions
News reports serve as a reasonable proxy for the importance and intensity of events. The intensity is reflected by the number of reports and lingering span of time through which the reports follow. Our study focuses on events that pointed at ethnic conflicts and human rights violations. The GDELT data is unique in the sense that it records events and actors involved in them. The U.S. government had recently funded in a large-scale project, the Integrated Conflict Early Warning System (ICEWS) Ward2013 , which makes use of quantitative data and statistical methods in order to forecast events of political instability, which include international and domestic crises, ethnic and religious violence, rebellion and insurgency. We have chosen the GDELT data instead of the ICEWS data to get a more global perspective Arva2013 ; leetaru2013gdelt . The frequencies of mentions of actors and their co-mentions with others can be treated well as proxies for their importance and influence, as well as involvement with others. The aggregate data enables us to construct a network of actors, and even finding disconnected groups. In fact, our study reveals that most events are disconnected in very small clusters while very large clusters of frequently engaging actors exist. One can study the geographical localization of events and clusters to procure detailed information regarding the context, intensity and growth pattern of events futurework . Identifying important groups of actors, in terms of their intensities of activities, is important for possible intervention that may prevent the spread of such events. The probability distributions of actor mentions, co-actor mentions and the degree of an actor have power law tails for the largest values, indicating a strong self-organizing principle behind the events. The growth properties of individual actor nodes indicate that in the long run, very small fraction of disconnected clusters are left, while most of the actors belong to a giant connected component. The data on ethnic conflicts and human rights violations are found to be strikingly similar in terms of static and dynamic properties of the network, and even in terms of network stability against failure as well as targeted attack. This may point at a very high degree of correlation between events. In fact, using a causality analysis, we could quantitatively conclude that ethnic conflicts lead to human rights violations, while the reverse may not be true. These networks of ethnic conflicts and human rights violations reflect the negative aspects of human behavior and cooperation, and are certainly different from other social networks (friendship, collaboration, etc.) in the sense that there are not many triangles or closed communities, as observed in the distribution of the average clustering coefficient with degree of the actors. This detailed scientific study of the network structure, dynamics, function and resilience may help policy makers, specifically in cases where there is a need for preventing the spread of ethnic tensions and conflicts. There are possibilities of similar analyses using data from online social media, e.g., Twitter, etc.
We have deliberately avoided mentioning the real names and other details because the main aim of the paper was to study the network properties and statistical regularities. Since we have just considered the reports as a proxy for the events and not studied the reports in details to extract further information, it would not be proper to draw any conclusions about the actors, the network relations or the detailed explanations/causes behind the conflicts or the violations. Certainly, it would be interesting to address such sociological explanations, implications and policies in the future. Specific studies on the geographical implications of actor networks, the geographical and socio-cultural influence of their robustness under possible intervention will be important issues to study.
Methods
Data acquisition and filtering
GDELT Event Database GDELT contains the database of news articles from around the world in several languages, hosted through Google Cloud. Using Google BigQuery GDELTcloud , it is possible to extract data for each event, having an unique time stamp, and providing the data about news about ethnic conflicts (EC) and human rights violations (HR) happening around the world spanning over a large time scale. The data contains information about a pair of actors involved, the location information of the event, as well as latitude, longitude data of actors and the event. We procured events for EC and for HR for a 15 year period, 2001-2015. We filtered out those data for which both actors were mentioned, along with their respective location information. The GDELT data has a huge fraction of missing entries. We have filtered out and excluded those data rows, which have at least one entry missing corresponding to the attributes we were interested in. Hence, after cleaning, we analyzed events of EC and of HR. Details of the Cameo codes used for filtering the data (along with examples from the CAMEO codebook GDELTcodebook ), data attributes and cleaning are provided in Supplementary Information.
Network construction
Given a period of time , we construct the network of ‘connected’ actors in the following way: any two actors and mentioned together in an event reported at time are ‘connected’ by a link of unit weight,where is the beginning of an interval of time span . If another event within the same time window involves actors and , then is connected to with a link of unit weight. Thus and are both connected to (see Fig. 2a). Aggregating all such events over the time window , connected components emerge, with link weights increasing if the same pair of actors linking them appear in multiple events (actor pair mentions). These connected components form a complex network of nodes (actors) and links (actor pair mentions). An actor may be co-mentioned with several other actors and thus have a larger ‘degree’, measured by the number of distinct co-actors it has. In principle, the network aggregated over a time period can have several disconnected components or ‘clusters’. Fig. 2b shows the aggregated network for one year for actors mentioned in the EC dataset.
Acknowledgements.
The authors thank L. Dey for useful comments.Supplementary Information
Data Description
The data source for this quantitative analysis on the global structure of ethnic violence is GDELT, the Global Database of Events, Language, and Tone GDELT . It is described leetaru2013gdelt as “an initiative to construct a catalog of human societal-scale behavior and beliefs across all countries of the world, connecting every person, organization, location, count, theme, news source, and event across the planet into a single massive network that captures what’s happening around the world, what its context is and who’s involved, and how the world is feeling about it, every single day”.
GDELT contains data since 1979 stuster2013mapped . However, the data from the year 2000 onwards is more comprehensive, reflecting the increase in the number of news media and the frequency of event recording. The entire GDELT dataset is available as a public dataset in Google Big Query GDELTcloud . GDELT event records are stored in an expanded version of the dyadic CAMEO format, capturing two actors and the action performed by Actor1 upon Actor2. A wide array of variables break out the raw CAMEO actor codes into their respective fields to make it easier to interact with the data, the Action codes are broken down into a hierarchical structure, a score describing the intensity of conflict or cooperation is provided, an average tone score is provided for all coverage of the event, several indicators of “importance” based on media attention are provided, and an unique array of geo-referencing fields offer estimated landmark-centroid-level geographic positioning of both actors and the location of the action.
However, for the purpose of this quantitative analysis we have extracted the data for the cameo codes 203 (engage in ethnic cleansing) for Ethnic Conflicts (EC) and 092 (investigate human rights abuses), 1122 (accuse of human rights abuses) for Human Rights Violations (HR) from the years 2001 to 2015.
As mentioned in the CAMEO codebook GDELTcodebook , for the corresponding entries, we reproduce below the cited examples:
-
•
Cameo code 203 for EC: Serb forces were engaged in ethnic cleansing in Kosovo against the majority Albanian population of the province, according to the US government.
-
•
Cameo code 092 for HR: Israel’s high court opened a landmark hearing Wednesday into the legality of secret interrogation techniques used against Palestinian detainees.
-
•
Cameo code 1122 for HR: Human rights watchdog Amnesty International accused the United States of violating human rights, ignoring international law and sending a “permissive signal to abusive governments”.
Each data entry with a GLobalEventID had the following attributes GDELTcodebook :
-
•
Actor1Code, Actor2Code: The complete raw CAMEO code for Actor1 and Actor2 (includes geographic, class, ethnic, religious, and type classes). It may be blank if the system was unable to identify any actor.
-
•
Actor1Name, Actor2Name: The actual name of the Actor1 and Actor2. In the case of a political leader or organization, this will be the leader’s formal name (e.g., GEORGE W BUSH, UNITED NATIONS), for a geographic match it will be either the country or capital/major city name (e.g., UNITED STATES / PARIS), and for ethnic, religious, and type matches it will reflect the root match class (e.g., KURD, CATHOLIC, POLICE OFFICER, etc). It may be blank if the system was unable to identify an actor.
-
•
Actor1Geo_ADM1Code, Actor2Geo_ADM2Code: This is the 2-character FIPS10-4 country code followed by the 2-character FIPS10-4 administrative division 1 (ADM1) code for the administrative division housing the landmark.
-
•
ActionGeo_FullName: Location of Event. This is the full human-readable name of the matched location.
-
•
ActionGeo_CountryCode: Location of Event. This is the 2-character FIPS10-4 country code for the location.
-
•
ActionGeo_ADM1Code: Location of Event. This is the 2-character FIPS10-4 country code followed by the 2-character FIPS10-4 administrative division 1 (ADM1) code for the administrative division housing the landmark.
-
•
ActionGeo_Lat, ActionGeo_Long: This is the centroid latitude and longitude of the landmark for mapping.
-
•
SQLDATE: Date the event took place in YYYYMMDD format.
There may be actors with similar ActorCode at different locations. So, for uniquely identifying each actor we have concatenated Actor1Code with Actor1Geo_ADM1Code and Actor2Code with Actor2Geo_ADM2Code. The data acquired from queries had to further cleaned for missing entries. Each event entry mentions a pair of unique actors, but we also found rare instances () where only one actor has been identified. Any row of data with missing actor names, actor codes or location data were removed to created the working data set. The number of events were for EC and for HR and this was reduced to for EC and for HR after filtering. On actual inspection of the data, we found that a very small fraction of entries do not actually report an actual case of ethnic conflict or human rights violations, yet contain the relevant keywords that dicusss the issues in a positive tone (e.g. absence of ethnic violence or human right violations etc.).
The structure of the network
| Year | Actor pair mention | Actor mention | Actor degree | |||
| EC | HR | EC | HR | EC | HR | |
| 2001 | 2.61 0.07 | 3.47 0.35 | 1.56 0.05 | 1.79 0.04 | 2.13 0.05 | 2.01 0.06 |
| 2002 | 3.47 0.23 | 3.55 0.22 | 1.90 0.06 | 2.06 0.07 | 2.44 0.07 | 2.16 0.09 |
| 2003 | 3.04 0.37 | 3.32 0.35 | 1.71 0.03 | 2.03 0.07 | 2.01 0.05 | 2.15 0.04 |
| 2004 | 2.53 0.11 | 3.81 0.39 | 1.42 0.02 | 1.90 0.04 | 1.66 0.04 | 2.06 0.03 |
| 2005 | 3.35 0.24 | 3.48 0.18 | 2.15 0.11 | 2.08 0.05 | 2.29 0.15 | 2.16 0.10 |
| 2006 | 3.25 0.20 | 3.14 0.17 | 2.15 0.07 | 1.99 0.08 | 2.24 0.09 | 2.30 0.07 |
| 2007 | 3.04 0.18 | 3.04 0.14 | 1.64 0.04 | 1.86 0.07 | 1.85 0.05 | 2.25 0.05 |
| 2008 | 2.27 0.07 | 2.28 0.13 | 1.43 0.03 | 1.74 0.04 | 1.69 0.03 | 2.11 0.05 |
| 2009 | 2.07 0.17 | 2.97 0.09 | 1.50 0.02 | 1.54 0.03 | 1.93 0.04 | 1.69 0.05 |
| 2010 | 1.47 0.10 | 2.61 0.15 | 1.30 0.03 | 1.49 0.02 | 1.71 0.03 | 1.62 0.04 |
| 2011 | 1.67 0.07 | 2.81 0.07 | 1.32 0.01 | 1.38 0.03 | 1.62 0.04 | 1.56 0.03 |
| 2012 | 2.86 0.13 | 2.60 0.13 | 1.54 0.02 | 1.52 0.02 | 1.80 0.03 | 1.72 0.04 |
| 2013 | 1.92 0.07 | 1.41 0.05 | 1.40 0.02 | 1.21 0.02 | 1.86 0.02 | 1.57 0.02 |
| 2014 | 1.83 0.04 | 2.48 0.05 | 1.29 0.01 | 1.37 0.01 | 1.69 0.02 | 1.60 0.03 |
| 2015 | 1.82 0.06 | 2.06 0.07 | 1.31 0.01 | 1.45 0.01 | 1.68 0.02 | 1.64 0.01 |
| 2001-2015 | 1.58 0.01 | 1.74 0.03 | 1.23 0.01 | 1.28 0.01 | 1.52 0.01 | 1.48 0.01 |
Clusters
| Year | EC | HR | |||||
| Total nodes |
|
Total nodes |
|
||||
| 2001 | 540 | 193 | 917 | 333 | |||
| 2002 | 396 | 104 | 636 | 72 | |||
| 2003 | 355 | 117 | 788 | 184 | |||
| 2004 | 633 | 329 | 823 | 285 | |||
| 2005 | 263 | 48 | 714 | 110 | |||
| 2006 | 451 | 56 | 907 | 183 | |||
| 2007 | 721 | 288 | 1,102 | 309 | |||
| 2008 | 1,279 | 696 | 1,375 | 451 | |||
| 2009 | 1,204 | 544 | 2,267 | 1,011 | |||
| 2010 | 951 | 474 | 1,887 | 954 | |||
| 2011 | 1,412 | 746 | 2,719 | 1,591 | |||
| 2012 | 1,644 | 899 | 2,423 | 1,142 | |||
| 2013 | 1,728 | 892 | 2,707 | 1,576 | |||
| 2014 | 2,560 | 1,620 | 3,447 | 2,152 | |||
| 2015 | 3,432 | 2,229 | 3,816 | 2,322 | |||
| 2001-2015 | 10,394 | 7,875 | 15,899 | 12,106 | |||
The size of the largest cluster is computed as the maximum number of nodes in the giant component or largest subgraph and shown in Supplementary Table. S2 and the variation of with the size of the entire network is shown in Fig. S3, and the asymptotic fit is found to be . The degree distribution of the largest cluster / giant component has a power law tail. The power law exponents for the asymptotic fits are given in Supplementary Table. S3.
| Year | EC | HR |
| 2001 | 1.99 0.06 | 1.71 0.07 |
| 2002 | 1.84 0.08 | 1.65 0.05 |
| 2003 | 1.84 0.08 | 1.56 0.05 |
| 2004 | 1.58 0.05 | 1.83 0.06 |
| 2005 | 1.75 0.29 | 1.48 0.09 |
| 2006 | 1.50 0.05 | 1.97 0.08 |
| 2007 | 1.71 0.06 | 1.84 0.04 |
| 2008 | 1.64 0.04 | 1.81 0.08 |
| 2009 | 1.88 0.05 | 1.56 0.04 |
| 2010 | 1.62 0.04 | 1.49 0.03 |
| 2011 | 1.50 0.03 | 1.41 0.04 |
| 2012 | 1.75 0.03 | 1.60 0.04 |
| 2013 | 1.83 0.02 | 1.53 0.02 |
| 2014 | 1.67 0.03 | 1.57 0.04 |
| 2015 | 1.69 0.02 | 1.60 0.01 |
| 2001-2015 | 1.51 0.01 | 1.48 0.01 |
Biggest cluster: clustering coefficient
To find the cohesion of ethnic conflict and human rights violation, we computed the clustering coefficient of both (5 years aggregated) networks, which shows the extents to which the nodes of a network are closely connected with one another. The clustering coefficient for a node in an undirected graph is computed as: , where is the degree of the node , and is the number of links between the neighbors of . We plot the average clustering coefficient of a node with degree in Fig. S5, and find that higher degree nodes are less clustered compared to low degree nodes.
Dynamics of network growth
| EC | HR | ||||
|---|---|---|---|---|---|
| Actor | Degree | Mention | Actor | Degree | Mention |
| ALB_AL | 0.86 0.01 | 1.04 0.01 | CHN_CH22 | 0.71 0.02 | 1.11 0.01 |
| ARM_AM | 1.55 0.02 | 1.51 0.01 | GBR_UK | 1.11 0.02 | 1.33 0.01 |
| AZE_AJ | 0.50 0.02 | 0.96 0.01 | GBR_UKH9 | 1.68 0.02 | 1.79 0.01 |
| AZE_AJ09 | 0.96 0.04 | 1.28 0.01 | IRN_IR | 0.57 0.01 | 1.10 0.01 |
| ISR_IS | 0.89 0.02 | 1.23 0.01 | IRN_IR26 | 1.58 0.03 | 1.47 0.01 |
| ISR_IS00 | 1.26 0.01 | 1.38 0.01 | ISR_IS00 | 1.86 0.02 | 1.71 0.01 |
| PSE_IS | 1.05 0.02 | 1.31 0.01 | RUS_RS | 1.27 0.02 | 1.41 0.01 |
| PSE_IS00 | 1.82 0.02 | 1.40 0.01 | RUS_RS48 | 1.04 0.02 | 1.22 0.01 |
| RUS_RS | 0.47 0.01 | 0.92 0.01 | USA_US | 1.33 0.02 | 1.40 0.01 |
| RUS_RS48 | 0.53 0.02 | 0.79 0.01 | USA_USDC | 1.29 0.01 | 1.35 0.01 |
Measuring causality
Let us consider the two random variables depicting counts of EC (Ethnic Conflicts mentions) and HR (Human Rights Violation mentions). To say that EC causes HR, Granger causality granger1969investigating computes a regression of variable HR on the past values of itself and the past values of EC and then tests the significance of coefficient estimates associated with EC.
We consider a bivariate linear autoregressive model on EC and HR, and assume the L.H.S. to be dependent on the history of EC and HR,
| (1) |
where is the maximum number of lagged observations (for both EC and HR). The coefficients , are the contributions of each lagged observation to the predicted value of and respectively while is the prediction error.
If , we call it a null hypothesis which implies that EC does not cause HR. In other words the coefficients of EC are not significant enough to cause HR. But if the null hypothesis gets rejected we say that the coefficients of EC are significant enough to cause HR.
For testing this significance of the coefficients, we compute the -value. If the -value is less that one can reject the null hypothesis, and hence conclude that EC causes HR (HR EC).
Applying the above process on the EC and HR year wise mentions, we found that:
-
•
On testing for , we find , and the null hypothesis cannot be rejected. Hence, one cannot conclude that HR causes EC.
-
•
On testing for , we find , and the null hypothesis can be rejected. Hence, we can say that EC causes HR.
Applying the above process on the EC and HR month wise mentions, we found that:
-
•
On testing for , we find and thus the null hypothesis cannot be rejected. Hence, we cannot say that HR causes EC.
-
•
On testing for , we find , and thus the null hypothesis can be rejected. Hence, we can say that EC causes HR.
Hence, we can definitely conclude from the above quantitative analysis that Ethnic conflicts cause Human Rights violations.
References
- (1) M. E. J. Newman, A.-L. Barabási, and D. J. Watts. The structure and dynamics of networks. Princeton Univ. Press, Princeton, 2006.
- (2) R. Albert and A.-L. Barabási. Statistical mechanics of complex networks. Rev. Mod. Phys., 74(1):47–97, 2002.
- (3) A.-L. Barabási. Network Science. Cambridge Univ. Press, Cambridge, 2016.
- (4) D. Lazer, A. Pentland, L. Adamic, S. Aral, A.-L. Barabási, D. Brewer, N. Christakis, N. Contractor, J. Fowler, M. Gutmann, T. Jebara, G. King, M. Macy, D. Roy, and M. Van Alstyne. Computational social science. Science, 323(5915):721–723, 2009.
- (5) C. Castellano, S. Fortunato, and V. Loreto. Statistical physics of social dynamics. Rev. Mod. Phys., 81:591–646, May 2009.
- (6) P. Sen and B. K. Chakrabarti. Sociophysics: An Introduction. Oxford University Press, Oxford, 2013.
- (7) M. D. Toft. The geography of ethnic violence: Identity, interests, and the indivisibility of territory. Princeton Univ. Press, Princeton, 2005.
- (8) J. Vorrath, L. F. Krebs, and D. Senn. Linking ethnic conflict & democratization: An assessment of four troubled regions. National Center of Competence in Research, Challenges to Democracy in the 21st Century, Working Paper, (6), 2007.
- (9) O. N. T. Thoms and J. Ron. Do human rights violations cause internal conflict? Human Rights Quarterly, pages 674–705, 2007.
- (10) P Holme and J Saramäki, editors. Temporal networks. Springer, 2013.
- (11) J.-P. Onnela, J. Saramäki, J. Hyvönen, G. Szabó, D. Lazer, K. Kaski, J. Kertész, and A.-L. Barabási. Structure and tie strengths in mobile communication networks. Proc. Nat. Acad. Sci., 104(18):7332–7336, 2007.
- (12) C. Cattuto, W. Van den Broeck, A. Barrat, V. Colizza, J.-F. Pinton, and A. Vespignani. Dynamics of person-to-person interactions from distributed RFID sensor networks. PloS ONE, 5(7):e11596, 2010.
- (13) L. F. Richardson. Statistics of deadly quarrels. Boxwood Press, Pittsburgh, 1960.
- (14) A. Clauset, M. Young, and K. S. Gleditsch. On the frequency of severe terrorist events. J. Conflict Resol., 51(1):58–87, 2007.
- (15) Ó. Becerra, N. Johnson, P. Meier, J. Restrepo, and M. Spagat. Natural disasters, casualties and power laws: A comparative analysis with armed conflict. In Proc. Ann. Meet. Am. Political Sc. Assoc. Citeseer, 2012.
- (16) A. Chatterjee and B. K. Chakrabarti. Fat tailed distributions for deaths in conflicts and disasters. Rep. Adv. Phys. Sc., 1:1740007, 2017.
- (17) M. Lim, R. Metzler, and Y. Bar-Yam. Global pattern formation and ethnic/cultural violence. Science, 317(5844):1540–1544, 2007.
- (18) The GDELT Project, retreived October, 2016. www.gdeltproject.org/.
- (19) A. Clauset, C. R. Shalizi, and M. E. J. Newman. Power-law distributions in empirical data. SIAM review, 51(4):661–703, 2009.
- (20) R. Albert, H. Jeong, and A.-L. Barabási. Error and attack tolerance of complex networks. Nature, 406(6794):378–382, 2000.
- (21) C. W. J. Granger. Investigating causal relations by econometric models and cross-spectral methods. Econometrica, 37:424–438, 1969.
- (22) M. D. Ward, A. Beger, J. Cutler, M. Dickenson, C. Dorff, and B. Radford. Comparing GDELT and ICEWS Event Data. Analysis, 21:267-297, 2013.
- (23) B. Arva, J. Beieler, B. Fisher, G. Lara, P. A. Schrodt, W. Song, M. Sowell and S. Stehle. Improving Forecasts of International Events of Interest. Working paper, 2013.
- (24) K. Leetaru and P. A. Schrodt. GDELT: Global data on events, location, and tone, 1979–2012. In ISA Ann. Convention, volume 2. Citeseer, 2013.
- (25) B. Gupta, G. Sehgal, K. Sharma, G. Sharma, A. Chatterjee, A. Chakraborti, and G Shroff. Spatial analysis of networks of ethnic conflicts and humans rights violations. in preparation.
- (26) World’s largest event dataset now publicly available in BigQuery. https://cloudplatform.googleblog.com/2014/05/worlds-largest-event-dataset-now-publicly-available-in-google-bigquery.html.
- (27) GDELT - DATA FORMAT CODEBOOK V 1.03, as on 8/25/2013. http://data.gdeltproject.org/documentation/GDELT-Data_Format_Codebook.pdf.
- (28) J Dana Stuster. Mapped: Every protest on the planet since 1979. ForeignPolicy. com, 2013.