Gas vs. solid phase deuterated chemistry: HDCO and D2CO in massive star-forming regions
Abstract
Context. The formation of deuterated molecules is favoured at low temperatures and high densities. Therefore, the deuteration fraction (Dfrac) is expected to be enhanced in cold, dense prestellar cores and to decrease after protostellar birth. Previous studies have shown that the deuterated forms of species such as N2H+ (formed in the gas phase) and CH3OH (formed on grain surfaces) can be used as evolutionary indicators and to constrain their dominant formation processes and time-scales.
Aims. Formaldehyde (H2CO) and its deuterated forms can be produced both in the gas phase and on grain surfaces. However, the relative importance of these two chemical pathways is unclear. Comparison of the deuteration fraction of H2CO with respect to that of N2H+, NH3 and CH3OH can help us to understand its formation processes and time-scales.
Methods. With the new SEPIA Band 5 receiver on APEX, we have observed the =32 rotational lines of HDCO and D2CO at 193 GHz and 175 GHz toward three massive star forming regions hosting objects at different evolutionary stages: two High-mass Starless Cores (HMSC), two High-mass Protostellar Objects (HMPOs), and one Ultracompact HII region (UC HII). By using previously obtained H2CO =32 data, the deuteration fractions HDCO/H2CO and D2CO/HDCO are estimated.
Results. Our observations show that singly-deuterated H2CO is detected toward all sources and that the deuteration fraction of H2CO increases from the HMSC to the HMPO phase and then sharply decreases in the latest evolutionary stage (UCHII). The doubly-deuterated form of H2CO is detected only in the earlier evolutionary stages with D2CO/H2CO showing a pattern that is qualitatively consistent with that of HDCO/H2CO, within current uncertainties.
Conclusions. Our initial results show that H2CO may display a similar Dfrac pattern as that of CH3OH in massive young stellar objects. This finding suggests that solid state reactions dominate its formation.
Key Words.:
ISM: molecules; radio lines: ISM; stars:formation; Astrochemistry1 Introduction
In molecular cloud cores, the formation of deuterated molecules is favoured at low temperatures (T 20 K) and at high densities (n cm-3). It is thus expected that the deuteration fraction (Dfrac, the relative abundance between a species containing D as compared to the same species containing H) is enhanced in cold and dense prestellar cores. Dfrac should then decrease after protostellar birth, when the young stellar object heats up the central region of the core (Caselli, 2002). For low mass star forming cores, observations of deuterated species produced in gas-phase reactions, such as H2D+ and N2D+, have confirmed this theoretical scenario (Crapsi et al., 2005; Caselli et al., 2008).
Recent studies show that high Dfrac values are also typical for high mass star forming cores and that the Dfrac of some species could be an evolutionary indicator also in the intermediate and high mass regime (e.g. Busquet et al., 2010; Fontani et al., 2011; Sakai et al., 2012). High-mass star forming regions can be divided into the following evolutionary stages: high-mass starless cores (HMSCs), high-mass protostellar objects (HMPOs) and ultracompact HII regions (UCHIIs) (e.g. Beuther et al., 2007; Tan et al., 2014). By studying several deuterated species in 27 massive cores, Fontani et al. (2011, 2015) found that species formed exclusively in the gas (N2H+) showed different evolutionary trends from those formed partially (NH3) or totally (CH3OH) on grain mantles. Indeed, the abundance of N2D+ is higher in HMSCs and it drops by about an order of magnitude during the HMPO and UCHII stages. This is due to the higher gas temperatures found in the latter objects that allow the destruction of H2D+ via the endothermic reaction H2D+ + H2 H + HD (see Gerlich et al., 2002; Fontani et al., 2011). In contrast, deuterated methanol, formed only on grain surfaces, is detected towards HMPOs and externally heated HMSCs only, possibly as a result of evaporation/sputtering of grain mantles. Therefore, while Dfrac(N2H+) can be used as an indicator of the initial conditions in starless/pre-stellar cores, high values of Dfrac(CH3OH) are a good probe of the earliest protostellar phases (Fontani et al., 2015). The deuteration fraction of NH3, whose formation pathways occur both in the gas-phase and on grain surfaces, does not show statistically significant changes with evolution and thus, there is not a dominant formation pathway for NH3 and its deuterated forms.
Like NH3, formaldehyde (H2CO) may also be produced both in the gas phase and on grain surfaces. The two main pathways for the production of H2CO (and its deuterated counterparts) involve CH (viz. CH2D+ and CHD) in the gas phase and multiple hydrogenation (viz. deuteration) of CO in the ices (see e.g. Roberts & Millar, 2007). The gas phase pathway is similar to the one of N2H+ with the main difference that deuteration of H2CO can also happen at warmer temperatures (30-50 K, see Parise et al., 2009), whereas T 20 K are needed to increase the deuteration of N2H+ via H2D+. The ice phase formation route of H2CO is similar to that of CH3OH and their deuterated forms. Although laboratory work and observational studies of low-mass protostars suggest an important contribution from grain surface chemistry for the production of H2CO (Watanabe, 2005; Roberts & Millar, 2007; Bergman et al., 2011), the relative importance of the dust grain vs gas-phase formation routes remains unclear. Furthermore, D2CO measurements in intermediate- and in high-mass star-forming regions are lacking (D2CO has been firmly detected toward NGC 7129-FIRS 2 and tentatively toward the MonR2 ultra-compact HII region; Fuente et al., 2005; Treviño-Morales et al., 2014), and it is thus unknown whether the chemistry of H2CO and of its deuterated counterparts is governed by the same mechanisms in both low-mass and more massive objects.
In this Letter, we report the first detection of doubly-deuterated formaldehyde, D2CO, toward high-mass star-forming cores. These are the initial findings of a search for HDCO and D2CO emission toward three high-mass star-forming regions at different evolutionary stages using the new SEPIA Band 5 receiver available at the Atacama Pathfinder EXperiment (APEX111This publication is based on data acquired with the Atacama Pathfinder Experiment (APEX). APEX is a collaboration between the Max-Planck-Institut für Radioastronomie, the European Southern Observatory, and the Onsala Space Observatory.) telescope. The targets were extracted from the sample of Fontani et al. (2011) for which the deuteration fraction of other molecules (e.g. N2H+, CH3OH and NH3) has been measured (Fontani et al., 2015). The evolutionary stages of our sample go from the initial conditions in HMSCs, to the HMPOs phase and the UCHII regions. The source sample and the observations are described in Section 2, while our results are presented in Section 3. In Section 4, we discuss our results and put them in context with respect to previous findings in low-mass star-forming regions. In Section 5, we summarize our conclusions.
2 Observations
2.1 Selected targets
The selected sources are extracted from Fontani et al. (2011) and are: AFGL5142, IRAS 05358+3543 and G5.89-0.39. These are the sources with the brightest lines of H2CO within each evolutionary stage. We note that this selection may introduce biases, therefore a follow-up study with larger sample is needed. The bolometric luminosities of the objects are 103.6, 103.8 and 105.1 L⊙ and the integrated gas masses are 210, 300 and 300 M⊙ for AFGL5142, IRAS05358 and G5.89, respectively (Fontani et al., 2011; Liu et al., 2016; Beuther et al., 2002b, 2005; Tang et al., 2009). AFGL5142 is a high-mass star-forming region (distance of 2.14 kpc; Burns et al. in prep.), which hosts several dense cores at different evolutionary stages: the central core (CC, classified as HMPO), the western core (WC, a HMSC core), and the eastern core (EC; see Busquet et al., 2011; Fontani et al., 2011). We centered our single-pointing observations on CC. However, since the separation between WC and CC is 9, and since the APEX beam is 34 at 190 GHz, WC and CC were also covered in our observations. The N2H+ (1-0) emission in AFGL5142 shows two velocity components at 2 and 4 km s-1, associated respectively with CC and WC (Busquet et al., 2011).
IRAS 05358+3543, located at 1.8 kpc (Snell et al., 1990), contains three dust condensations (mm1, mm2, mm3) within an area of 94 (Beuther et al., 2002a). According to Leurini et al. (2007), mm1 splits into mm1a, a hot core and a massive circumstellar disk with T220K, and mm1b, which is at an earlier stage of evolution. Source mm2 is a low-to-intermediate mass protostar while mm3 is a HMSC. Our observation is centered on mm1, but all three dust condensations are covered within the APEX beam.
G5.89-0.39 is a shell-like UCHII region (diameter of 4) found at 2.99 kpc (Sato et al., 2014). Sub-arcsecond observations reveal at least five dust condensations (Su et al., 2009). We centered our observations on the SMA-N dust condensation. Several energetic outflows and maser activity have been detected toward G5.89-0.39 (see e.g. Hunter et al., 2008; Fish et al., 2005).
2.2 IRAM-30m H2CO observations
Previous observations of these objects were performed using the IRAM-30m telescope (details can be found in Fontani et al., 2011, 2015). The frequency setups included the 303-202, 322-221 and 321-220 transitions of H2CO. The spectroscopic information of these transitions is shown in Table 2 (Müller et al., 2005). The H2CO line emission is very strong in all three sources with measured T (top panels in Fig. 2).
2.3 APEX SEPIA observations
The three sources were observed with the APEX SEPIA receiver (Swedish-ESO PI receiver for APEX; Billade et al., 2012)222Observations were done as part of Science Verification in July 2015 (project E-095.F-9808A), and in November-October 2015 and May-June 2016 within projects E-096.C-0484A and E097.C-0897A.. We carried out single-pointing observations of HDCO and D2CO using the position switching observing mode. The J2000 central coordinates used in our observations were [RA, Dec] = (05:30:48.0, +33:47:54) for AFGL5142, [RA, Dec] = (05:39:13.0, +35:45:51) for IRAS05358+3543, and [RA, Dec] = (18:00:30.5, -24:04:01) for G5.89-0.39. The observed transitions of HDCO (at 185 GHz and 193 GHz) and D2CO (at 174.4 GHz) are shown in Table 2. The pointing was checked every 60-90 mins, and the typical system temperatures were 150 K. The beam size at 183 GHz was 34 and a beam efficiency of 0.83 was used. The XFFTS spectrometer provided a velocity resolution of 0.059 km s-1 and 0.066 km s-1 for the HDCO (at 185-193 GHz) and D2CO transitions (at 174 GHz), respectively. However, for the data analysis, we smoothed the spectra to a uniform velocity resolution of 0.5 km/s. At this velocity resolution, we reached an rms of 0.01 K with typical integration times between 32 and 48 minutes. The PWV was 0.3-1.5 mm. The data were reduced and analyzed with the Gildas software 333See http://www.iram.fr/IRAMFR/GILDAS. (version jul14a, Pety, 2005) and the derived parameters of the detected lines are reported in Appendix A.
3 Results
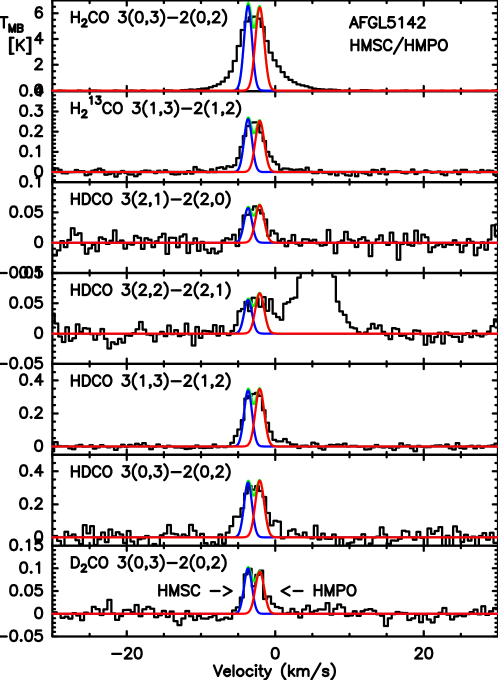
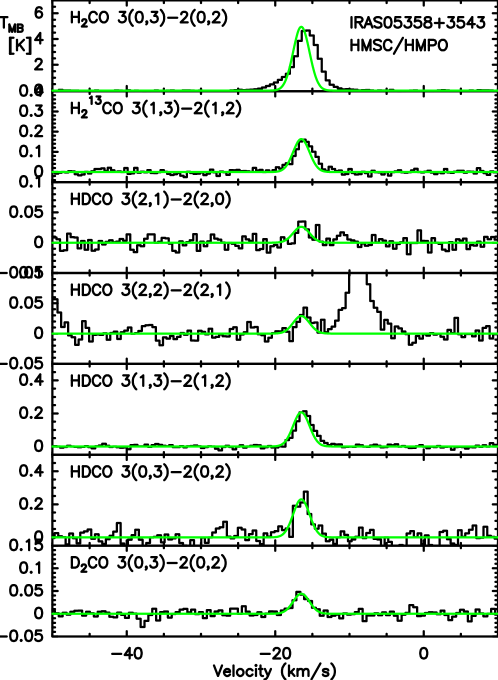
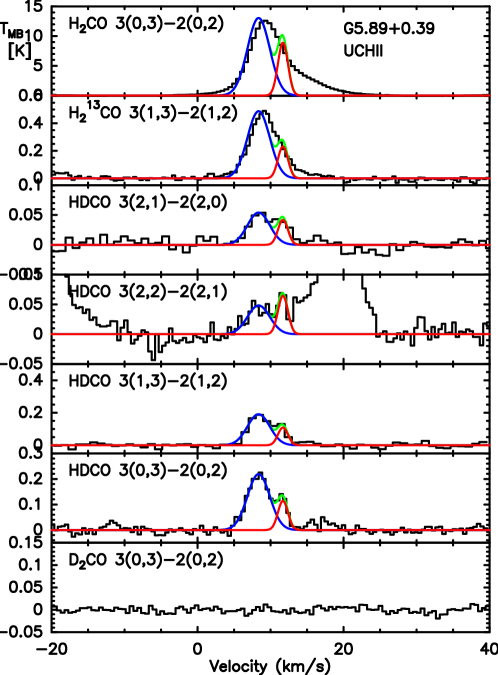
In Fig. 2, we present the HDCO and D2CO lines observed toward AFGL5142, IRAS 05358+3543, and G5.89-0.39. The H2CO 30,3-20,2 data obtained with the IRAM 30m observation are also shown for comparison. While the HDCO lines (upper energy levels of 18.5-50.4 K) are clearly detected in all sources with peak intensities 35 mK, the D2CO 30,3-20,2 transition is only observed toward AFGL5142 and IRAS 05358+3543, i.e. at the earlier HMSC/HMPO stages. The 3 upper limit measured for the D2CO 32,2-22,1 line toward G5.89-0.39 is 6 mK.
In Table 3, we report the derived parameters of the observed lines of H2CO, HDCO and D2CO. For AFGL5142, the D2CO 30,3-20,2 transition shows two velocity components at km/s and km/s (see Table 3). We thus fitted all the observed H2CO, HDCO and D2CO line emission using two Gaussian line profiles with fixed central velocities at km/s and km/s. These two velocity components are associated with the WC core at the HMSC stage (radial velocity km/s), and with the CC core at the HMPO stage (at km/s; Busquet et al., 2011). Both cores lie within the single-dish beam of our IRAM 30m and APEX observations (WC and CC are separated by 9 while the IRAM 30m and APEX beam sizes are 11 and 34, respectively).
Since the H2CO, HDCO and D2CO lines toward G5.89-0.39 show a slight asymmetry in their line profiles, we have also fitted these data using two Gaussian line profiles centered at 8.5 and 11.5 km s-1. These two components can also be seen in the emission from e.g. N2H+ or NH3 (see Fontani et al., 2011, 2015).
For IRAS 05358+3543, H2CO, HDCO and D2CO show only one velocity component peaking at 16 km s-1.
To estimate the molecular column densities of H2CO, HDCO and D2CO, we used the MADCUBAIJ software that assumes LTE conditions (Martín et al., 2011; Rivilla et al., 2016). We adopted a source size of as measured from NH3(2,2) and following Fontani et al. (2015). This source size is consistent with that obtained in other high density tracers such as N2H+(1-0) and C34S(7-6) (see Hunter et al., 2008; Busquet et al., 2011). We have attempted to derive the excitation temperature of the gas, Tex, using the four APEX HDCO transitions (Table 2). Most of the observed J=32 lines of H2CO, HDCO and D2CO likely trace gas with similar physical conditions given that their Eup and Aij are similar. Hence, the determination of Tex is highly uncertain due to the low number of available lines. We thus assumed a Tex of 28 K, which is the average temperature obtained from NH3 for IRAS 05358+3545 and AFGL5142 (Fontani et al., 2011)444Fontani et al. (2011) do not report any temperature for G5.89-0.39 and therefore we assume the same Tex of 28 K for this source.. We note that the assumed value of Tex can change the derived column densities, but not their ratios. Assuming a Tex value in the 20-40 K range, the variation of the column density values compared to the Tex=28 K case is below 50%. Lower and higher excitation temperatures can not fit the observed transitions properly. We have estimated the column densities with different source sizes also. With a source size of 2” we can not fit the observed transitions properly due to optical depth effects. The estimated column densities decrease by factors of 2-3 for a source size of 10”. For AFGL5142, we obtained the H2CO, HDCO and D2CO column densities for the velocity components at km/s (CC, in the HMPO stage) and at km/s (WC in the HMSC phase). In Table 1, we report the calculated column densities of H2CO, HDCO and D2CO and the deuteration fractions obtained from the column density ratios HDCO/H2CO, D2CO/H2CO and D2CO/HDCO.
The HCO 31,3-21,2 transition was covered within our APEX SEPIA setup. We have estimated the H2CO column densities from the HCO column density and using the 12C/13C ratio derived by Milam et al. (2005) as a function of Galactocentric distance. The H2CO lines in AFGL5142 and G5.89-0.39 are not very optically thick since the H2CO column densities calculated using the main isotopologue H2CO and the 13C isotopologue HCO differ only by factors 0.4 and 3.6. For IRAS 05358+3543, however, the column densities derived from H2CO and HCO differ by a factor of 9. In this case, we use the column density derived directly from the H2CO lines and consider it as a lower limit for IRAS05358.
| Name | Type | N(H2CO) | N(HDCO) | N(D2CO) | N(HDCO)/N(H2CO) | N(D2CO)/N(H2CO) | N(D2CO)/N(HDCO) |
|---|---|---|---|---|---|---|---|
| (1013 cm-2) | (1013 cm-2) | (1013 cm-2) | |||||
| AFGL5142 | HMSC | 317 (10) | 11 (3) | 3.4 (2) | 0.035 (0.01) | 0.011 (0.01) | 0.31 (0.3) |
| IRAS05358+3543 | HMSC/HMPO | 130 (2) | 13.0 (1.4) | 2.6 (1.7) | 0.10 (0.01) | 0.020 (0.01) | 0.20 (0.2) |
| AFGL5142 | HMPO | 40 (2) | 14 (3) | 2.5 (1.6) | 0.34 (0.09) | 0.063 (0.04) | 0.18 (0.15) |
| G5.89-0.39 | UCHII | 1740 (170) | 25 (2) | 2 | 0.014 (0.002) | 0.001 | 0.08 |
4 Discussion
As proposed by Fontani et al. (2011, 2015), the different trends observed for Dfrac(N2H+), Dfrac(CH3OH) and Dfrac(NH3) as a function of evolution in high-mass star-forming regions are likely due to the way deuteration occurs for the different species: in the gas phase for N2H+, on the grain surface for CH3OH, and via a mixture of the two for NH3. For H2CO, D2CO is expected to be a product of material processed on solid ices since its formation time-scales are longer than the depletion timescales in the pre-stellar phase (see Taquet et al., 2012). Consequently, D2CO should show an evolutionary trend similar to that derived for Dfrac(CH3OH), which peaks at the HMPO phase (Fontani et al., 2015). If HDCO showed a similar behaviour to D2CO, we could conclude that HDCO also forms mostly on dust grains. This hypothesis would be supported by the fact that HDCO is detected in hot cores and hot corinos while N2D+ (only formed in the gas phase) is not (see e.g. Fuente et al., 2005).
Although our sample and statistics are limited, our results show a trend for the deuteration fractions HDCO/H2CO and D2CO/H2CO to progressively increase from the HMSC to the HMPO stage by factors 3-10, and to subsequently decrease at the UCHII phase (by factors 20; see Fig. 1). This behaviour is similar to the trend observed for Dfrac(CH3OH), and since the measured HDCO/H2CO are similar and D2CO/H2CO ratios are 4-21 times higher than those predicted by Roberts & Millar (2007) for the production of HDCO and D2CO via gas-phase reactions, surface chemistry likely plays an important role in the formation of HDCO and D2CO.

Rodgers & Charnley (2002) indeed proposed a grain surface formation scenario for these molecules in which H2CO and, its deuterated forms, represent intermediate steps in the formation of CH3OH and deuterated-CH3OH via hydrogenation and D-addition reactions. The extent by which surface chemistry is responsible for the production of HDCO and D2CO in these sources can be estimated by using the F parameter:
| (1) |
From the HDCO/H2CO and D2CO/H2CO ratios in Table 1, we find that F0.1-0.5 for HMSCs, F1.8 for HMPOs and F0.2 for UCHIIs. As explained by Rodgers & Charnley (2002), low F values are consistent with grain surface chemistry. However, F values in the range 1.6-2.3 could be explained also by gas-phase chemistry. Therefore, at the HMPO stage we cannot rule out a contribution to the HDCO/D2CO production via the gas phase neutral-neutral reactions CH2D + O HDCO + H and CHD2 + O D2CO + H. Note that these reactions occur in the forward direction at temperatures 30-50 K due to the exothermicity of the formation reactions of CH2D and CHD2 (Turner, 1990).
Table 1 also shows that the D2CO/HDCO ratio remains constant at 0.2 within the uncertainties regardless of the source or evolutionary stage. As for the low-mass regime, the ratio HDCO/D2CO lies well below the statistical value given as D-species/D2-species=4(D-species/H-species)-1, consistent with the grain surface formation scenario (see Ceccarelli et al., 2014).
If we compare the HDCO/H2CO and D2CO/H2CO ratios from Table 1 with those collected by Ceccarelli et al. (2014) for low-mass star-forming regions (see their Figure 5), we find that the ratio 3-5 in the high-mass regime while the same ratio is close to 1 in low-mass star-forming regions. This may be a consequence of the shorter time-scales available in the high-mass regime for the formation of D2CO in the ices (Taquet et al., 2012; Rodgers & Charnley, 2002). Indeed, in the scheme of Rodgers & Charnley (2002), D2CO is formed after HDCO through two hydrogen-deuterium exchanges experienced by H2CO in the ices. The higher ratio in high-mass star-forming regions therefore suggests that HDCO may not have had enough time to get converted into D2CO as a consequence of the faster evolution of high-mass protostars as compared to their low-mass counterparts.
5 Summary
We have observed HDCO and D2CO toward a sample of high-mass star-forming regions at different evolutionary stages. HDCO transitions were detected for all of them, while the D2CO line was detected only for the earlier HMSC and HMPO stages. Our results point toward the idea that H2CO, and its deuterated species, form mostly on grain surfaces although some gas-phase contribution is expected at the warm HMPO stage. Interferometric observations are needed to separate the HDCO and D2CO emission originating from the small and dense cores and to disentangle their origin in high-mass star-forming regions.
Acknowledgements.
We would like to thank the SEPIA team and APEX team for the successful commissioning of the instrument and for the observations. This work was partly supported by the Gothenburg Centre of Advanced Studies in Science and Technology through the program Origins of habitable planets and by the Italian Ministero dell’Istruzione, Università e Ricerca through the grant Progetti Premiali 2012 – iALMA (CUP C52I13000140001) and by NAOJ ALMA Scientific Research Grant Number 2016-03B. K.W. acknowledges the support from Deutsche Forschungsgemeinschaft (DFG) grant WA3628-1/1 through priority programme 1573 (’Physics of the Interstellar Medium”). I.J.-S. acknowledges the financial support received from the STFC through an Ernest Rutherford Fellowship (proposal number ST/L004801/1). L.V.T. and S.Z. acknowledge the support by the OTKA grants NN-111016 and K101393.References
- Bergman et al. (2011) Bergman, P., Parise, B., Liseau, R., & Larsson, B. 2011, A&A, 527, A39
- Beuther et al. (2007) Beuther, H., Churchwell, E. B., McKee, C. F., & Tan, J. C. 2007, Protostars and Planets V, 165
- Beuther et al. (2002a) Beuther, H., Schilke, P., Gueth, F., et al. 2002a, A&A, 387, 931
- Beuther et al. (2002b) Beuther, H., Schilke, P., Menten, K. M., et al. 2002b, ApJ, 566, 945
- Beuther et al. (2005) Beuther, H., Schilke, P., Menten, K. M., et al. 2005, ApJ, 633, 535
- Billade et al. (2012) Billade, B., Nystrom, O., Meledin, D., et al. 2012, IEEE Transactions on Terahertz Science and Technology, 2, 208
- Busquet et al. (2011) Busquet, G., Estalella, R., Zhang, Q., et al. 2011, A&A, 525, A141
- Busquet et al. (2010) Busquet, G., Palau, A., Estalella, R., et al. 2010, A&A, 517, L6
- Caselli (2002) Caselli, P. 2002, Planet. Space Sci., 50, 1133
- Caselli et al. (2008) Caselli, P., Vastel, C., Ceccarelli, C., et al. 2008, A&A, 492, 703
- Ceccarelli et al. (2014) Ceccarelli, C., Caselli, P., Bockelée-Morvan, D., et al. 2014, Protostars and Planets VI, 859
- Crapsi et al. (2005) Crapsi, A., Caselli, P., Walmsley, C. M., et al. 2005, ApJ, 619, 379
- Fish et al. (2005) Fish, V. L., Reid, M. J., Argon, A. L., & Zheng, X.-W. 2005, ApJS, 160, 220
- Fontani et al. (2015) Fontani, F., Busquet, G., Palau, A., et al. 2015, A&A, 575, A87
- Fontani et al. (2011) Fontani, F., Palau, A., Caselli, P., et al. 2011, A&A, 529, L7
- Fuente et al. (2005) Fuente, A., Neri, R., & Caselli, P. 2005, A&A, 444, 481
- Gerlich et al. (2002) Gerlich, D., Herbst, E., & Roueff, E. 2002, Planet. Space Sci., 50, 1275
- Hunter et al. (2008) Hunter, T. R., Brogan, C. L., Indebetouw, R., & Cyganowski, C. J. 2008, ApJ, 680, 1271
- Leurini et al. (2007) Leurini, S., Beuther, H., Schilke, P., et al. 2007, A&A, 475, 925
- Liu et al. (2016) Liu, T., Zhang, Q., Kim, K.-T., et al. 2016, ApJ, 824, 31
- Martín et al. (2011) Martín, S., Krips, M., Martín-Pintado, J., et al. 2011, A&A, 527, A36
- Milam et al. (2005) Milam, S. N., Savage, C., Brewster, M. A., Ziurys, L. M., & Wyckoff, S. 2005, ApJ, 634, 1126
- Müller et al. (2005) Müller, H. S. P., Schlöder, F., Stutzki, J., & Winnewisser, G. 2005, Journal of Molecular Structure, 742, 215
- Parise et al. (2009) Parise, B., Leurini, S., Schilke, P., et al. 2009, A&A, 508, 737
- Pety (2005) Pety, J. 2005, in SF2A-2005: Semaine de l’Astrophysique Francaise, ed. F. Casoli, T. Contini, J. M. Hameury, & L. Pagani, 721
- Rivilla et al. (2016) Rivilla, V. M., Fontani, F., Beltrán, M. T., et al. 2016, ApJ, 826, 161
- Roberts & Millar (2007) Roberts, H. & Millar, T. J. 2007, A&A, 471, 849
- Rodgers & Charnley (2002) Rodgers, S. D. & Charnley, S. B. 2002, Planet. Space Sci., 50, 1125
- Sakai et al. (2012) Sakai, T., Sakai, N., Furuya, K., et al. 2012, ApJ, 747, 140
- Sato et al. (2014) Sato, M., Wu, Y. W., Immer, K., et al. 2014, ApJ, 793, 72
- Snell et al. (1990) Snell, R. L., Dickman, R. L., & Huang, Y.-L. 1990, ApJ, 352, 139
- Su et al. (2009) Su, Y.-N., Liu, S.-Y., Wang, K.-S., Chen, Y.-H., & Chen, H.-R. 2009, The Astrophysical Journal Letters, 704, L5
- Tan et al. (2014) Tan, J. C., Beltrán, M. T., Caselli, P., et al. 2014, Protostars and Planets VI, 149
- Tang et al. (2009) Tang, Y.-W., Ho, P. T. P., Girart, J. M., et al. 2009, ApJ, 695, 1399
- Taquet et al. (2012) Taquet, V., Ceccarelli, C., & Kahane, C. 2012, ApJ, 748, L3
- Treviño-Morales et al. (2014) Treviño-Morales, S. P., Pilleri, P., Fuente, A., et al. 2014, A&A, 569, A19
- Turner (1990) Turner, B. E. 1990, ApJ, 362, L29
- Watanabe (2005) Watanabe, N. 2005, in IAU Symposium, Vol. 231, Astrochemistry: Recent Successes and Current Challenges, ed. D. C. Lis, G. A. Blake, & E. Herbst, 415–426
Appendix A Observed H2CO, HDCO, and D2CO lines
In Table 2 we report the parameters of the observed lines for H2CO, HDCO, and D2CO. The observing setup (and the observations of Fontani et al. 2011, 2015) also covered other, higher excitation lines of the same molecules, but these were not detected (and are not expected to be detectable under the expected excitation conditions).
In Fig. 2, we present the HDCO and D2CO lines observed toward AFGL5142, IRAS 05358+3543, and G5.89-0.39. The H2CO 30,3-20,2 data obtained with the IRAM 30m observation are also shown for comparison. While the HDCO lines (upper energy levels of 18.5-50.4 K) are clearly detected in all sources with peak intensities 35 mK, the D2CO 30,3-20,2 transition is only observed toward AFGL5142 and IRAS 05358+3543, i.e. at the earlier HMSC/HMPO stages. The 3 upper limit measured for the D2CO 32,2-22,1 line toward G5.89-0.39 is 6 mK.
In Table 3 we report the parameters derived fitting single or multiple (in the case of AFGL5142 and G5.89-0.39) Gaussian profiles to the detected lines. For the HDCO, HCO and H2CO spectra of AFGL5142 and IRAS05358+3543, we fitted the vLSR and FWHM values based on the D2CO velocity components. For G5.89-0.39, we derived the velocity and width of the two components based on the HDCO 320,2 line. We do not use directly these fits for the calculation of the physical parameters. We use the velocities and linewidths as initial parameters for the MADCUBAIJ modeling.
| Species | Transition | Frequency | Eup | Aij | Telescope |
|---|---|---|---|---|---|
| [GHz] | [K] | [s-1] | |||
| D2CO | 30,320,2 | 174.413 | 16.8 | 1.44e-04 | APEX |
| HDCO | 31,321,2 | 185.307 | 25.8 | 1.53e-04 | APEX |
| HDCO | 30,320,2 | 192.893 | 18.5 | 1.94e-04 | APEX |
| HDCO | 32,222,1 | 193.392 | 50.4 | 1.09e-04 | APEX |
| HDCO | 32,122,0 | 193.907 | 50.4 | 1.10e-04 | APEX |
| HCO | 31,321,2 | 206.131 | 31.6 | 2.11e-04 | APEX |
| H2CO | 91,891,9 | 216.569 | 174.0 | 7.22e-06 | IRAM |
| H2CO | 30,320,2 | 218.222 | 21.0 | 2.82e-04 | IRAM |
| H2CO | 32,222,1 | 218.476 | 68.1 | 1.57e-04 | IRAM |
| H2CO | 32,122,0 | 218.760 | 68.1 | 1.58e-04 | IRAM |
| Line | Area | vLSR | FWHM | TMB |
|---|---|---|---|---|
| [K km/s] | [km/s] | [km/s] | [K] | |
| AFGL5142 | ||||
| D2CO 30,320,2 | 0.13 (0.01) | -3.66 (0.06) | 1.3 (0.2) | 0.10 (0.01) |
| 0.14 (0.01) | -2.08 (0.05) | 1.4 (0.3) | 0.09 (0.01) | |
| HDCO 30,320,2 | 0.45 (0.01) | -3.66 | 1.3 | 0.34 (0.01) |
| 0.52 (0.01) | -2.08 | 1.4 | 0.35 (0.01) | |
| HDCO 31,321,2 | 0.44 (0.04) | -3.66 | 1.3 | 0.33 (0.04) |
| 0.51 (0.04) | -2.08 | 1.4 | 0.34 (0.04) | |
| HDCO 32,222,1 | 0.07 (0.06) | -3.66 | 1.3 | ” 0.06 (0.01) |
| 0.10 (0.06) | -2.08 | 1.4 | 0.07 (0.01) | |
| HDCO 32,122,0 | 0.07 (0.01) | -3.66 | 1.3 | 0.06 (0.01) |
| 0.09 (0.01) | -2.08 | 1.4 | 0.06 (0.01) | |
| HCO 31,221,2 | 0.35 (0.01) | -3.66 | 1.3 | 0.26 (0.01) |
| 0.38 (0.01) | -2.08 | 1.4 | 0.25 (0.01) | |
| H2CO 30,320,2 | 8.81 (0.48) | -3.66 | 1.3 | 6.60 (0.48) |
| 9.62 (0.51) | -2.08 | 1.4 | 6.47 (0.48) | |
| IRAS05358+3543 | ||||
| D2CO 30,320,2 | 0.12 (0.01) | -16.49 (0.15) | 2.6 (0.4) | 0.04 (0.01) |
| HDCO 30,320,2 | 0.57 (0.01) | -16.49 | 2.6 | 0.21 (0.01) |
| HDCO 31,321,2 | 0.64 (0.05) | -16.49 | 2.6 | 0.23 (0.04) |
| HDCO 32,222,1 | 0.08 (0.04) | -16.49 | 2.6 | 0.03 (0.01) |
| HDCO 32,122,0 | 0.07 (0.01) | -16.49 | 2.6 | 0.03 (0.01) |
| HCO 31,221,2 | 0.45 (0.01) | -16.49 | 2.6 | 0.16 (0.01) |
| H2CO 30,320,2 | 13.70 (0.14) | -16.49 | 2.6 | 4.95 (0.09) |
| G5.89-0.39 | ||||
| D2CO 30,320,2 | 0.03 | 0.02 | ||
| HDCO 30,320,2 | 0.84(0.03) | 8.37(0.08) | 3.60 (0.18) | 0.22 (0.01) |
| 0.19(0.02) | 11.70 (0.08) | 1.60 (0.21) | 0.11 (0.01) | |
| HDCO 31,321,2 | 0.73(0.03) | 8.37 | 3.6 | 0.19 (0.01) |
| 0.19(0.02) | 11.7 | 1.6 | 0.11 (0.01) | |
| HDCO 32,222,1 | 0.18(0.11) | 8.37 | 3.6 | 0.05 (0.01) |
| 0.11(0.08) | 11.7 | 1.6 | 0.06 (0.01) | |
| HDCO 32,122,0 | 0.21(0.03) | 8.37 | 3.6 | 0.05 (0.01) |
| 0.07(0.01) | 11.7 | 1.6 | 0.04 (0.01) | |
| HCO 31,221,2 | 1.87 (0.03) | 8.37 | 3.6 | 0.48 (0.02) |
| 0.39 (0.02) | 11.7 | 1.6 | 0.23 (0.02) | |
| H2CO 30,320,2 | 50.03(1.61) | 8.37 | 3.6 | 13.05 (0.93) |
| 15.16(1.07) | 11.7 | 1.6 | 8.90 (0.93) | |