Towards Decision Support for Smart Energy Systems based on Spatio-temporal Models
Abstract
This report presents our SmartSpace event handling framework for managing smart-grids and renewable energy installations. SmartSpace provides decision support for human stakeholders. Based on different datasources that feed into our framework, a variety of analysis and decision steps are supported. These decision steps are ultimately used to provide adequate information to human stakeholdes. The paper discusses potential data sources for decisions around smart energy systems and introduces a spatio-temporal modeling technique for the involved data. Operations to reason about the formalized data are provided. Our spatio-temporal models help to provide a semantic context for the data. Customized rules allow the specification of conditions under which information is provided to stakeholders. We exemplify our ideas and present our demonstrators including visualization capabilities.
Index Terms:
collaboration solutions, decision support, distributed engineering, smart-grids, visualizationI Introduction
Smart energy systems and new solutions for grid technology have become an important topic in the past decade. The emergence of renewable energy technology has been a source for new challenges in academia and industry. Research and industrial solutions now cover areas such as energy storage, strengthening of existing grid technology and prediction models for energy generation and consumption. The implementation of these new technologies can require large capital investments. To support decisions around the introduction of new smart energy systems and during operation of existing systems a variety of databases have been created. In this paper, we are extending these existing views by integrating the existing data and knowledge sources that have already been created for smart energy systems into a common framework. The framework aims at supporting a variety of human stakeholders in their decisions around the planning, maintenance and operation of smart energy systems.
Here, we are discussing SmartSpace. SmartSpace builds upon and extends our collaborative engineering framework which aims at providing information to human stakeholders such as engineers, operators, managers, and facility owners to support remote operations. The first versions of collaborative engineering are primarily focusing on operation and maintenance of remote industrial facilities such as mines and oil rigs in the Australian outback. We have extended our previous work [5] on SmartSpace by providing a broader overview on related approaches and the smart energy context as well as the modeling and reasoning background. We have further extended our semantical modeling and reasoning that are a core feature of our framework and were able to incorporate more feedback on our demonstrators. Compared to the collaborative engineering framework that has been published in [11, 10] we incorporated the following technical adaptations:
-
1.
We have ported the framework from an industrial automation and remote Australian mining context to the smart energy area.
-
2.
We have tried out new semantical modeling elements, developed new operators and integrated them into our reasoning framework.
-
3.
We provide a discussion on the domain specific data sources for the smart energy sector.
-
4.
We have realized a demonstrator: SmartSpace with SmartSpace3D, a visualization front-end.
Our demonstrator comprises the following ingredients:
-
•
It connects to external data-sources.
-
•
It features, a spatio-temporal reasoning component.
-
•
It comprises, a visualization layer and user interface.
Our SmartSpace framework provides decision support for human stakeholders such as customers / consumers, engineers, owners, and operators of smart energy systems. We have identified two different ways to support decisions:
-
•
We support short-term decisions, such as preventing a grid blackout due to failure, maintenance, environmental conditions (photo-voltaic and wind).
-
•
Longer-term decisions such as strengthening an electricity grid permanently are also supported.
Longer-term and short-term decisions both aim at supporting humans in their decisions.
I-A Motivation: A Smarter Distribution Network
Figure 1 gives an overview on a new scenario of distributed electricity loads and paths to get there: a meshed network. Here, a coal fired plant, solar plant and wind power plant are connected. The connections establish network paths in the distribution network. The management of loads and generation capacity is encoded as a matrix. This is a simple form of embedding such intelligence, so that one can identify the paths available and accordingly improve the availability of the system by also trading from the network in a coordinated manner. This information can be formalized using a spatio-temporal model to make it accessible for machine-based processing.
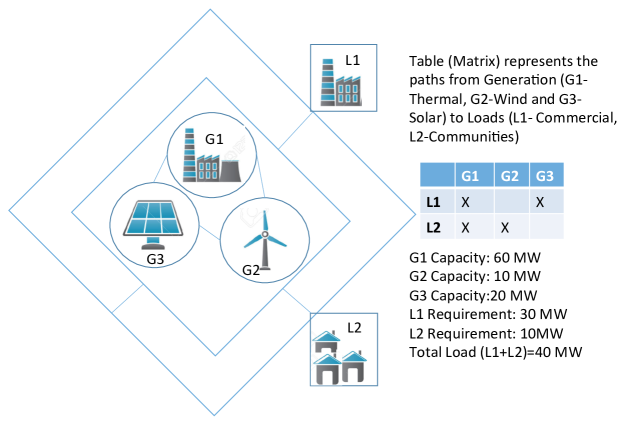
We are interested in remotely monitoring, co-ordinating and operating components involved in electricity generation and grid technology. A distribution network capable of reduced losses, improved voltage regulation and control management of reactive power is the key to this improvement.
With an increasing number of distributed energy resources including renewable sources, distributed architectures need improvement. Two key performance indicators, System Average Interruption Duration Index (SAIDI) and Customer Average Interruption Duration Index (CAIDI) are increasingly of significance from the system point of view. The challenge is dealing with this increased complexity in a distributed system where the fine balance of coordinated or collaborative decision making across centralized elements like SCADA and decentralized aspects of controllers and protection relays is a necessity. Many protection and control elements in distribution automation use constrained processing power ranging from 8 bit microcontrollers to more advanced 32 bit ones. The need for intelligent decisions over smart electricity network is increasingly evident in the need for automatic operations in normal load conditions, as well as during Fault restoration Fault Detection, Isolation and Restoration (FDIR). FDIR is a major topic of discussion in emerging scenarios. There are already provisions in electricity distribution automation to handle FDIR. Still the smartness of these systems need significant uplift to handle the diverse challenges. Also with new technologies of data analysis and inference, these challenges can easily be translated into opportunities [28]. Some decision support in smart energy systems comes with real-time constraints: In the past manual intervention was required to open fuse and close signals to energize circuit breakers, today it is possible to have programmed reclosing. We require a short time between the time of detection of fault to its isolation to avoid a system failure. At a high level, appropriate models for a decentralized FDIR attempt are a connecting matrix to represent the distribution network scheme which includes three types of components: sources, switching devices, and loads. The FDIR logic reads load current of each device, and updates real time loading for each load. The logic searches all possible paths from source to open tie re-closer and calculates the expected load on new paths. It sends a load message to a protection relay which in turn changes its settings. This would lead to sending a close command to Tie -Point recloser. Once the fault is cleared, the FDIR logic is able to restore the network to pre-fault condition by reversing FDIR actions and safely checking all conditions. The FDIR logic can have elements organized centrally in a cloud or in a SCADA system and also elements distributed across the system elements including relays. This collaborative control necessitates the need of collaborative smart decision making and also consideres decentralized real-time aspects of the system.
I-B Overview on SmartSpace and Collaborative Engineering
Figure 2 presents an overview of the steps involved in our existing collaborative engineering decision support framework. We follow the description from previous work ([11, 10]).
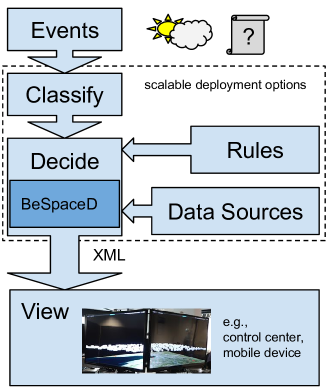
Decision support is triggered by events which can be diverse in nature:
-
•
They may be manually triggered, originating from humans. Examples comprise a consulting request to assess the quality of a grid infrastructure or an on-site engineer reporting to a service. In this case only a few events per week, month or year may arrive.
-
•
On the other hand, they can come from machines. For example, events can also be associated with alarms originating from PLCs. Thousands of events per second may arrive 111Such events can be used for multiple purposes. In addition to our collaborative engineering framework, we are using them for monitoring of software behavior [41, 42]..
Collaborative engineering responds to the events by using customizable decision support that is based on our spatio-temporal reasoning framework BeSpaceD [8, 7]. XML code is generated and send to different devices for different stakeholders. The devices themself interpret the generated code, thereby triggering the display of relevant, typically stakeholder, location and device specific information.
Our collaborative engineering framework is scalable, it may be deployed in a massive parallel cloud environment or on a single laptop computer. The decision support comprising the BeSpaceD instantiations may also run on multiple virtual machines in parallel when serving different events.
In the smart energy systems case, we have a combination of both (i) longer term human triggered events, such as consulting requests and (ii) short term machine generated events, such as alarms in an automation facility or updates in weather data (for some forms of renewable energy). The decision support component is instantiated by customizable rules that encode the business logic. Rules can rely on additional data sources. Based on this, a response, view or recommendation is created. In case of smart energy systems, the XML encoded result is interpreted for multiple form-factors, e.g., a mobile device of an on-site technician or a command center. Such information can comprise the display of websites, control screens, camera views, annotated pictures, start of software or interactive models as shown at the bottom of the figure.
Collaborative engineering and its SmartSpace decision support instantiation is realized using rules, encoded as customized components. In discussions with stakeholders, we have identified the following goals with respect to operation:
-
1.
Classification and prioritization of events. In the case, where we are dealing with a large number of events arriving in a short time interval, human operators may be overwhelmed by coping with the details of many events. We are interested in providing ways for domain experts to customize the priority and presentation of event triggered information.
-
2.
Customization of decision support rules. Human stakeholders may need different information based on their roles and locations. For example, a service technician on-site may be concerned with the immediate replacement of a damaged solar panel. On the other hand support staff in a service center may be interested in gathering data on failure modes and rates. Our decision support rules allow the stakeholder specific filtering and processing of information as well as the generation of stakeholder specific responses such as visualizations.
-
3.
Runtime Adaptation. Adding and removing of decision support rules on the fly in the running system is a goal of our framework. For example, decision support systems must be able to adapt to changes in the infrastructure, such as being able to cope with new power lines and power plants as well as new data sources. This may significantly change the required recommendations by the system, but changes should only have a small impact on the IT infrastructure of the running system.
I-C Example: Short-Term Decision Support for PV Panels
An example for short-term decision support comprises a platform for providing information including visualization of relevant information based on live-weather data. The live weather is streamed to our SmartSpace framework and analyzed. Rules are used to select relevant stakeholders and trigger the display of relevant notifications and processed information to them. The data analysis can reveal and predict shortages of electricity production in PV panels due to excessive rain-cloud coverage.
I-D Example: Identification of Weak-links
The second motivating example explains longer-term decision support. It comprises the identification of weak-links in electrical grids. The assessment of electrical grids in terms of the strength of the network and the identification of the weak links [38] is a major topic of interest around the world. One can take a look at the current balance between existing electricity generation, future requirements for electricity generation and electrical loads. This is location dependent and may depend on the time of day. Various data sources can be combined for this analysis. This can lead to spatio-temporal models and a heat map like the one shown in Figure 3.
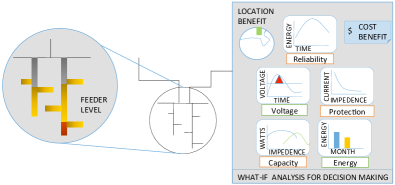
A plan to overcome the identified weak links can be developed once the analysis is concluded. One may consider the possibility of having various renewable energy sources distributed power generation or microgrids to strengthen the weak links. If we are analysing an electricity grid on an island, there is also possibility that the local microgrid is totally isolated from a main grid. The analysis for strengthening the weak links involves the consideration of electrical system across multiple parameters of energy needs, as well as reliability, voltage, and current as shown in Figure 3.
I-E Overview
The paper is structured as follows: We discuss related work in Section II and introduce our formal modeling and reasoning framework in Section III. The modeling and reasoning section also features the presentation of new operators and modeling constructs for our SmartSpace framework. Section IV discusses relevant data sources for decision support in the smart grid area and Section V presents our demonstrator. A conclusion is featured in Section VI.
II Related work
An overview on challenges and needs for Smart Grid systems is provided [18]. A variety of software approaches and related requirements on the networking and IT infrastructure [20] to support different aspects of smart grids and smart energy management have been established. Different techniques for demand side management have been outlined in [32]. Small grid sizes such as the electricity grid within an office building has been considered in [30]. Security and robustness can be an issue in smart energy systems, this has been discussed in [1]. Furthermore, operational needs for different energy sources need consideration. A focus on photo-voltaic operations relevant for our paper is studied in [29].
We complement the research done on smart grids/smart energy systems by concentrating on software support to manage these systems. in our work, we provide automatic decision support for human operators in a control room, or in the field by using a mobile form-factor. We build on the collaborative engineering framework as explained in the introduction and use a decision support component based on spatio-temporal models and reasoning. For this reason, our work is related to existing collaboration software in the industrial space such as Dassault Système’s Enovia [17] and Delmia [16] that focus on the visualization of production plants and allow the association of data with elements in the visualization. In addition, our framework relies on reasoning about semantic models and for this reason ontology-based approaches are also related. For example, existing approach can be based on semantic web technology (see [39]). Related to this, collaboration issues are studied in the ComVantage [37] project with a focus on a mobile enterprise reference framework for future internet operability. Some applications in the industrial automation context are featured. Another framework for collaborative requirements engineering is presented in [19].
Different approaches have been introduced for spatio-temporal modeling and reasoning. For describing models using logic work on process algebra-like formalisms has been conducted [12, 21]. Qualitative spatial descriptions and reasoning [2, 36, 15, 13] where spatial relationships are not described through exact geometry but rather using predicates for, e.g., describing that an entity is located close to another object are important for the BeSpaceD based abstractions. Other logic approaches to spatial reasoning can be found in [26, 43]. A comparison on semantic formalisms for industry 4.0, as well as guidelines to assist engineers on this topic is featured in [14]. Related to our BeSpaceD operators introduced in this paper, functional programming language features for large scale data operations are supported by frameworks such as Spark222http://spark.apache.org/. In comparison, in our work, we are specifically targeting operations for spatio-temporal models.
III BeSpaceD
Means for automatically analysing information and computing results for display to human stakeholders is a core functionality of our framework. We base our decision support for smart energy systems on spatio-temporal models that represent ontologies and data thereby assigning a semantical meaning to data and establishing relations between different artefacts.
BeSpaceD is our spatio-temporal modeling and reasoning framework: it comes as a general purpose modeling and reasoning framework. This means that applications are not limited to the smart-energy context. In the work presented in this paper, we use our BeSpaceD framework as:
-
•
a description language, for achieving formal models of facilities such as power plants, grids and relations between entities;
-
•
a format to store spatio-temporal data;
-
•
a way to reason about the formalized models and data by using BeSpaceD’s libraries.
In the following, we describe the modeling and data formalization language and the BeSpaceD-based reasoning library functionality. In addition, we provide some implementation background.
The BeSpaceD framework is implemented in the Scala programming language which is bytecode compatible with Java. This means, BeSpaceD’s core functionality runs in a Java environment. On one hand BeSpaceD-based services can be offered as cloud services using highly scalable infrastructure, on the other hand one can also run BeSpaceD locally on embedded devices that support a Java runtime environment. In addition to decision support systems for industrial automation and smart energy systems, we have successfully applied BeSpaceD for coverage analysis in the area of mobile devices [23] and for verification of spatio-temporal properties of industrial robots [25, 22, 4]. BeSpaceD has been integrated into a model-based development approach [27] and models of industrial operations have been part of our work [24] as well as applications to adaptive mobile systems [40].
III-A Modeling in BeSpaceD
Models in BeSpaceD are formalized as abstract data types. These are realized in BeSpaceD as Scala case classes which can be combined to form larger constructs to represent a model. The case classes are compatible with Java and “live” in the java runtime environment. Overall, the case class-based formalization provides a functional programming language feeling. To provide a look and feel, some of our language constructs (see also [3]) are provided in Figure 4. At the core of our modeling language, an Invariant is the basic logical entity and is supposed to hold for a system. Despite this, invariants can and typically do, contain conditional parts. For example, a logical formula can be part of the overall invariant, but require a precondition to hold, such as a point in time implying a state of a system. Following the abstract data type concept, constructors for basic logical operations connect invariants to form a new invariant.
Examples for basic logic operators
case class OR (t1 : Invariant, t2 : Invariant) extends Invariant;
case class AND (t1 : Invariant, t2 : Invariant)  extends Invariant;
case class NOT (t : Invariant) extends Invariant;
case class IMPLIES (t1 : Invariant, t2 : Invariant)  extends Invariant;
case class TRUE() extends ATOM;
case class FALSE() extends ATOM;
Examples for time predicates
case class TimePoint [T] (timepoint : T) extends ATOM;
case class TimeInterval [T](timepoint1 : T, timepoint2 : T) extends ATOM;
Events and Ownership
case class Event[E] (event : E) extends ATOM;
case class Owner[O] (owner : O) extends ATOM;
Examples for spatial predicates
case class OccupyBox (x1 : Int,y1 : Int,x2 : Int,y2 : Int) extends ATOM;
case class Occupy3DBox (x1 : Int, y1: Int, z1 : Int,
             x2 : Int, y2 : Int, z2 : Int) extends ATOM;
case class OccupyPoint (x:Int, y:Int) extends ATOM
Topology, Graphs
case class Edge[N] (source : N, target : N) extends ATOM
case class Transition[N,E] (source : N, event : E, target : N) extends
ATOM
In the Figure 4, the first part provides operators from propositional logic (e.g., AND, OR). The second part provides predicates for time such as TimePoint and TimeInterval. The third part allows the specification of events and ownership of logical entities. Ownerships are used to associate time and space with specific entities. The fourth part provides constructs for space, in particular geometry. The OccupyBox predicate refers to a rectangular two-dimensional geometric space which is parameterized by its left lower and its right upper corner using a cartesian coordinate system. The fifth part provides constructs for the specification of mathematical graphs using edges and state transition systems using transitions. In the design of domain specific languages, the question whether to make a construct a first class citizen of the language, e.g., by providing a separate constructor or to integrate it into another construct (e.g., as a parameter) is a challenging decision. In our work, we are concentrating on spatio-temporal aspects and the concept of ownership in space and time. We found this useful in the industrial automation and smart energy domains. The choice of our language constructs simplify the translation and validation of requirements dealing with time and space into BeSpaceD.
A concrete BeSpaceD example is provided below. The following BeSpaceD formula expresses that the rectangular two-dimensional geometric space with the upper-left corner point and the lower-right corner point is subject to a semantic condition AreaOfImpact between integer-defined time points and .
...
  IMPLIES(AND(TimeInterval(t1,t2),
               Owner("AreaOfImpact")),
      OccupyBox(145,4056,1536,2609))
...
The AreaOfImpact is a semantic condition using the ownership predicate and can be replaced with a more concrete identifier, for example by an indicator for a rain-cloud or a solar panal on a weather map.
By combining the different constructors, BeSpaceD formula can be constructed to formalize relevant information for our demonstrators. Examples include average UV intensity in an area, specification of capacity and location of power-lines, typical power consumption and generation in an area (parameterized by time). Specifications can get long and can easily comprise a few 1000 interconnected data-elements. Data can be imported while the system is running. This enables the possibility to process live streamed data and integrate it into the decision process. Although the Java-based memory representation of case classes can be efficient, for import and export and optimization of processing time, we have developed different JSON and XML-based formats for storing the data.
III-B Reasoning in BeSpaceD
While models describe systems and data, we also need ways to retrieve information from them, deduct implications, thus reason about them. For this reason, BeSpaceD comprises library-like functionality to handle specifications. Our library provides means for the efficient analysis of BeSpaceD formulas: Among other aspects, the functionality comprises, ways of abstraction, filtering and efficient processing of information. Since BeSpaceD’s focus is on spatio-temporal reasoning, a variety of operators filter and abstract time and space. An example of breaking down a complex task to several simpler tasks is the transformation of geometric constraints on areas into geometric constraints on points. Several implementations exist in BeSpaceD, each one has different operational characteristics.
III-C Interacting with the Runtime System
BeSpaceD needs to interact with its runtime system for importing and exporting data and interacting with other tools and parts of the SmartSpace Framework. Various ways to import and visualize information are supported. Examples comprise the import and export of information from/into databases, but also the collection of information from sensors and the conversion into BeSpaceD data structures. This can rely on streaming.
In addition, we have connected tools such as an external SMT solvers (e.g., we have a connection to z3 [31]) for external processing of some information. SMT solvers can help to resolve geometric constraints such as deciding whether there is an overlapping of different areas in time and space. Functionality that deals with filtering of datatypes, normalization and spatio-temporal fold operations are especially critical for our SmartSpace framework. Some of this is available in general BeSpaceD framework, but the folding functionality has been implemented specifically with SmartSpace in mind.
The connection to the SmartSpace and collaborative engineering framework is typically done by automatically creating an individual Java virtual machine with a running BeSpaceD framework for each decision support request and retrieving the XML based results.
III-D Aggregating Information in Space and TIme
Operations aggregating information over space and time have been found useful for our smart energy systems work. The operators are described in detail in a technical report [6]. Figure 5 provides an abstract view of the aggregation of spatio-temporal data using fold operations.
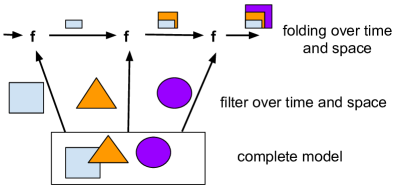
The so called folding aggregates data from larger data-structures by iterating over time and space intervals. Each iteration step looks at one particular interval. This is represented in the figure as a circle, square and triangle. This relevant information for each time and space interval is then processed using a user-defined operation: a function . The function takes the filtered result as well as the results of previous iteration steps and combines them. The folding operation provides a way to efficiently analyse larger data structures in the spatio-temporal continuum.
The signature template of a functional programming-style folding time function is provided below:
foldTime[A,T] (
   inv : Invariant, a: A,starttime : T,
   stoptime : T,step: T,
   f : (A -> Invariant -> A))
The function takes our spatio-temporal model, an invariant inv as its first argument. It takes an initial aggregation value a and calls itself recursively thereby iterating over a time window specified by starttime and stoptime using an iteration increase step. For example, the starttime could be 10 seconds, the stoptime 50 seconds, the step could be 5 seconds. In that case we would filter the values corresponding to 10, 15, 20, … , 50 seconds out of the model. The function selects all relevant information for the iterated time points and executes a function f on it. f depends on the use-case, for example, if we want to count the total solar power generation in an area, it could sum the values for different PV panels up. The function f does take an aggregated state value A. In our example, this could be the aggregated PV generation for previous time points. In summary, folding can be used to iterate over spatio-temporal information thereby filtering and aggregating information by using appropriate instantiations of f.
Similarily, the signature of the corresponding fold function for space is provided below:
foldSpace[A] (
  inv Invariant,z: A, startarea: Invariant,
  stoparea: Invariant, steparea: Invariant,
  f :(A -> Invariant -> A))
The analysis and aggregation of data is done using a path in space. From a startarea to a stoparea using a spatial increment steparea. Analog to time, we iteratively aggregate relevant information over space into A by applying a function f.
A main advantage of the folding functions is their genericity, since we can arbitrarily choose f. The functional approach is able to handle data in an efficient way: Compilers can automatically eliminate recursive calls, simplify the case class-based data-structures, and parallelization possibilities can be exploited much more easily than in standard imperative programming languages.
III-E Folding Smart-Grid Data
We have instantiated the fold operations for our spatio-temporal smart grid data. Here, we are looking at an example where rain-cloud coverage data is aggregated for different areas. We analyze moving rain-clouds based on live-weather radar data and can alert grid operators and support the assessment of possible implications on solar energy generation and grid load.
To give a look and feel, Figure 6 shows a simple instantiation of f. The aggregated value is the sum of all rain-cloud covered squares in a geometrical grid. The example proves that our general functionality can be instantiated to create customized rule handling for specific applications.
def addCloudyArea(total: Int, invariant: Invariant): Int =
{
  def isCloudyArea(owner: Owner[Any]): Boolean = owner == cloud

  def calculateArea(list: List[Invariant]): Int = {
    val areas: List[Int] = list map {
      inv: Invariant => inv match {
          case IMPLIES(owner: Owner[Any], point: OccupyPoint) =>
             if (isCloudyArea(owner)) 1 else 0
          case IMPLIES(owner: Owner[Any], AND(p1: OccupyPoint, p2: OccupyPoint)) =>
             if (isCloudyArea(owner)) 2 else 0
          case IMPLIES(owner: Owner[Any], BIGAND(points: List[OccupyPoint])) =>
             if (isCloudyArea(owner)) points.length else 0
          case _ => 0
        }
    }
    areas.sum
  }

  val area = invariant match {
    case AND(t1, t2) => calculateArea(t1 :: t2 :: Nil)
    case BIGAND(sublist: List[Invariant]) => calculateArea(sublist)
    case _ => 0
  }

  total + area
}
IV Smart Energy Relevant Data
We provide an overview on relevant data sources for smart energy systems in this section. With the advent of advanced mapping techniques, Geographical Information Systems (GIS), and progress in visualization, new data sets and means for the classification of data relevant for smart energy systems have been created. Most importantly open data is frequently made available by governments or authentic agencies and major parts of relevant data is accessible as open datasets across many countries. In many cases the information is of a spatio-temporal nature. This means information is associated to a location, i.e., identified by spatial coordinates, for example in terms of latitude and longitude as well as time. We have identified a listing of relevant data sources to be of particular relevance for our cause. It can be found in Table I.
| Relevant datasets for Australia | |
|---|---|
| Australian Bureau of Meteorology | http://www.bom.gov.au/ |
| AREMI | http://www.ga.gov.au/scientific-topics/energy/resources/other-renewable-energy-resources/solar-energy |
| https://data.gov.au/dataset/smart-grid-smart-city-customer-trial-data | |
| Relevant datasets for for India | |
| Bhuvan (website) | http://bhuvan.nrsc.gov.in/ |
| https://data.gov.in/catalog/estimated-renewable-energy-potential#web_catalog_tabs_block_10 | |
| https://en.openei.org/datasets/dataset?sectors=smartgrid | |
| Relevant datasets for for South Africa | |
| Open Energy Database | http://opened.netgen.co.za/ |
| Relevant datasets for for the US | |
| http://www.nrdc.org/energy/renewables/energymap.asp | |
| http://www.nrel.gov/gis/maps.html | |
| https://www.data.gov/energy/ | |
| Additional Open Data/Source Initiatives | |
| OpenEnergyMonitor | https://openenergymonitor.org/emon/ |
| Open Energy Data | http://energy.gov/data/open-energy-data |
In some cases the information is superimposed on the country’s map. This is observed in case of data from India which is connected to Bhuvan (Indian Geo-Platform, see table), and Australian data, connected to AREMI: the Australian Renewable Energy Mapping Infrastructure (see table). Here, mapping is done over a national map. Other sources of datasets include Open Energy Database from South Africa, while Energy.gov and Data.gov expose open data from the US. Furthermore, there are open initiatives and open source approaches that we have investigated methods for calculation or estimating the benefits of renewable power are made available in addition to the data sets by the National Renewable Energy Laboratory (NREL) 333http://www.nrel.gov/analysis/data_resources.html. The datasets in data.gov.in include assessment of existing electricity generation. This is updated year by year. Data.gov.in also provides an API. In addition sources in the XML, XLS, CSV, JSON and JSONP formats are supported for the datasets. The datasets in AREMI include information about existing sources of energy such as coal based, geothermal, petroleum based, nuclear, as well as renewable sources (e.g., hydro, solar, ocean energy, wind, and bio energy sources). Furthermore, there are initiatives like OpenEI that also support APIs such as the CANData API for exposing information (e.g., fuel economy rate, cost of renewable energies, and irradiance). For our demonstrator we also rely on live weather data from the Australian Bureau of Meteorology which is pulled by our framework using the HTML protocol.
Possible Usages for Long-term Decision Support
For the longer term decision support, the presented datasets are typically used for techno-commercial analysis to investigate how weak links in grids can be strengthened in a location or area. We identify relevant locations and look at the existing generation in their proximity. As a second step, we connect to the irradiance information and weather conditions and infer the possibility of a certain mix of renewable sources to be integrated in that location. Based on the strength of renewable energy potential at the location, for example irradiance for solar, speed of wind for wind, the possible annual generation can be calculated as a third step. By using this information, cost and incentives for renewable in the location, the Return On Investment (ROI) and the Pay Back Period (PBP) for a new concept can be easily deduced as the final result of our analysis. Overall we derive the benefits of applying new energy concepts and get an understanding whether a proposed concept will satisfy the energy needs of the weak links in the grid. In addition, an understanding of local weather conditions provides input on the variability (time of day, time of year, probability distributions) of the renewable energy sources. We learn about potential implications regarding the amount of reliable power that one needs to provide and get an understanding on petroleum and non-renewable basic energy needs for a location. This leads to a suggestion on a possible mix of different energy sources.
V The SmartSpace Demonstrator
We have built a demonstrator for our short-term decision support scenario. It is based on the ingredients described in the previous sections. Our demonstrator realizes the architecture shown in Figure 2. The BeSpaceD-based decision support is triggered by regularly recurring feeds of live weather data from the Australian Bureau of Meteorology. The live weather data is converted into BeSpaceD models. Furthermore, the BeSpaceD language is used to describe rules and models for our smart-grid system. Rules can be changed, added and removed. This is done by using the Scala/Java-based development and runtime environment. We have experimented with a variety of rules. One is provided below and realized using assumption:
cloud coverage filtered by area1 threshold
…
cloud coverage filtered by area2 threshold
critical solar energy level
The rule is given in a very abstract specification level and has the following form: a condition implies (triggers) a reaction. In the case above, and are timepoints. Thus, the first line specifies a time interval. The area1 .. area2 construct specifies spatial areas. For example regions on a map identified by their x– and y–coordinates. The cloud coverage is calculated for these areas and if it is above or equal a threshold a critical solar energy level is assumed to be present. The critical solar energy level triggers a reaction. Thus, based on rain-cloud coverage in some areas stakeholders can be informed through the reaction. The implementation of the rules is written in a less abstract style. In our case, the specification how the filtering of an area is done by using the constructs introduced in the previous sections in BeSpaceD. The above rule is relatively simple. A system can comprise a multitude of rules. In addition, one also needs to specify the triggered reactions, i.e.., XML code. This XML code is then interpreted and triggers a visualization. In addition to the Australian Bureau of Meteorology data, other data sources can be used in our rules as described in Section IV.
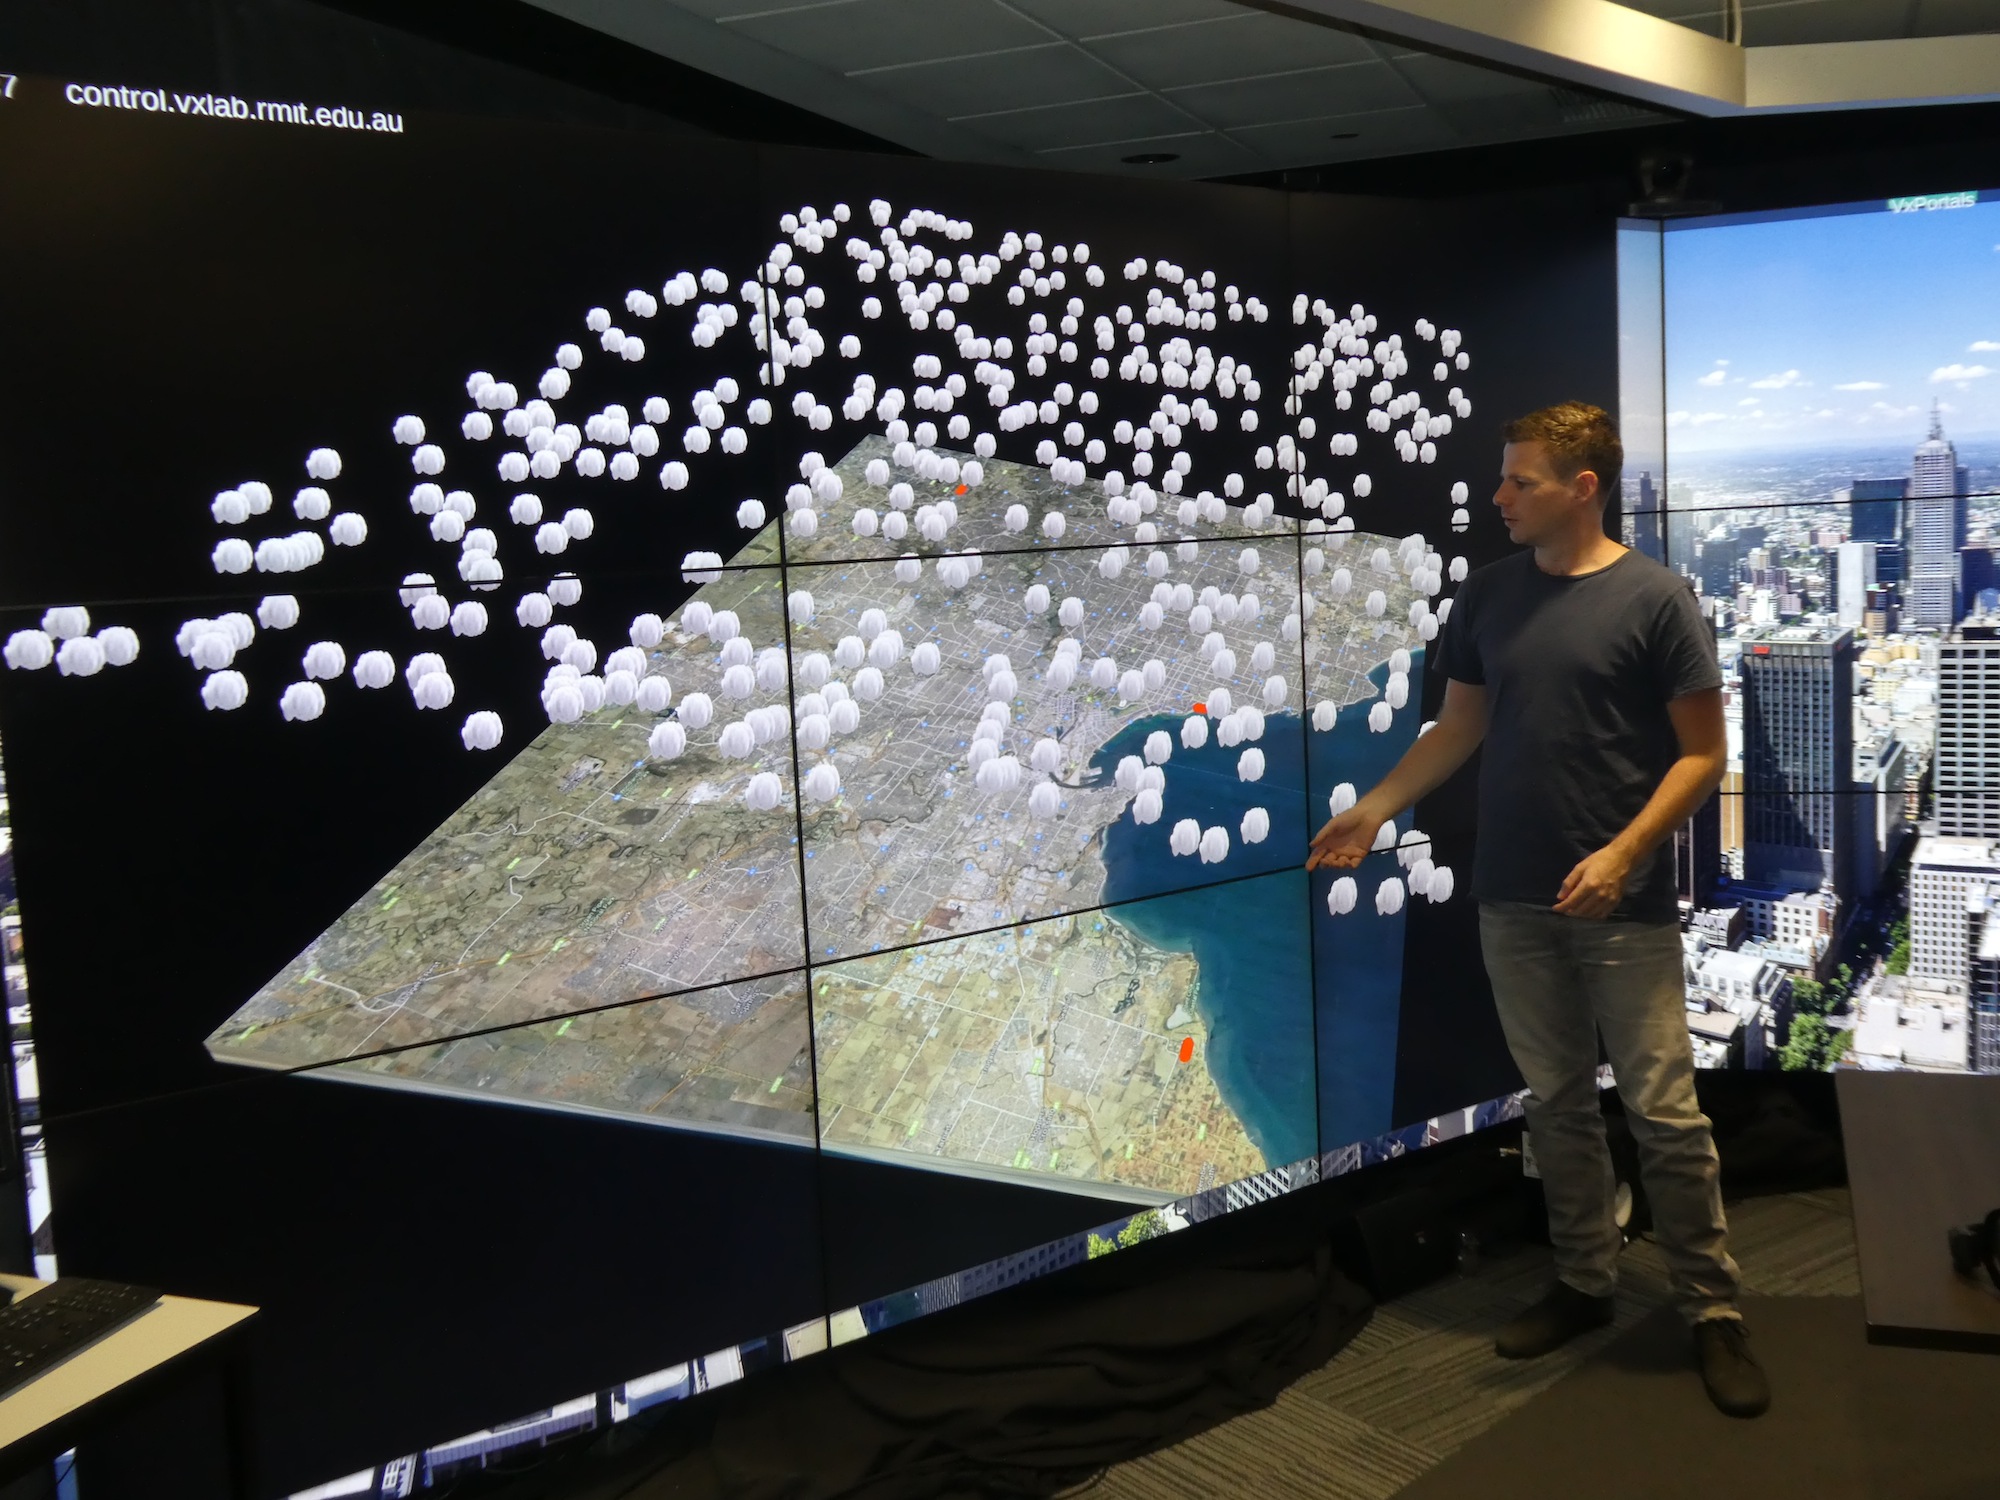
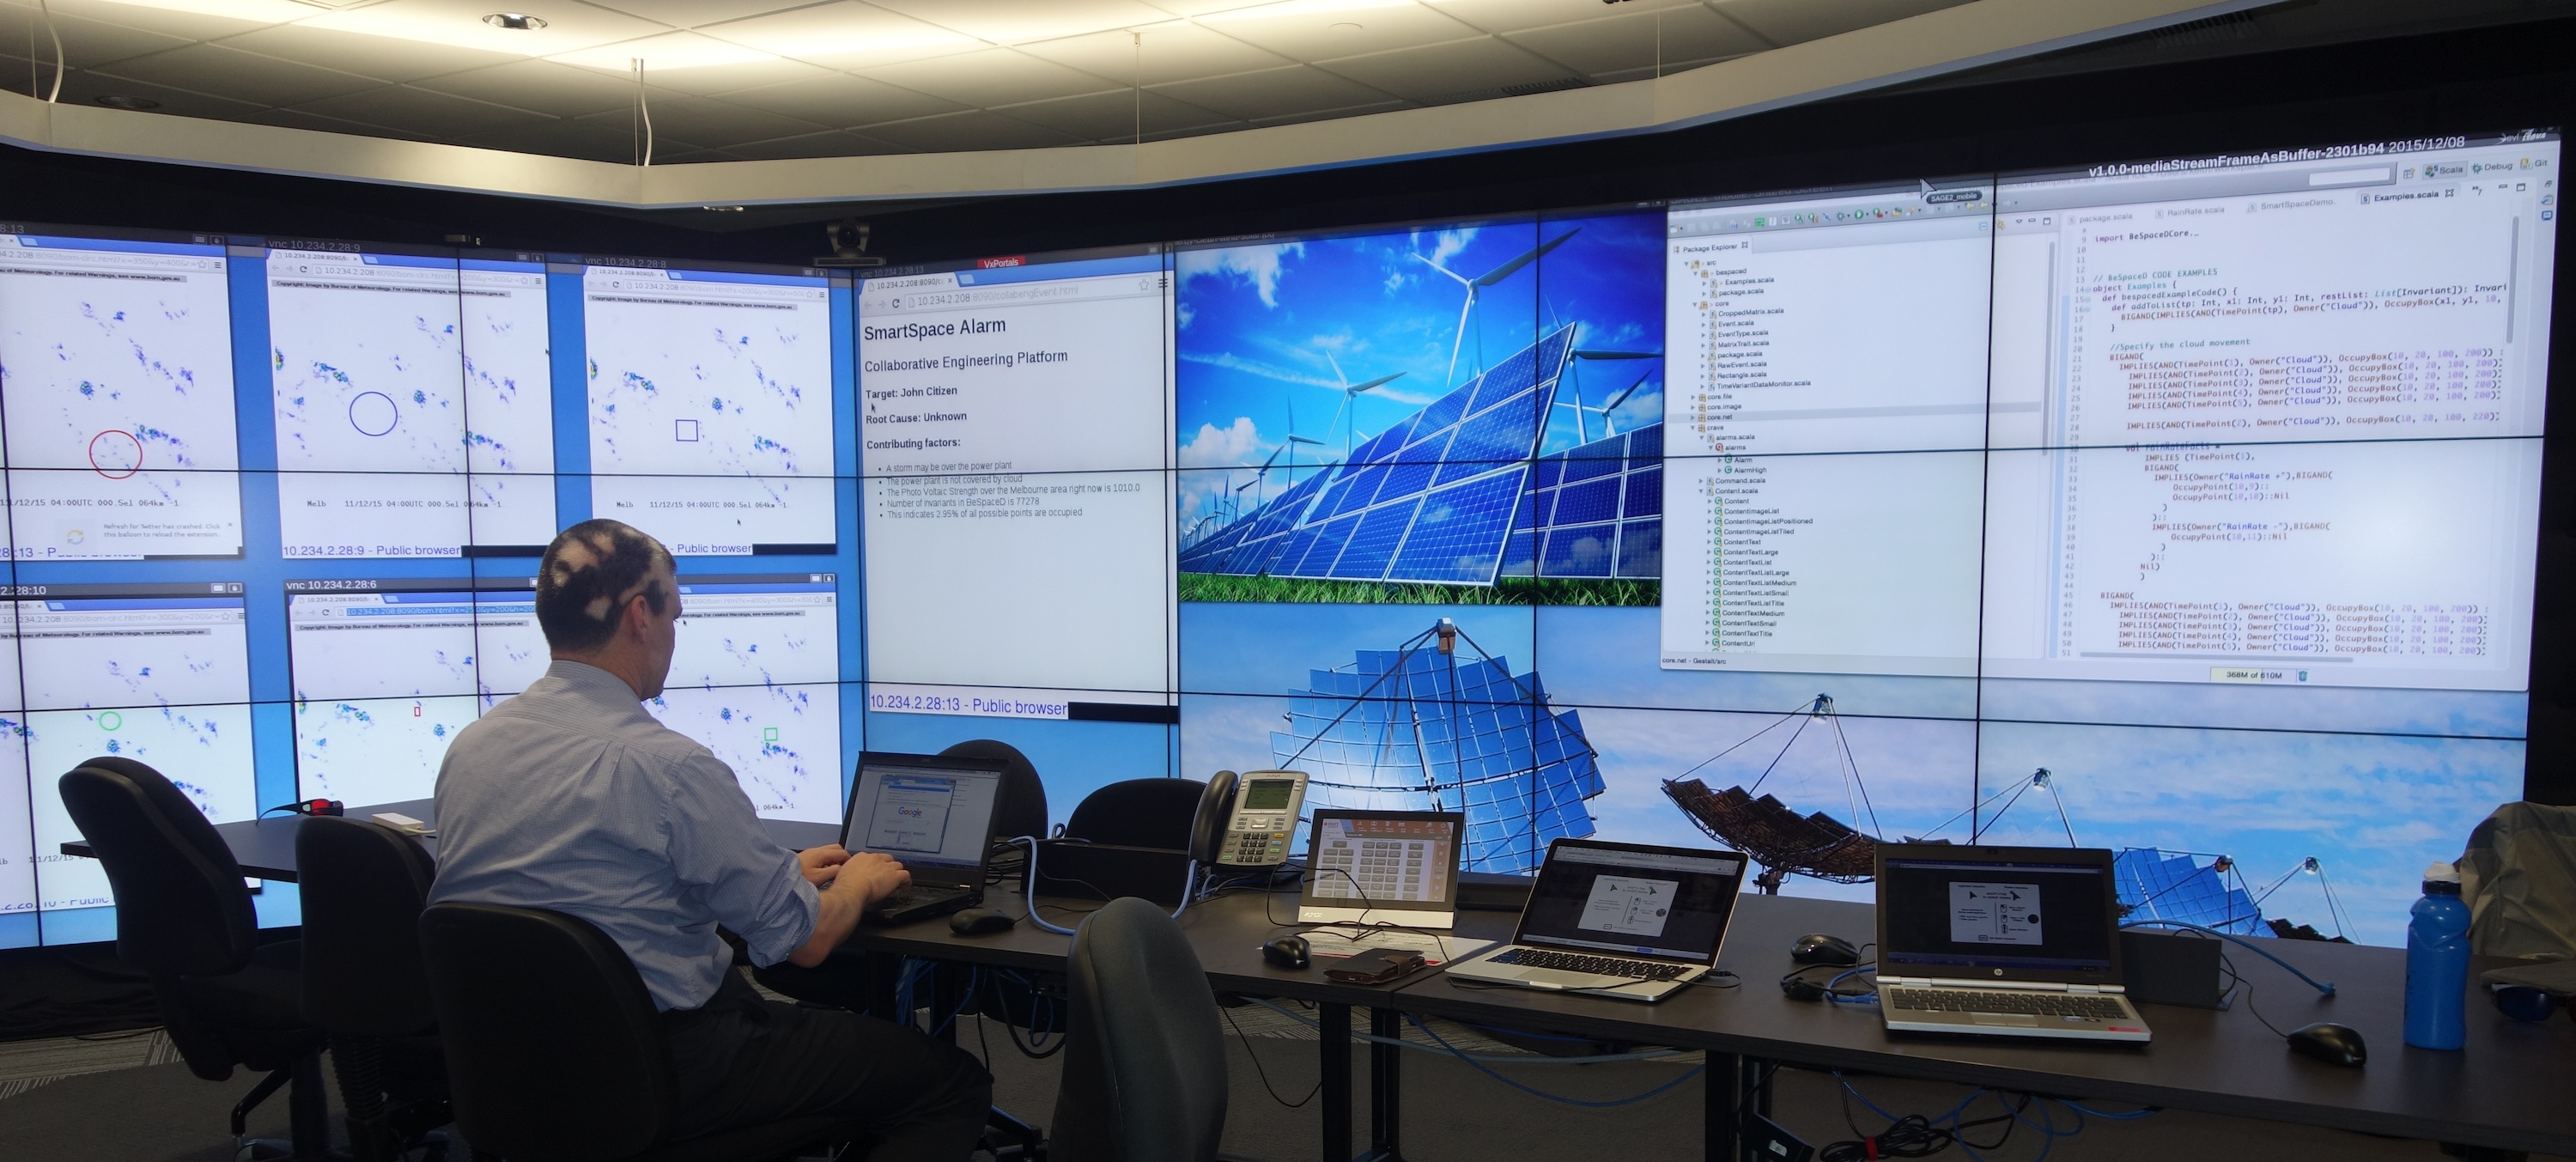
Figure 7 provides two examples of triggered reaction using the SmartSpace Framework. The first picture shows the use of the SmartSpace3D [35] frontend. This view can be triggered through the described framework. The 3D visualization of relevant objects is based on the BeSpaceD language. In the picture, information on rain-cloud coverage, their position in space and locations of power plants (red dots) are contained. The generated 3D view can be animated by adding time information to the rain-cloud positions in BeSpaceD and a head-tracking device can be used to change the views automatically based on the position of humans in front of the screen.
The second picture shows multiple windows with information triggered through the SmartSpace framework, such as rain-coverage information plus augmented data such as highlighting regions of interest indicated by geometric shapes. Both, the SmartSpace and SmartSpace3D demonstrators feature a large visualization wall which is made up of several coupled monitors [9]. The windows can be resized and moved freely across the wall [33]. The decision support can also comprise information on where to put a window on the wall, another feature for the user interface. The XML code containing the visualization information and the infrastructure from this builds on our collaborative engineering framework and has been described in [10]. Another form factor that connects to our framework is described in [34]. Here, an augmented reality solution for mobile devices connecting to our framework is presented.
VI Conclusion
In this paper, we have presented SmartSpace, a prototype platform for decision support in the smart energy systems. We have explained our decision support component BeSpaceD and its operators which have been implemented to support SmartSpace. BeSpaceD is able to provide means to customize decision support rules and allows for an abstraction of events. Our SmartSpace framework is also able to allow changes to the rules on-the fly by using the underlying Scala/Java infrastructure. In addition, we have motivated and highlighted the context of our work. We discussed sources of publicly available data and have realized and discussed a demonstrator in this paper.
Different directions for future work are of interest to us.: (i) By concentrating on the area of domain specific languages one could get an even more comprehensive front-end for describing our decision support rules and the underlying models. This could improve usability and one could imagine to investigate the human factors of automated decision support. (ii) The integration of more data sources into our demonstrator is another topic we are working on. (iii) The study of agent-based approaches for reacting to incidents is another area of interest. Despite that, in our current work we are primarily concerned with assisting human stakeholders, not replacing them. (iv) The advancement of our BeSpaceD framework is another recurring goal.
Acknowledgement
The authors would like to thank Ian Peake from VxLab and Ed Watkins for their support during the implementation of the SmartSpace project.
References
- [1] Amin, S. M., & Wollenberg, B. F. (2005). Toward a smart grid: power delivery for the 21st century. Power and energy Magazine, IEEE, 3(5), 34-41.
- [2] B. Bennett, A. G. Cohn, F. Wolter, M. Zakharyaschev. Multi-Dimensional Modal Logic as a Framework for Spatio-Temporal Reasoning. Applied Intelligence, Volume 17, Issue 3, Kluwer Academic Publishers, November 2002.
- [3] J. O. Blech. An Example for BeSpaceD and its Use for Decision Support in Industrial Automation. CoRR abs/1512.04656 (2015). http://arxiv.org/abs/1512.04656
- [4] J. O. Blech and Peter Herrmann. Behavioral Types for Space-aware Systems. Model-based Architecting of Cyber-Physical and Embedded Systems. CEUR proceedings, vol. 1508, 2015.
- [5] Jan Olaf Blech, Lasith Fernando, Keith Foster, Abhilash G and Sudarsan Sd. Spatio-temporal Reasoning and Decision Support for Smart Energy Systems. Emerging Technologies and Factory Automation (ETFA), IEEE, 2016.
- [6] Jan Olaf Blech, Keith Foster. Operators for Space and Time in BeSpaceD. CoRR abs/1602.08809 (2016) http://arxiv.org/abs/1602.08809
- [7] J. O. Blech and H. Schmidt. BeSpaceD: Towards a Tool Framework and Methodology for the Specification and Verification of Spatial Behavior of Distributed Software Component Systems. In arXiv.org, http://arxiv.org/abs/1404.3537, 2014.
- [8] J. O. Blech and H. Schmidt. Towards Modeling and Checking the Spatial and Interaction Behavior of Widely Distributed Systems. In Improving Systems and Software Engineering Conference, 2013.
- [9] J. O. Blech, M. Spichkova, I. Peake, H. Schmidt. Cyber-Virtual Systems: Simulation, Validation & Visualization. Evaluation of Novel Approaches to Software Engineering. Lisbon, ISBN 978-989-758-030-7, pages 218-225, 2014.
- [10] Jan Olaf Blech, Ian Peake, Heinz Schmidt, Mallikarjun Kande, Akilur Rahman, Srini Ramaswamy, Sudarsan SD, Venkateswaran Narayanan. Efficient Incident Handling in Industrial Automation through Collaborative Engineering. Emerging Technologies and Factory Automation (ETFA), IEEE, 2015.
- [11] J. O. Blech, I. Peake, H. Schmidt, M. Kande, S. Ramaswamy, Sudarsan SD., and V. Narayanan. Collaborative Engineering through Integration of Architectural, Social and Spatial Models. Emerging Technologies and Factory Automation (ETFA), IEEE Computer, 2014.
- [12] L. Caires and L. Cardelli. A Spatial Logic for Concurrency (Part II). Theoretical Computer Science, 322(3) pp. 517-565, September 2004.
- [13] J. Chen, A. G. Cohn, D. Liu, S. Wang, J. Ouyang, and Q. Yu. A survey of qualitative spatial representations. The Knowledge Engineering Review, 30(01):106–136, 2015.
- [14] Chih-Hong Cheng, Tuncay Guelfirat, Christian Messinger, Johannes O. Schmitt, Matthias Schnelte, Peter Weber: Semantic degrees for Industrie 4.0 engineering: deciding on the degree of semantic formalization to select appropriate technologies. Proceedings of the 2015 10th Joint Meeting on Foundations of Software Engineering Pages 1010-1013, ACM, 2015.
- [15] A. G. Cohn and S. M. Hazarika. Qualitative spatial representation and reasoning: An overview. Fundamenta informaticae, 46(1-2):1–29, 2001.
- [16] DS DELMIA V6R2013x – Fact Sheet: 3DEXPERIENCES of Global Production Systems for all stakeholders in the extended supply chain. Dassault Systèmes 2013.
- [17] ENOVIA V6R2013x – Fact Sheet. Dassault Systèmes 2013
- [18] Hassan Farhangi. The path of the smart grid. IEEE Power and Energy Magazine, vol 8., issue 1, 2010.
- [19] S. Ghosh, A. Dubey, S. Ramaswamy. C-FaRM: A Collaborative and Context Aware Framework for Requirements Management”, 4th International Workshop on Managing Requirements Knowledge, 19th IEEE International Requirements Engineering Conference, August 30th 2011, Trento Italy.
- [20] Vehbi C. Gungor, Dilan Sahin, Taskin Kocak, Salih Ergut, Concettina Buccella, Carlo Cecati, and Gerhard P. Hancke. Smart grid technologies: communication technologies and standards. Transactions on Industrial informatics, vol. 7, no. 4, pp. 529-539, IEEE, 2011.
- [21] S. Haar, S. Perchy, C. Rueda, F. Valencia. An Algebraic View of Space/Belief and Extrusion/Utterance for Concurrency/Epistemic Logic. Principles and Practice of Declarative Programming, 2015.
- [22] F. Han, J. O. Blech, P. Herrmann, H. Schmidt. Towards Verifying Safety Properties of Real-Time Probabilistic Systems. Formal Engineering approaches to Software Components and Architectures, 2014.
- [23] F. Han, J. O. Blech, P. Herrmann, H. Schmidt. Model-based Engineering and Analysis of Space-aware Systems Communicating via IEEE 802.11. COMPSAC, IEEE, 2015.
- [24] James Harland, Jan Olaf Blech, Ian Peake, Luke Trodd. Formal Behavioural Models to Facilitate Distributed Development and Commissioning in Industrial Automation. Evaluation of Novel Approaches to Software Engineering (ENASE), COLAFORM Track, ISBN 978-989-758-189-2, pages 363-369, ScitePress, 2016.
- [25] P. Herrmann, J. O. Blech, F. Han, and H. Schmidt. A Model-based Toolchain to Verify Spatial Behavior of Cyber-Physical Systems. Asia-Pacific Services Computing Conference (APSCC), 2014.
- [26] D. Hirschkoff, É. Lozes, D. Sangiorgi. Minimality Results for the Spatial Logics. Foundations of Software Technology and Theoretical Computer Science, vol 2914 of LNCS, Springer, 2003.
- [27] Simon Hordvik, Kristoffer Oseth, Jan Olaf Blech, Peter Herrmann. A Methodology for Model-based Development and Safety Analysis of Transport Systems.Evaluation of Novel Approaches to Software Engineering, 2016
- [28] Krzysztof Iniewski. Smart Grid Infrastructure & Networking. McGraw-Hill, 2012.
- [29] H. Kanchev, D. Lu, F. Colas, V, Lazarov & B. Francois. Energy management and operational planning of a microgrid with a PV-based active generator for smart grid applications. Transactions on Industrial Electronics, 58(10), pp. 4583-4592, IEEE, 2011.
- [30] D. Koß, D. Bytschkow, P. K. Gupta, B. Schätz, F. Sellmayr, S. Bauereiß. Establishing a smart grid node architecture and demonstrator in an office environment using the soa approach. Proceedings of the First International Workshop on Software Engineering Challenges for the Smart Grid, IEEE, 2012.
- [31] L. De Moura, N. Bjørner. Z3: An efficient SMT solver. In Tools and Algorithms for the Construction and Analysis of Systems (pp. 337-340). Springer, 2008.
- [32] Peter Palensky and Dietmar Dietrich.Demand side management: Demand response, intelligent energy systems, and smart loads. Transactions on industrial informatics, vol. 7.3, pp. 381-388, IEEE, 2011.
- [33] Ian Peake, Jan Olaf Blech, Lasith Fernando, Heinz Schmidt, Ravi Sreenivasamurthy and Sudarsan Sd. Visualization Facilities for Distributed and Remote Industrial Automation: VxLab. Emerging Technologies and Factory Automation (ETFA), IEEE, 2015.
- [34] Ian Peake, Jan Olaf Blech and Matthew Schembri. A Software Framework for Aug- mented Reality-based Support of Industrial Operations. Emerging Technologies and Factory Automation (ETFA), IEEE, 2016.
- [35] Ian D. Peake, Jan Olaf Blech, Edward Watkins, Stefan Greuter, Heinz W. Schmidt. The Virtual Experiences Portals – A Reconfigurable Platform for Immersive Visualization. 3rd International Conference on Augmented Reality, Virtual Reality and Computer Graphics (SALENTO AVR 2016), Springer, 2016.
- [36] D. A. Randell, Z. Cui, and A. G. Cohn. A spatial logic based on regions and connection. In Proceedings of the 3rd International Conference on Knowledge Representation and Reasoning, pages 165–176, 1992.
- [37] A. Salmen et al. ComVantage: Mobile Enterprise Collaboration Reference Framework and Enablers for Future Internet Information Interoperability. Future Internet, vol. 7858 of LNCS, Springer 2013.
- [38] Jeff Smith, Mathew Rylander, Lindsay Rogers, Roger Duan, “Its all in the Plans”, IEEE Power and Energy Society Magazine, 2015.
- [39] Y. Sure, M. Erdmann, J, Angele, S. Staab, R. Studer, and D. Wenke. OntoEdit: Collaborative ontology development for the semantic web. Springer Berlin Heidelberg, 2002.
- [40] Amir Taherkordi, Peter Herrmann, Jan Olaf Blech and Alvaro Fernandez. Service Virtualization for Self-Adaptation in Mobile Cyber-Physical Systems. International Workshop on Management of Service-Oriented Cyber-Physical Systems, Banff, Canada, 2016.
- [41] Monika Wenger, Alois Zoitl, Jan Olaf Blech, Ian Peake. Remote Monitoring Infrastructure for IEC 61499 Based Control Software. 8th International Congress on Ultra Modern Telecommunications and Control Systems, IEEE, 2016.
- [42] Monika Wenger, Alois Zoitl, Jan Olaf Blech, Ian Peake, Lasith Fernando. Cloud Based Monitoring of Timed Events for Industrial Automation. Automated Testing of Cyber-Physical Systems in the Cloud, IEEE, 2015.
- [43] S. Dal Zilio, D. Lugiez, C. Meyssonnier. A logic you can count on. Symposium on Principles of programming languages, ACM, 2004.