Stable Small Bubble Clusters in Two-dimensional Foams
Stable Small Bubble Clusters in Two-dimensional Foams
Kai Zhang,e, Chin-Chang Kuoa, Nathaniel Seea, Corey O’Hern,b,c,d, and Michael Dennin,∗a
aDepartment of Physics and Astronomy, University of California, Irvine 92697, USA
bDepartment of Mechanical Engineering & Materials Science, Yale University, New Haven, Connecticut 06520, USA
cDepartment of Applied Physics, Yale University, New Haven, Connecticut 06520, USA
dDepartment of Physics, Yale University, New Haven, Connecticut 06520, USA
eDepartment of Chemical Engineering, Columbia University, New York, New York 10027, USA
Received Xth XXXXXXXXXX 20XX, Accepted Xth XXXXXXXXX 20XX
First published on the web Xth XXXXXXXXXX 200X
DOI: 10.1039/b000000x
Key features of the mechanical response of amorphous particulate materials, such as foams, emulsions, and granular media, to applied stress are determined by the frequency and size of particle rearrangements that occur as the system transitions from one mechanically stable state to another. This work describes coordinated experimental and computational studies of bubble rafts, which are quasi-two dimensional systems of bubbles confined to the air-water interface. We focus on small mechanically stable clusters of four, five, six, and seven bubbles with two different sizes with diameter ratio . Focusing on small bubble clusters, which can be viewed as subsystems of a larger system, allows us to investigate the full ensemble of clusters that form, measure the respective frequencies with which the clusters occur, and determine the form of the bubble-bubble interactions. We emphasize several important results. First, for clusters with bubbles, we find using discrete element simulations that short-range attractive interactions between bubbles give rise to a larger ensemble of distinct mechanically stable clusters compared to that generated by long-range attractive interactions. The additional clusters in systems with short-range attractions possess larger gaps between pairs of neighboring bubbles on the periphery of the clusters. The ensemble of bubble clusters observed in experiments is similar to the ensemble of clusters with long-range attractive interactions. We also compare the frequency with which each cluster occurs in simulations and experiments. We find that the cluster frequencies are extremely sensitive to the protocol used to generate them and only weakly correlated to the energy of the clusters.
1 Introduction
One of the most important, open questions in condensed matter physics involves understanding the mechanical response of amorphous materials, which do not possess long-range positional or bond-orientational order. In crystalline materials, the mechanical response is well-described by the motion and interaction of topological defects, such as dislocations. In contrast, it is much more difficult to identify the relevant defects that control the mechanical response in amorphous materials 1. Disordered materials span a wide range of length scales from atomic systems, such as metallic glasses 2 and ceramics 3, to colloidal suspensions 4, 5, and macroscopic particulate materials, such as foams 6, 7, 8, 9, emulsions 10, and granular matter 11, 12, 13, 14.
There are several common features that characterize the mechanical response of disordered materials. For small strains, or applied stresses, these materials have an initial elastic-like response during which the stress is proportional to strain, particle-scale rearrangements are rare, and the system is essentially reversible upon increasing and decreasing the strain. Above a characteristic applied stress or strain, which is typically much smaller than that for crystalline materials, particle rearrangements begin to occur frequently, and the material effectively flows with large fluctuations in stress (or energy). Stress fluctuations are often characterized by periods of increasing stress followed by sudden decreases, referred to as stress drops 15, 16, 17, 18, 19 or avalanches 20. During flow, particle rearrangements can localize, which gives rise to shear banding 21, 22, 23, 24, 25.
Many theoretical descriptions of disordered solids have employed models that are relatively insensitive to the details of the particle interactions and have focused on the concept of flow defects to understand deformation of disordered materials during applied loading 26, 27. For example, shear transformation zone (STZ) theories describe the creation and annihilation of regions in a material that experience large non-affine particle displacements 28. STZ theories have been applied to a wide range of materials, including amorphous metals, colloidal glasses, and earthquake faults 28, 29, 30, 31, 32, 33, 34, 35, 36, 37. Similar descriptions include weak-zone and soft-spot theories, which attempt to identify regions in a material where non-affine deformation will occur due to mechanical instabilities 38, 39, 40.
Despite the successes of such theoretical descriptions, the influence of particle interactions on mechanical response can be significant, for example, when considering the structure and dynamics of foams. In two-dimensional (2D) dry foams, bubbles are polygonal and form a connected network of bubble edges. In this case, one can precisely define topological rearrangements (T1 events) associated with the switching of bubble neighbors, where one of the polygonal edges decreases to zero and then a new edge is created. T1 events can be isolated and localized, or occur as multiple, correlated rearrangements 41, 42. In fact, one event at a given location in the system at a given time can trigger another at a different location later in time. Theoretical descriptions of the mechanical properties of dry foams are typically formulated in terms of the activation of T1 and other topological events 43, 20, 15, 21, 7, 17, 22, 44, 23, 9, 12, 18.
In the wet-foam limit, bubbles do not form fully connected polyhedral networks and thus wet foams behave more like particulate media, which do not form confluent networks of interparticle contacts. However, bubble systems do possess attractive interactions, and thus each bubble is in contact with at least some of its neighbors 45. Particulate systems with purely repulsive interactions, such as dry granular media, possess a finite fraction of “rattler” particles, which are disconnected from the force-bearing network of contacts. Rattler particles complicate the mechanical response of disordered solids because they can intermittently join and exit the force-bearing backbone.
In this article, we describe a series of coordinated experimental and computational studies of the mechanically stable clusters that occur in bubble rafts, which are layers of mm-sized bubbles that float on the surface of water and mimic wet foams. These systems are mainly two-dimensional, which allows us to accurately determine the positions of bubble centers and contacts between bubbles. Another advantage of bubble rafts is that they are athermal (i.e. the forces generated from thermal fluctuations are small compared to surface tension), so that we can determine the mechanically stable clusters of small bubble clusters in the absence of thermal fluctuations. In addition, in contrast to other athermal systems such as granular media, bubble rafts do not possess static frictional interactions, for which enumeration of mechanically stable packings is much more difficult 46.
Attractive forces between bubbles include long- and short-range contributions. First, the bubbles deform the surface of the water, which creates a long-range capillary-like interaction 47, 48. However, the surface deformation and resulting form of the attractions depend on the number, size, and relative positions of the bubbles in a cluster. In addition to this long-range attractive force, the bubbles experience short-range interactions when bubbles come into contact arising from surface tension. Note that this interaction depends on the particular trajectories of interacting bubbles. For example, the interactions are different when bubbles are approaching each other compared to when they are moving away from each other.
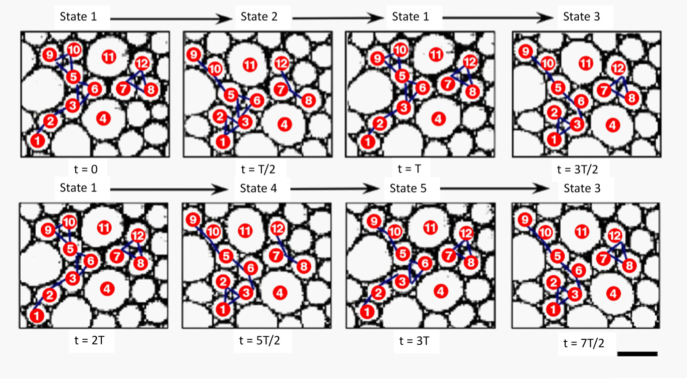
In previous work on bubble rafts 9, we characterized bubble rearrangements induced during cyclic shear in large systems in terms of the relative motions of bubbles in three-bubble clusters, as well as T1 events that involve four-bubble clusters. We showed that in bubble rafts, there are a number of bubble rearrangements that cannot be decomposed into a set of T1 events exclusively because they involve clusters of three bubbles with triangular or linear topologies. In Fig. 1, we show eight images at the turning points during applied oscillatory strain over cycles. The bubble configurations suggest defining four clusters of three small bubbles each. We label the bubbles in the four clusters with indexes, , , , and . During the cyclic shear, the three-bubble clusters transition between linear and triangular structures. If one considers more complex structures involving bubbles of different sizes, the linear and triangular three-bubble clusters form the basic building blocks for clusters of four, five, six, and larger bubble clusters.
Motivated by these preliminary studies, here we focus on small bubble clusters (, , , and ) with bubbles of two different sizes (identified as large (L) and small (S) with diameter ratio ). For a given , we vary the number of small and large bubbles, and , respectively, in each cluster in the range . For , we studied clusters with and . Focusing on small bubble clusters allows us to enumerate all mechanically stable clusters and calculate the frequency with which they occur in both experiments and simulations. We will compare three important quantities in experiments and simulations: (a) the number of distinct mechanically stable clusters; (b) bubble separations in each distinct cluster; and (c) the frequency with which each cluster occurs. For four- and five-bubble clusters, we observe that these three quantities are largely independent of the form of the bubble-bubble interactions. However, we find that the properties of six and larger bubble clusters depend on the range and strength of the bubble attractive interactions. Thus, the comparison of properties of mechanically stable six-bubble clusters in experiments and simulations allows us to calibrate the bubble-bubble interaction potential in bubble rafts.
The remainder of this article is organized as follows. In Sec. 2, we describe the experimental setup and methods employed to generate the bubble clusters. In Sec. 3, we describe the bubble-bubble interaction potential and protocol for generating the bubble clusters in simulations. In Secs. 4 and 5, we summarize the results from the simulations and experiments and discuss future research directions.
2 Experimental System: Bubble Rafts
Bubble rafts consist of a single layer of bubbles at the air-water interface. They represent the limit of wet foams and have been used to model defects in atomic solids 49, 50. Bubble rafts offer a number of advantages as an experimental system for studying bubble clusters. First, bubbles are formed individually by flowing compressed nitrogen gas through a thin needle into a bubble solution. The combination of needle size, flow pressure, and bubble depth gives precise control over the bubble size. For our work, we used a standard bubble solution consisting of DI water, glycerin, and bubble solution by volume. The bubble solution is Alkaline Liquid Detergent from Contrex. This mixture generates bubble rafts that are stable for - hours. We work with bubbles having diameters in the range from to a few mm. The ability to control the bubble size allows for the creation of monodisperse and bidisperse size distributions. The quasi-two dimensional nature of the system enables accurate tracking of all bubbles in the system.
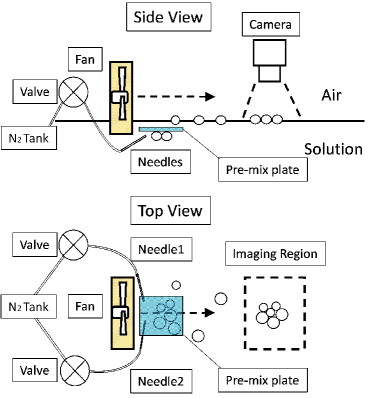
The experimental setup used to generate random clusters of bubbles is illustrated in Fig. 2. Our work has focused on clusters formed from bubbles with two sizes with diameter ratio . We employ two injection needles with different inner diameters to generate the two bubble sizes. The injection speed is controlled by the mass flow rate from the compressed nitrogen gas tank. By placing a cover slide between the needles and at the air-water interface, we create a mixing region that introduces randomness into the cluster formation process. Additional fluctuations are included by exposing the system to an air current using a computer-controlled fan with a time dependent on-off oscillation. Images of the clusters are captured down stream of the generation region and analyzed to determine the positions of all bubbles in the clusters.
We identified several key features of the experimental bubble cluster formation process. First, bubble clusters containing , , or bubbles commonly form directly outside the pre-mix plate region. These clusters immediately combine and rearrange to form new clusters with size . It is much rarer for initial clusters with to form directly near the pre-mix plate region. As we will show below, the protocol for bubble cluster generation can strongly affect the frequencies with which distinct mechanically stable clusters form. To vary the protocol, we considered two pre-mix plate regions with different areas: protocol with area and protocol with area . Unless noted otherwise, the reported results were obtained using protocol A. The different mixing geometries created an observable change in the frequencies of precursor clusters of size , which results in changes to the frequencies of larger bubble clusters.
3 Simulation Details
For bubble rafts undergoing confined shear flows, the assumption has been that only repulsive contact forces and viscous forces are necessary to describe their macroscopic response 43, 51. However, bubble-bubble adhesion and capillary forces 47, 48 can give rise to strong attractive interactions between bubbles. The role of attractive interactions in determining transitions between mechanically stable clusters, especially in the wet foam limit, has not been investigated in detail.
Here, we will model interactions between bubbles in bubble rafts using the generalized Lennard-Jones (LJ) pairwise potential:
| (1) |
When and (denoted as ), Eq. 1 reduces to the standard Lennard-Jones interaction potential:
| (2) |
where is the separation between the centers of bubbles and , , is the diameter of bubble , the minimum in the pair potential occurs at , and the energy parameters satisfy the mixing rule, , which follows the Johnson-Kendall-Roberts (JKR) theory for contact mechanics 52, 53. The total potential energy per bubble is given by . Energies, lengths, timescales, and temperatures are given in units of , , , and , respectively, where the Boltzmann constant and bubble mass are set to unity.
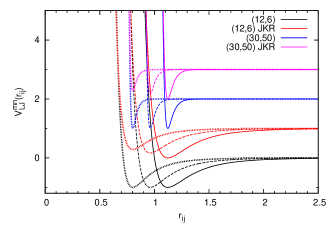
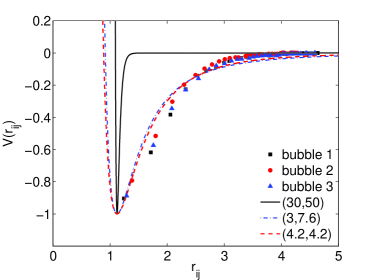
For the generalized LJ potential in Eq. 1, we fix the location of the minimum at , but change the exponents and to tune the width of the attractive well, , which is defined as the distance between the zero of the potential () and the inflection point of the attractive tail (). For the Lennard-Jones potential, the width , while it decreases to for larger values of and . This allows us to tune the interactions from long-range to short-range attractions . We can also independently vary the strength of the attractions by tuning . For these studies, we used and the JKR mixing rule , as well as stronger attractions with . For calculations of the inter-bubble forces and potential energy, we cut off the interactions beyond 54. We illustrate the long-range and short-range attractive potentials with and the JKR mixing rule in Fig. 3.
We use two protocols to generate bubble clusters in the simulations: (1) random initialization of all bubbles at once and (2) sequential addition of bubbles one by one in the simulation cell. In protocol , we initialize bubbles with random positions in a small simulation cell with velocities randomly chosen from a Gaussian distribution at temperature . We then decrease the temperature to zero linearly in time at different cooling rates . As , the bubbles (interacting via Eq. 1) aggregate into clusters. We employed protocol with both open boundaries and closed boundaries with repulsive walls. The only difference between the two boundary conditions is that bubbles in the system with the closed boundaries were more likely to form a single cluster.
In protocol (2), we insert one bubble at a time with kinetic energy at a random position into the simulation cell with closed boundaries. We then cool the system to zero temperature using a linear ramp with rate . The next bubble is inserted randomly into the simulation cell (without overlapping the previously placed, fixed bubble) and then the system is cooled to at rate . This process is continued until all bubbles have been inserted. We can vary the insertion sequence over all possible combinations of large and small bubbles at fixed and for a given . For example, for , , and , we consider , , , and insertion orders for the small and large bubbles.
For each protocol and , we performed a large number (for closed boundaries) or (for open boundaries) runs with different initial conditions. We also varied the cooling rate over two orders of magnitude: . After applying the linear cooling ramp to , conjugate gradient energy minimization was employed to ensure that the final clusters are mechanically stable. We distinguish the mechanically stable clusters using the networks of interparticle contacts and determine the frequency with which each distinct cluster occurs.
4 Results
We present the results in two sections. First, we focus on the structure (i.e. the arrangement and spacing between bubbles) of the mechanically stable clusters. To compare the distinct bubble clusters obtained in experiments and simulations, we define the distance in configuration space as , where gives the geometric center of bubble for a given cluster from experiments and simulations, respectively. Second, we consider the frequency with which each distinct cluster occurs. We compare the cluster frequencies from experiments and simulations for different interaction potentials and cluster-generation protocols.
4.1 Structure of mechanically stable clusters
We first describe the results for four- and five-bubble clusters. For these systems, we focus on combinations of large and small bubbles that can serve as precursor clusters for with three small and three large bubbles. In Figs. 4 and 5, we show the distinct mechanically stable clusters for (with , ; , ; and , ) and distinct mechanically stable clusters for (with , and , ) that are observed in both experiments and simulations. All of the and bubble clusters are isostatic with bubble contacts 55. Note that mechanically stable clusters must possess . For all forms of Eq. 1 that we studied, the simulations generate the same mechanically stable clusters for and same mechanically stable clusters for . The and clusters are compact such that all nearest neighbor bubbles are in contact with each other. The distance in configuration space between a given cluster obtained in experiments and that obtained in simulations is small, with .
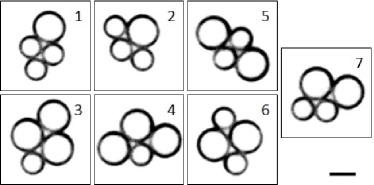
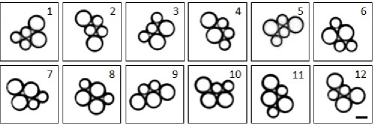
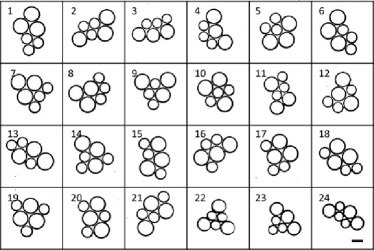
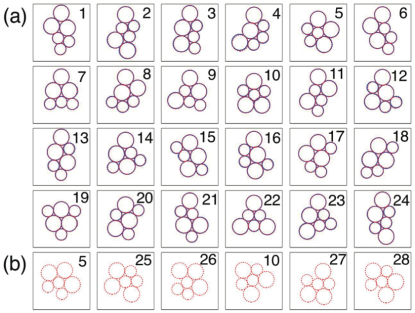
For , we observe distinct mechanically stable clusters (with and ) in the bubble raft experiments as shown in Fig. 6. In simulations (using protocol ), we also observe mechanically stable clusters that are similar to those observed in the experiments when we consider the long-range LJ potential with the JKR mixing rules (Fig. 7 (a)). In this case, of the clusters (- except and ) are isostatic with bubble contacts, however, clusters and are hyperstatic with bubble contacts. When the generalized LJ potential is tuned from long- to short-ranged attractive interactions, the structures of clusters and change significantly and four additional clusters (-) are generated (Fig. 7 (b)). The difference between cluster generated using the potential and cluster generated from the potential is that a gap opens between two small bubbles on the periphery of the cluster that were in contact for the potential. Similarly, two large bubbles that were in contact in cluster for the potential move apart in cluster for the potential. Clusters and ( and ) that occur for the potential are similar in structure to cluster (), with gaps between different pairs of bubbles on the periphery.
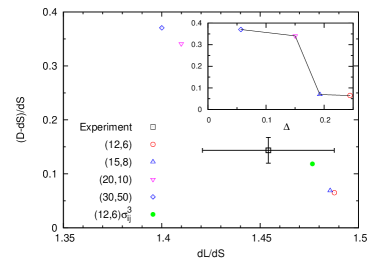
In Fig. 8, we compare images of bubble cluster obtained in experiments and simulations with long- and short-range attractions. We characterize the inter-bubble separations in Fig. 9, by plotting the normalized gap distance between bubbles and versus for cluster , where is the center-to-center distance between bubbles and and () is the center-to-center distance between two contacting small (large) bubbles. In the experiments, we find that the normalized gap distance is . In simulations using protocol and JKR mixing rules, the normalized gap distance is different for short- versus long-ranged attractive potentials. We find a relatively large normalized gap distance for short-range attractions ( and ), whereas for long-range attractions ( and ). As shown in the inset to Fig. 9, the normalized gap distance increases abruptly as the range of the potential is decreased below .
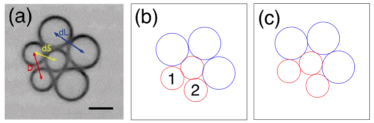
The normalized gap between bubbles and in cluster from experiments falls between the two extremes from simulations using short- and long-ranged attractions shown in the inset to Fig. 9, though it closer to the long-range values. Therefore, we also considered the impact of the interaction strength on the normalized gap. We find that increasing the interaction strength for the long-range potential moves the gap distance between bubbles and in cluster closer to the experimental value. (See the result for in Fig. 9.) In Fig. 8, we compare the images of cluster obtained from (a) experiments with cluster obtained from simulations with (b) long-ranged attractions ( and ) and (c) short-ranged attractions ( and JKR mixing rules).
To quantify the impact of the range and strength of the attractive bubble interactions on the structure of all bubble clusters, we computed the distance in configuration space between the clusters obtained from simulations using the and generalized Lennard-Jones potential and the clusters obtained in experiments (Fig. 6). We find that the distance in configuration space between each cluster obtained in simulations with long-range attractions and the corresponding cluster obtained in experiments satisfies , as shown in Fig. 10. In contrast, can be much larger when comparing the clusters from experiments those obtained from simulations using the short-ranged potential, e.g. for cluster .
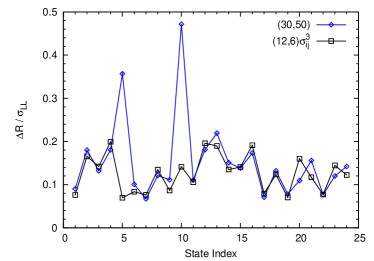
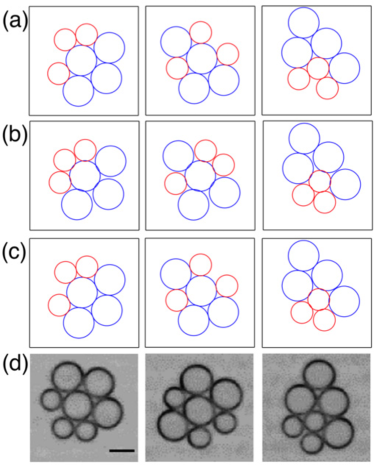
To further investigate the role of the bubble interaction potential on the types of mechanically stable bubble clusters that occur, we performed preliminary studies of clusters with and . We find that there are more than hundred distinct mechanically stable clusters for with and . For , we found that the simulations using the and potentials generated mechanically stable clusters that were the same. Two clusters had similar topologies for the and potentials, but those for the potential had more gaps between bubbles on the periphery of the clusters. In addition, the potential generated four clusters that were not found for the potential. (See Fig. 7.) For , we find increasing disparities in structure between the ensemble of mechanically stable clusters generated using the and potentials. For example, we find that the fraction of distinct bubble clusters that are the same for the and potentials decreases for . In Fig. 11, we show representative clusters for from simulations using the potential and the potential with the JKR and mixing rules. The clusters obtained from the short-ranged potential typically possess large gaps between small bubbles on the periphery (panel (a)). In contrast, clusters obtained from the long-ranged potential do not typically possess large gaps between bubbles on the periphery (panel (b)). For the potential with , there is a mixture of clusters with and without large gaps (panel (c)), which mimics the structure of the clusters found in experiments (panel (d)).
4.2 Frequency of mechanically stable clusters
In the previous section, we showed that the structure of the distinct mechanically stable bubble clusters in experiments was similar to the structure of the clusters generated from simulations using long-range attractive interactions. In this section, we will investigate to what extent the frequencies with which each distinct bubble cluster occurs is sensitive to the bubble interaction potential and the protocol used to generate the bubble clusters.
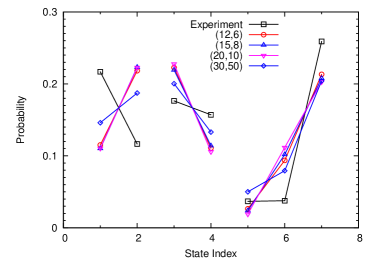
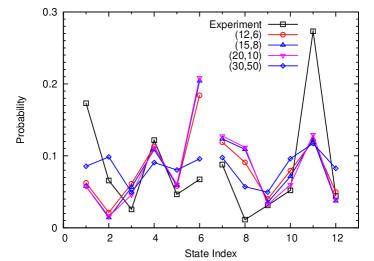
For and , the probabilities of the clusters obtained from both simulations (using protocol ) and experiments occur between and . (See Figs. 12 and 13.) One observes discrepancies for a few clusters (i.e. clusters and for and , , and for ). However, overall there is qualitative agreement between the probabilities obtained from the simulations and experiments, even though there are key differences in the cluster generation protocols. For the experiments, small initial bubble clusters are randomly generated and then they combine to form the and mechanically stable clusters. In contrast, protocol in the simulations involves randomly placing bubbles in the simulation cell and then cooling the system so that the bubbles form a single cluster.
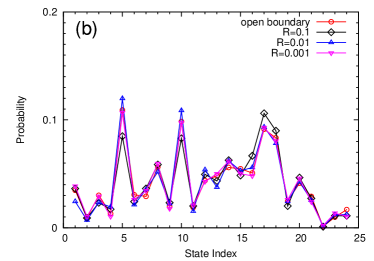
For , the cluster probabilities obtained from simulations do not change significantly as the potential is tuned from from long- to short-ranged . For , the cluster probabilities from the simulations become more equiprobable as the potential is tuned from long- to short-ranged, but the effect is modest. We find that the changes in the cluster probabilities are even smaller when we vary the cooling rate (using protocol ) over several orders of magnitude for and . (See Fig. 14 (b), where we show the effect of the cooling rate on the cluster probabilities for .) Thus, studies of the cluster probabilities for and do not allow us to determine which bubble interaction potentials and protocols implemented in simulations best match those in experiments.
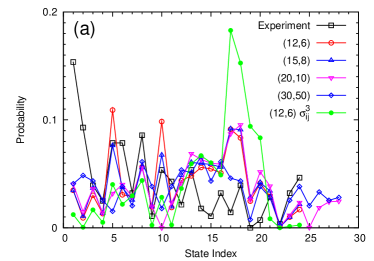
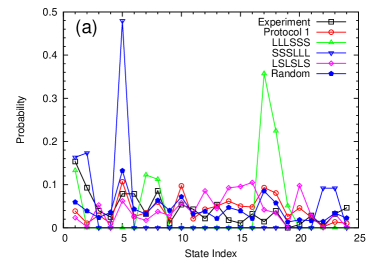
In Fig. 14 (a), we show the probabilities for the mechanically stable clusters (with and ) from experiments and simulations (using protocol ). In experiments, clusters , , , , and are highly probable, while clusters and are extremely rare. As discussed previously, the simulations with long-range attractions (i.e. and ) do not generate clusters -, whereas the simulations with short-range attractions (i.e. and ) do. For the simulations with JKR mixing rules, most clusters have probabilities between and . The cluster probabilities from the simulations with the potential and (using protocol ) possess a strong peak for clusters -, with smaller probabilities for other clusters. Even though the gap distance in cluster generated using the potential with matched that from the experiments, the probability for cluster (as well as the probabilities for other clusters) obtained from these simulations are not the same as those from the experiments. These results suggest that the cluster generation protocol can strongly affect the cluster probabilities.
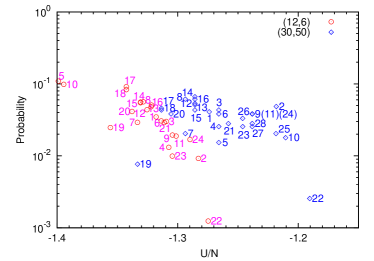
To better understand the distinct bubble cluster probabilities, we first investigated whether they are exponentially distributed in energy, or otherwise strongly correlated with the energy of the cluster. In Fig. 15, we plot the frequency with which each distinct cluster occurs versus the total potential energy per bubble of the cluster for simulations using the and interaction potentials, JKR mixing rules, protocol , and cooling rate . For the case of the potential, there is very little correlation between probability and energy. For the case of the potential, the probability decreases with increasing energy, but there are large fluctuations. Given the weak correlation between probability and energy, we now focus on the role of the cluster formation protocol in determining the frequency with which each cluster occurs.
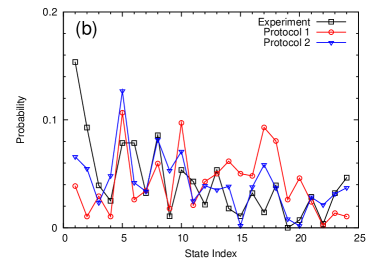
As shown in Fig. 14 (a), clusters and are extremely rare for experimental protocol (with mixing region ), but they possess finite probabilities in the simulations. However, when we construct clusters and one bubble at a time in the experiments, we find that they are stable over long times. In addition, for experimental protocol , clusters and are the most probable with probabilities , and clusters - are rare. In contrast, using protocol from the simulations, clusters and possess probabilities and show peaks for other clusters that are not particularly frequent in experiments. We show in Fig. 14 (b) that the differences between the cluster probabilities generated from experimental protocol and simulation protocol are not caused by cooling rate effects in the simulations.
In Fig. 16 (a), we show the probabilities from the simulations (using the potential and JKR mixing rules) for protocol and several of the possible bubble addition sequences. Sequences SSSLLL and LLLSSS match the experimental probability for cluster , but possess strong probability peaks for clusters and , which do not occur in experiments (with protocol ). We also identified the optimal weightings of the bubble addition sequences that provided the smallest root-mean-square (rms) deviation between the simulation and experimental probabilities (Fig. 16 (b)). We find that protocol from the simulations with optimal weights has an rms deviation in probability from experimental protocol of .
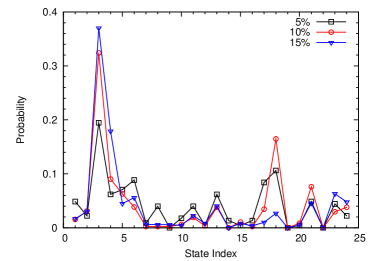
We also studied the effects of changing the experimental protocol (from protocol to with a smaller cluster mixing region ). As shown in Fig. 17, for experimental protocol , cluster is rare, and clusters , , , and are frequent. Variation in the glycerin concentration from to gives rise to smaller changes in the cluster probabilities than those caused by changes in the size of the mixing region. These results show that for bubble rafts the way in which the smaller clusters (with ) combine to form the clusters strongly influences their probabilities.
5 Discussion
Motivated by the potential role that small clusters of particles can play in the mechanical response of large amorphous systems, we systematically studied the impact of the form of the bubble interaction potential on the formation of clusters of four, five, and six bubbles using coordinated simulations and experiments of two-dimensional bubble rafts. This work highlights several interesting features of small bubble clusters. First, for four and five bubble clusters, we find that the form of the attractive bubble interactions does not significantly impact the structure of mechanically stable clusters and the probability with which they occur. However, for six bubble clusters and larger, the energy landscape is sufficiently complex that the range and strength of the bubble interaction potential has a significant impact on the structure of the observed clusters.
A key result of this work is the identification of the important role of both the range and strength of the potential in determining the structure of the mechanically stable clusters. First, we found that for , as the range of the bubble interaction potential decreases from that for the potential to that for the short-range “sticky” potential, the clusters tend to possess more gaps between bubble pairs on the periphery of the clusters. In this case, the distinct clusters obtained from simulations using the long-range potential are a better match to those from experiments. In addition, changing the strength of the interaction potential produced significant changes in the relative distances between bubbles on the periphery in specific clusters. By increasing the strength of bubble interaction from the JKR to mixing rules, we obtained better quantitative agreement for the structure of the clusters from simulations and experiments.
Given the importance of the form of the bubble interaction potential in determining the structure of the bubble clusters, we carried out preliminary measurements of the long-range attraction between bubbles that are not in contact in the bubble raft system. As discussed in Sec. 1, there are two contributions to the attractive force between bubbles. One is an adhesive force between two contacting bubbles. The second is a longer-ranged attractive force due to distortion of the water surface by the bubbles. In Fig. 18, we show measurements of the inter-bubble effective potential as a function of separation and compare these results to the pair force from the generalized Lennard-Jones potential. The best fits to the experimental data give or , which are much longer-ranged than , depending on whether we fix the minimum in the potential for the fit or not. Note that the effective potential includes contributions from drag forces in addition to the meniscus-distortion force that are not relevant for static clusters.
This work also investigated the protocol dependence of the frequency with which mechanically stable bubble clusters occur. As shown in Fig. 16 (b), we obtained the best agreement between the cluster probabilities from experiments and simulations using protocol . However, quantitative agreement requires a detailed understanding of how each bubble cluster is generated, i.e. are clusters generated by adding bubbles one at a time or do smaller mechanically stable clusters with different sizes combine to form each cluster?
The fact that the probabilities of the mechanically stable clusters are strongly protocol dependent has important consequences for materials design. For example, one can change the protocol so that clusters with particular properties are more probable. In this direction, we have developed protocols in experiments that allow us to vary the cluster probabilities over a wide range, and in a controlled fashion. A current challenge is that the experimental protocols generate initial clusters with a distribution of sizes, whereas the simulation protocols use particular insertion sequences. A full exploration of different classes of cluster generation protocols will be the focus of our future work in this area.
Though we performed preliminary studies of clusters with , we only described representative clusters with the aim of confirming the role of the form of the bubble interaction potential in determining the structure of small clusters. We showed the impact of both the range and strength of the potential, but the initial studies also point to the challenges associated with enumerating the large number of distinct clusters for increasing . In future work, we will consider larger numbers of bubbles and enumerate all mechanically stable clusters in experiments and simulations using advanced sampling techniques 56. These studies will allow us to further refine the form of the bubble-bubble interaction potential. For each distinct mechanically stable cluster obtained in the experiments, we can find the cluster from simulations (with a given interaction potential) that is closest to it in configuration space. In this way, we can identify corresponding mechanically stable clusters in the simulations and experiments and determine the interaction potential that gives the closest match 57.
Acknowledgments
The authors acknowledge financial support from NSF MRSEC DMR-1119826 (K.Z.), from NSF Grant No. CMMI-1462489 (C.O.), and from NSF Grant DMR-1506991 (M.D.,C.K.,N.S.). This work was supported by the High Performance Computing facilities operated by, and the staff of, the Yale Center for Research Computing.
References
- Sandfeld et al. 2015 S. Sandfeld, Z. Budrikis, S. Zapperi and D. F. Castellanos, Journal of Statistical Mechanics: Theory and Experiment, 2015, 02011.
- Greer 2009 A. L. Greer, Materials Today, 2009, 12, 14–22.
- Kingery 1960 W. D. Kingery, Introduction to Ceramics, John Wiley & Sons, 1960.
- Schall et al. 2007 P. Schall, D. A. Weitz and F. Spaepen, Science, 2007, 318, 1895.
- Chen et al. 2010 D. Chen, D. Semwogerere, J. Sato, V. Breedveld and E. R. Weeks, Phys. Rev. E, 2010, 81, 011403.
- Debrégeas et al. 2001 G. Debrégeas, H. Tabuteau and J.-M. di Meglio, Phys. Rev. Lett., 2001, 87, 178305.
- Dennin 2004 M. Dennin, Phys. Rev. E, 2004, 70, 041406.
- Lauridsen et al. 2004 J. Lauridsen, G. Chanan and M. Dennin, Phys. Rev. Lett., 2004, 93, 018303.
- Lundberg et al. 2008 M. Lundberg, K. Krishan, N. Xu, C. S. O’Hern and M. Dennin, Phys. Rev. E, 2008, 77, 041505.
- Hébraud et al. 1997 P. Hébraud, F. Lequeux, J. P. Munch and D. J. Pine, Phys. Rev. Lett., 1997, 78, 4657.
- Utter and Behringer 2008 B. Utter and R. P. Behringer, Phys. Rev. Lett., 2008, 100, 208302.
- Keim and Arratia 2013 N. C. Keim and P. E. Arratia, Soft Matter, 2013, 9, 6222.
- Jensen et al. 2014 K. E. Jensen, D. A. Weitz and F. Spaepen, Phys. Rev. E, 2014, 90, 042305.
- Li et al. 2015 W. Li, J. M. Rieser, A. J. Liu, D. J. Durian and J. Li, Phys. Rev. E, 2015, 75, 062212.
- Lauridsen et al. 2002 J. Lauridsen, M. Twardos and M. Dennin, Physical Review Letters, 2002, 89, 098303.
- Pratt and Dennin 2003 E. Pratt and M. Dennin, Physical Review E, 2003, 67, 051402.
- Picard et al. 2005 G. Picard, A. A. and. F Lequeux and L. Bocquet, Physical Review E, 2005, 71, 010501.
- Desmond and Weeks 2015 K. W. Desmond and E. R. Weeks, Phys. Rev. Lett., 2015, 115, 098302.
- Fan et al. 2017 M. Fan, M. Wang, K. Zhang, Y. Liu, J. Schroers, M. D. Shattuck and C. S. O’Hern, Phys. Rev. E, 2017, 95, 022611.
- Jiang et al. 1999 Y. Jiang, P. J. Swart, A. Saxena and J. A. Asipauskas, M.and Glazier, Phys. Rev. E, 1999, 59, 5819.
- Kabla and Debrégeas 2003 A. Kabla and G. Debrégeas, Phys. Rev. Lett., 2003, 90, 258303.
- Wang et al. 2006 Y. Wang, K. Krishan and M. Dennin, Phys. Rev. E, 2006, 73, 031401.
- Kabla et al. 2007 A. Kabla, J. Scheibert and G. Debregeas, Physical Review E, 2007, 587, 45.
- Goyon et al. 2008 J. Goyon, A. Colin, G. Ovarlez, A. Ajdari and L. Bocquet, Nature, 2008, 454, 84.
- Divoux et al. 2013 T. Divoux, V. Grenard and S. Manneville, Phys. Rev. Lett., 2013, 110, 018304.
- Spaepen 1977 F. Spaepen, Acta Metall., 1977, 25, 407.
- Argon 1979 A. S. Argon, Acta Metall., 1979, 27, 47.
- Falk and Langer 1998 M. L. Falk and J. Langer, Phys. Rev. E, 1998, 57, 7192.
- Eastgate et al. 2003 L. Eastgate, J. Langer and L. Pechenik, Phys. Rev. Lett., 2003, 90, 045506.
- Langer and Pechenik 2003 J. S. Langer and L. Pechenik, Phys. Rev. E, 2003, 68, 061507.
- Langer 2004 J. S. Langer, Phys. Rev. E, 2004, 70, 041502.
- Pechenik 2005 L. Pechenik, Phys. Rev. E, 2005, 72, 021507.
- Mayr 2006 S. G. Mayr, Phys. Rev. Lett., 2006, 97, 195501.
- Langer 2006 J. Langer, Phys. Rev. E, 2006, 73, 041504.
- Bouchbinder et al. 2007 E. Bouchbinder, J. Langer and I. Procaccia, Phys. Rev. E, 2007, 75, 036107.
- Bouchbinder et al. 2007 E. Bouchbinder, J. Langer and I. Procaccia, Phys. Rev. E, 2007, 75, 036108.
- Langer 2008 J. Langer, Phys. Rev. E, 2008, 77, 021502.
- Manning and Liu 2011 M. L. Manning and A. J. Liu, Phys. Rev. Lett., 2011, 107, 108302.
- Schoenholz et al. 2014 S. S. Schoenholz, A. Liu, R. Riggleman and J. Rottler, Phys. Rev. X, 2014, 4, 031014.
- Tong and Xu 2014 H. Tong and N. Xu, Phys. Rev. E, 2014, 90, 010401(R).
- Pouliquen and Forterre 2009 O. Pouliquen and Y. Forterre, Phil. trans. R. Soc. A, 2009, 367, 5091.
- Kamrin and Koval 2012 K. Kamrin and G. Koval, Phys. Rev. Lett., 2012, 108, 178301.
- Tewari et al. 1999 S. Tewari, D. Schiemann, D. J. Durian, C. M. Knobler, S. A. Langer and A. J. Liu, Phys. Rev. E, 1999, 60, 4385.
- Durand and Stone 2006 M. Durand and H. A. Stone, Phys. Rev. Lett., 2006, 97, 226101.
- Vaz and Fortes 2001 M. F. Vaz and M. A. Fortes, Journal of Physics: Condensed Matter, 2001, 13, 1395.
- Shen et al. 2014 T. Shen, S. Papanikolaou, C. S. O’Hern and M. D. Shattuck, Phys. Rev. Lett., 2014, 113, 128302.
- Kralchevsky and Nagayama 2000 P. A. Kralchevsky and K. Nagayama, Advances in Colloid and Interface Science, 2000, 85, 145 – 192.
- Kralchevsky and Denkov 2001 P. A. Kralchevsky and N. D. Denkov, Curr. Opin. Colloid Interface Sci., 2001, 6, 383.
- Bragg 1942 L. Bragg, Journal of Scientific Instruments, 1942, 19, 148.
- Bragg and Nye 1947 L. Bragg and J. F. Nye, Proceedings of the Royal Society of London, Series A, 1947, 190, 474.
- Durian 1997 D. J. Durian, Phys. Rev. E, 1997, 55, 1739.
- Johnson et al. 1971 K. Johnson, K. Kendall and A. Roberts, Proceedings of the Royal Society of London A: Mathematical, Physical and Engineering Sciences, 1971, pp. 301–313.
- Israelachvili 2011 J. N. Israelachvili, Intermolecular and Surface Forces, Academic press, 2011.
- Toxvaerd and Dyre 2011 S. Toxvaerd and J. C. Dyre, J. Chem. Phys., 2011, 134, 081102.
- Tkachenko and Witten 1999 A. V. Tkachenko and T. A. Witten, Phys. Rev. E, 1999, 60, 687.
- Martiniani et al. 2016 S. Martiniani, K. J. Schrenk, J. D. Stevenson, D. J. Wales and D. Frenkel, Phys. Rev. E, 2016, 93, 012906.
- Gao et al. 2009 G.-J. Gao, J. Blawzdziewicz, C. S. O’Hern and M. D. Shattuck, Phys. Rev. E, 2009, 80, 061304.