NEW CONSTRAINTS ON STERILE NEUTRINOS WITH MINOS/MINOS+ AND DAYA BAY
Abstract
I describe two new searches for sterile neutrino oscillations from the MINOS and Daya Bay experiments. MINOS looked for evidence through muon neutrino disappearance with data collected from the NuMI neutrino beam. Daya Bay searched for evidence through electron antineutrino disappearance using data collected from nuclear reactors. I explain how the MINOS and Daya Bay searches were combined to produce constraints on the same phase space as LSND and MiniBooNE. Finally, I present the status of the sterile neutrino search using data from MINOS+.
1 Introduction
The mixing of three neutrino states is experimentally well established. [1] This mixing is described by the Pontecorvo-Maki-Nakagawa-Sakata (PMNS) matrix [2, 3, 4] which can be parameterized [5] by three mixing angles , , , and a CP violating phase . The oscillation probabilities can be expressed such that they additionally depend on two mass-squared differences and where . However, there are several anomalies [6, 7, 8, 9, 10] that suggest a mass-splitting inconsistent with those measured assuming the three-flavor paradigm. In particular, the Liquid Scintillator Neutrino Detector (LSND) [9] and MiniBooNE [10] short-baseline neutrino oscillation experiments observed an excess of events from a beam. Furthermore, results from LEP are consistent with only three light active neutrinos coupled to the Z0 boson based on its invisible decay width. [11] Thus, one way to address these anomalies is to use a model with three active neutrinos plus one sterile neutrino that does not interact via the weak force. This “” model extends the PMNS matrix by adding one new flavor eigenstate and one new mass eigenstate. The mixing terms can then be parameterized [5] such that, in addition to the original three-flavor parameters, there are three new mixing angles , , and two new CP violating phases and with . The oscillation probabilities then require one new mass-squared difference, commonly .
2 The MINOS Experiment
MINOS was an on-axis long-baseline neutrino oscillation experiment that was exposed to the the NuMI neutrino beam from Fermilab. It used a near detector (ND) with a mass of 0.98 kt located 1.04 km from the NuMI target and a far detector (FD) with a mass of 5.4 kt located 735 km from the target. These detectors were functionally equivalent magnetized steel-scintillator, tracking-sampling calorimeters. The detectors consisted of alternating planes of 2.54 cm thick steel plates and 1 cm thick polystyrene-based scintillator strips. Each detector was magnetized by a coil that ran parallel to the length of the detector. The magnetic field allowed the MINOS detectors to distinguish between and charged-current (CC) interactions based on the curvature of the resulting muon.[12]
The NuMI beam is produced by colliding 120 GeV protons into a graphite target. The resulting pions and kaons are then focused by two magnetic horns into a decay pipe. The magnetic horns allow the beam to be operated in either a or mode. MINOS and MINOS+ collected 11 years of beam data from 2005 to 2016 using the MINOS detectors. The neutrino flux peaked at 3 GeV for MINOS and 7 GeV for MINOS+. In June 2016 the NuMI beam achieved a beam power of 700 kW making it the most powerful neutrino beamline.[13]
3 The MINOS 3 + 1 Sterile Neutrino Analysis
MINOS has made precision measurements of the three-flavor atmospheric oscillation parameters and . [14] For the model, MINOS is sensitive to , , and through muon neutrino disappearance. This analysis studied muon neutrino disappearance using CC and neutral-current (NC) interactions. The sensitivity of MINOS can be illustrated by considering the leading order approximations for the probabilities associated with the analysis channels in this model. The survival probability is measured with CC interactions and can be written:
| (1) |
where , is the distance traveled by the neutrino, and is the neutrino energy. Equation 1 shows that the CC channel is sensitive to . The addition of a sterile neutrino allows there to be disappearance of NC events expressed as:
| (2) |
where and . The terms and are functions of the mixing angles and phases. To first order, and . From Eq. 2, the NC channel is dependent on the parameters , , and . However, the sensitivity is limited by poor neutrino-energy resolution due to the undetected outgoing neutrino, a lower event rate due to cross sections, and and CC backgrounds. Although appears in Eq. 2, an analysis of solar and reactor neutrino data yields the constraint at 90% C.L. [15] which is small enough to set in this analysis.
3.1 Event Selection
The MINOS sterile analysis required the selection of samples of NC and CC events. This analysis selected events from a beam exposure of protons on target (POT).
NC events have no flavor information and are characterized by a hadronic shower in the detector. These events were selected based on event topology by searching for interactions that induced activity spread over less than 47 steel-scintillator planes. If events had a reconstructed track, then the track was required to penetrate no more than five detector planes beyond the end of the hadronic shower. The NC selection had an efficiency of 79.9% for the ND and resulted in a sample with a purity of 58.9%, both estimated from Monte Carlo (MC) simulation. For the FD, assuming standard three-flavor oscillations, the efficiency of the selection was 87.6% and the sample purity was 61.3%.
CC events are characterized by a long muon track that is bending in the magnetic field of the detector and a hadronic shower near the interaction point. A -nearest neighbor algorithm was developed to select these events based on muon track features resulting in a high purity sample. [16] The algorithm used four variables: the number of detector planes hit by the muon track, the average energy deposited per scintillator plane by the track, the track’s transverse energy deposition profile, and the variation of the energy deposited along the muon track. Events were required to have failed the NC selection procedure to be included in the CC sample. The CC selection had an efficiency of 53.9% for the ND and produced a sample with a purity of 98.7%, both estimated from MC simulation. For the FD, assuming three-flavor oscillations, the corresponding efficiency was 84.6% and the purity was 99.1%.
3.2 Analysis Technique for the 3 + 1 Sterile Neutrino Model
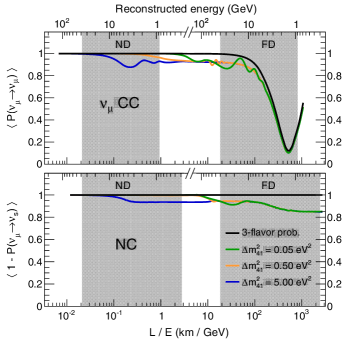
The MINOS analysis used CC and NC events to look for perturbations on three-flavor oscillations. Figure 1 shows examples for different values of and how they alter the oscillation probabilities in both channels at the MINOS detectors. For eV2 an energy-dependent depletion of events would be observed only at the FD. For eV2 fast oscillations occur at the FD that are averaged out due to the energy resolution of the detector leading to a constant deficit of events. For eV2 an energy-dependent depletion of events would be seen at the ND with fast oscillations being averaged out at the FD. Then for eV2 oscillations occur upstream of the ND leading to event deficits in both detectors. The possibility for oscillations at the ND [17] means that the ND spectrum cannot be used to predict the FD spectrum as was traditionally done in MINOS oscillation analyses [18].
In order to be sensitive to oscillations at the ND, MINOS analyzed the ratio of the FD energy spectrum to the ND energy spectrum. The oscillated Far-over-Near MC energy spectrum ratio is then fit to the Far-over-Near data energy spectrum ratio.
3.3 Fitting Procedure
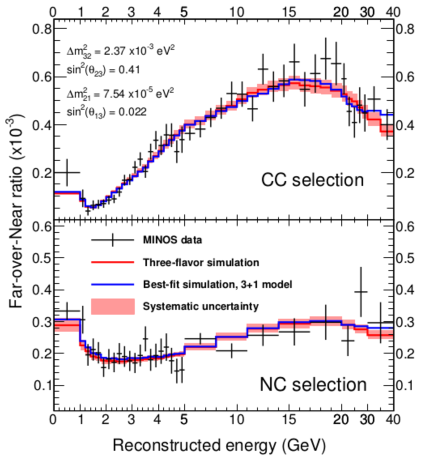
The CC and NC spectra ratios were fit simultaneously using the exact oscillation probabilities to determine , , , , and . MINOS is not sensitive to , , , and . Therefore, all were set to zero. The values and eV2 were set based on a global fit to neutrino data [19], and based on a weighted average of recent results from reactor experiments [20, 21, 22]. Figure 2 shows good agreement between the Far-over-Near ratios measured and predicted using a three-flavor hypothesis.
The fit minimized the function in Eq. 3 where is the observed ratio in bin , is the predicted ratio, and is an covariance matrix expressing the statistical and systematic uncertainties of the predicted ratio. The second term in Eq. 3 is a flux penalty term where and are the observed and predicted total number of events in the ND, and is conservatively set to 50% of based on measurements of the NuMI beam muon flux.
| (3) |
3.4 Systematic Uncertainties
The covariance matrix in Eq. 3 can be broken down into its component uncertainties as:
| (4) |
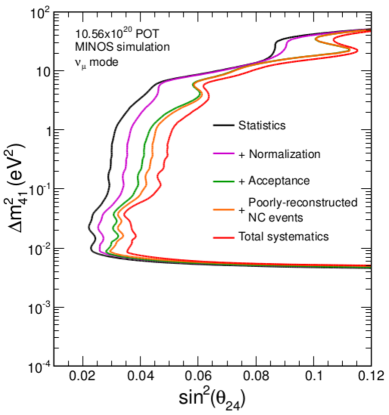
Figure 3 shows the effect of incrementally adding the systematic uncertainties to the sensitivity. contains the statistical uncertainty. contains the uncertainty in the relative normalization of the CC and NC samples between the ND and FD which accounts for uncertainties in reconstruction efficiencies. accounts for uncertainties on the acceptance and selection efficiency of the ND. This systematic uncertainty has the largest effect on the sensitivity as seen in Fig. 3 due to the fact that it is only for the ND and thus cannot be canceled out by the FD. These uncertainties were evaluated by varying event selection requirements in the data and MC simulation to probe known weaknesses in the simulation. As these requirements were varied, the total variations in the ND data to MC ratios were taken as systematic uncertainties on the Far-over-Near ratios. accounts for the uncertainty on the procedure used to remove poorly reconstructed events from the NC sample. includes terms to account for all sources of uncertainty in neutrino interaction cross sections and the flux of neutrinos produced in the NuMI beam. [23]
3.5 MINOS 3 + 1 Model Limit
Since the MINOS best fit was consistent with three-flavor oscillations, the data can be used to set a muon neutrino disappearance limit. The limit was set by dividing the plane into fine bins and minimizing Eq. 3 at each bin allowing , , and to vary. The significance of the with respect to the global minimum was calculated using the Feldman-Cousins method [24]. The resulting MINOS 90% C.L. [23] is shown in Fig. 4. It excludes a sterile neutrino over six orders of magnitude in and two orders of magnitude in . The MINOS limit is the best constraint below 0.1 eV2 in this phase space.
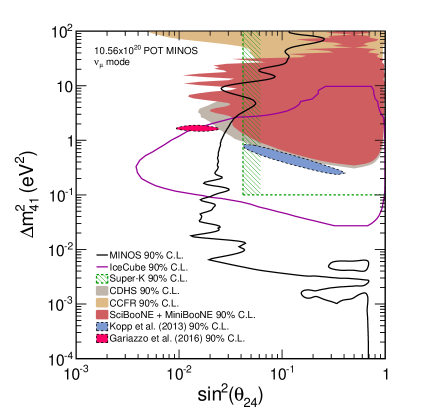
Below eV2 there is an internal allowed region and a feature near eV2 which are due to expected degenerate predictions with the three-flavor case.
4 MINOS, Daya Bay Combination
MINOS measured muon neutrino disappearance and thus can measure the matrix element . However, the LSND and MiniBooNE experiments measured muon neutrino to electron neutrino appearance and constrainted allowed values of which is defined by the matrix elements and . Assuming CPT conservation, a muon neutrino disappearance measurement must be combined with an electron neutrino disappearance measurement, which can measure the matrix element , in order to look at the same mixing angle as LSND and MiniBooNE.
4.1 Daya Bay
To constrain the same phase space as LSND and MiniBooNE, the MINOS measurement was combined with the Daya Bay reactor neutrino experiment [32]. Daya Bay uses eight identical detectors to measure intense sources of neutrinos from six reactor cores with a total power of 17.4 GWth. The detectors are arranged with two at both near experimental halls and four at the far experimental hall. Daya Bay detects electron antineutrinos via inverse beta decay (IBD). The main volume of the Daya Bay detectors is linear alkylbenzene-based liquid scintillator doped with gadolinium which increases neutron capture. Daya Bay was designed to measure and is responsible for the most precise measurement of electron antineutrino disappearance to date [33].
4.2 Daya Bay Sterile Neutrino Fit and Limit
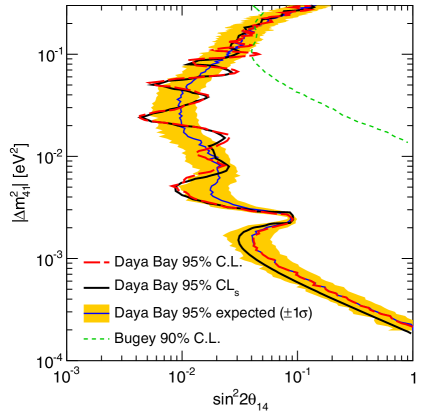
For this sterile neutrino search, Daya Bay analyzed IBD data from 217 days in a partial configuration using six detectors plus 404 days in the full configuration. This analysis used two different methods, referred to as method A and B, to fit the data. Method A used the energy spectra measured at the near halls to predict the far hall energy spectrum. The fit then minimized a function. Method B simultaneously fit all of the spectra from the Daya Bay detectors using the predicted reactor flux constrained by the Huber [34] and Muller [35] models. For this method, the systematic uncertainty on the flux was increased from 2% to 5% to cover observed discrepancies with the predicted reactor neutrino spectrum.111Daya Bay recently performed a detailed study of their reactor antineutrino flux and spectrum. [36] Method B maximized a log-likelihood function complete with nuisance parameters for systematic uncertainties. Both methods used the exact oscillation probabilities to determine , , and . For method A, the Feldman-Cousins procedure [24] was used to set limits while method B set limits using the CLs technique [37, 38, 39]. Daya Bay sets the most stringent limits for eV2 in . Figure 5 shows the 95% C.L. from the Feldman-Cousins method [24] and the 95% CLs exclusion contour [37]. [40] Methods A and B provide consistent results as seen in Fig. 5. The slight difference seen between the two limits for eV2 is due to limited statistics relevant for this region which effect the techniques differently.
4.3 Combined Limit
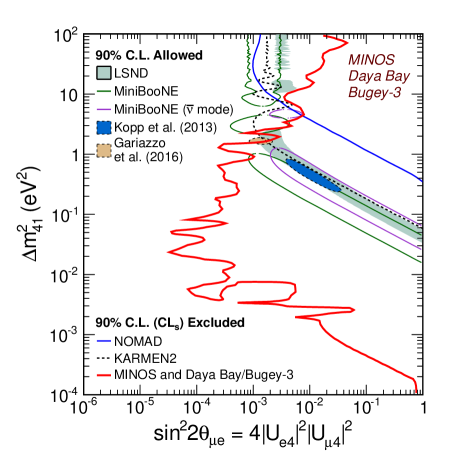
MINOS and Daya Bay did a combined analysis using a common CLs method [37, 38]. Before combining with MINOS, the Daya Bay and Bugey-3 [41] electron antineutrino disappearance measurements were combined taking into account correlated systematic uncertainties. Bugey-3 made measurements at shorter baselines than Daya Bay which provides increased sensitivity for eV2. For the combination of MINOS and Daya Baya + Bugey-3, systematic uncertainties are taken to be uncorrelated. Figure 6 shows the combined 90% CLs exclusion contour [42]. The limit constrains over six orders of magnitude in . This limit is the strongest constraint to date and excludes the sterile neutrino mixing phase space allowed by the LSND and MiniBooNE experiments for eV2 at a 95% CLs.
5 MINOS+
The increased intensity and beam energy of MINOS+ make it well-suited for sterile neutrino searches. MINOS+ is improving on MINOS with more data and an improved fit technique.
5.1 First Half of MINOS+ Data
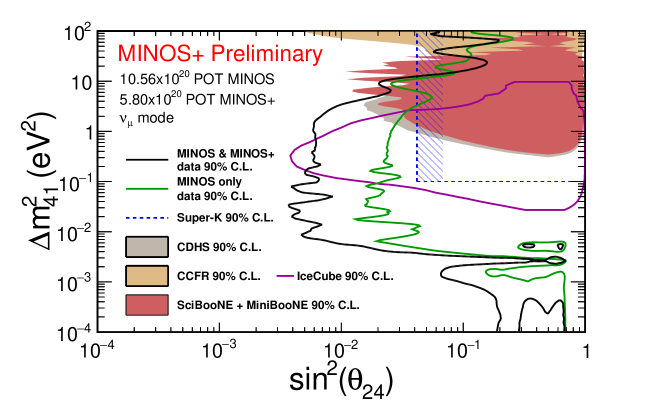
The first two years of MINOS+ data represent a beam exposure of POT. When these data are added to the MINOS dataset using the analysis described above there is a significant increase in the exclusion of for eV2. This improvement is largely due to the increased beam energy of MINOS+ which provided more statistics at higher neutrino energies compared to MINOS. In Fig. 7, the exclusion limit using MINOS and MINOS+ data is compared to the most recent MINOS limit [23].
5.2 Two-Detector Fit Technique
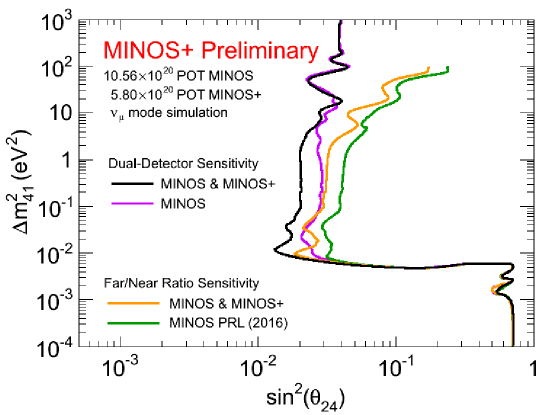
The MINOS+ analysis is also being improved by fitting the spectra in both detectors simultaneously rather than fitting the ratios. In addition to being being less sensitive to oscillations upstream of the ND, the ratio technique had reduced sensitivity to oscillations at the ND as well as to deficits between the detectors due to the fact that the statistical uncertainty was dominated by the FD. The two-detector fit technique allows the analysis to take full advantage of the large statistics available at the ND and the shape information provided by the spectra from both detectors. For eV2 the sensitivity is improved by the ND statistics and the ability to compare the ND and FD spectra. These advantages significantly increase the sensitivity of MINOS+ to exclude regions of for eV2 as seen in Fig. 8. For eV2 the sensitivity is improved by the cancellation of uncertainties between the ND and FD.
6 Conclusion
MINOS extended their 90% C.L. exclusion limit over six orders of magnitude in . Through close collaboration, Daya Bay and MINOS were able to use the CLs technique [37, 38] to combine their disappearance limits to extract equivalent appearance limits, assuming the model. This result increases the tension between appearance and disappearance sterile neutrino searches for eV2. These searches will be updated in the future. Daya Bay and MINOS have an agreement for a future combination, and MINOS+ has 50% more data to analyze.
Acknowledgments
This work was supported by the U.S. DOE; the United Kingdom STFC; the U.S. NSF; the State and University of Minnesota; and Brazil’s FAPESP, CNPq and CAPES. We are grateful to the Minnesota Department of Natural Resources and the personnel of the Soudan Laboratory and Fermilab. We thank the Texas Advanced Computing Center at The University of Texas at Austin for the provision of computing resources.
References
References
- [1] K. A. Olive et al. (Particle Data Group), Chin. Phys. C 38, 090001 (2014). See the review on neutrino mass, mixing, and oscillations.
- [2] Z. Maki, M. Nakagawa, and S. Sakata, Prog. Theor. Phys. 28, 870 (1962).
- [3] B. Pontecorvo, Sov. Phys. JETP 26, 984 (1968).
- [4] V. N. Gribov and B. Pontecorvo, Phys. Lett. 28B, 493 (1969).
- [5] H. Harari and M. Leurer, Phys. Lett. B 181, 123 (1986).
- [6] G. Mention et al., Phys. Rev. D 83, 073006 (2011).
- [7] M. A. Acero, C. Giunti, and M. Laveder, Phys. Rev. D 78, 073009 (2008).
- [8] C. Giunti and M. Laveder, Phys. Rev. C 83, 065504 (2011).
- [9] A. Aguilar et al. (LSND Collaboration), Phys. Rev. D 64, 112007 (2001).
- [10] A. A. Aguilar-Arevalo et al. (MiniBooNE Collaboration), Phys. Rev. Lett. 110, 161801 (2013).
- [11] S. Schael et al. (ALEPH Collaboration, DELPHI Collaboration, L3 Collaboration, OPAL Collaboration, SLD Collaboration, LEP Electroweak Working Group, SLD Electroweak and Heavy Flavour Groups), Phys. Rep. 427, 257 (2006).
- [12] D. G. Michael et al. (MINOS Collaboration), Nucl. Instrum. Methods Phys. Res., Sect. A 596, 190 (2008).
- [13] P. Adamson et al. (MINOS Collaboration), Nucl. Instrum. Methods Phys. Res., Sect. A 806, 279 (2016).
- [14] P. Adamson et al. (MINOS Collaboration), Phys. Rev. Lett. 112, 191801 (2014).
- [15] A. Palazzo, Mod. Phys. Lett. A 28, 1330004 (2013).
- [16] R. Ospanov, Ph.D. thesis, University of Texas at Austin [FERMILAB-THESIS-2008-04, 2008].
- [17] D. Hernandez and A. Yu. Smirnov, Phys. Lett. B 706, 360 (2012).
- [18] P. Adamson et al. (MINOS Collaboration), Phys. Rev. D 77, 072002 (2008).
- [19] G. L. Fogli et al., Phys. Rev. D 86, 013012 (2012).
- [20] F. P. An et al. (Daya Bay Collaboration), Phys. Rev. Lett. 115, 111802 (2015).
- [21] S.-H. Seo (RENO Collaboration), AIP Conf. Proc. 1666, 080002 (2015).
- [22] J. I. Crespo-Anad n (Double Chooz Collaboration), Nucl. Part. Phys. Proc. 265–266, 99 (2015).
- [23] P. Adamson et al. (MINOS Collaboration), Phys. Rev. Lett. 117, 151803 (2016)
- [24] G. J. Feldman and R. D. Cousins, Phys. Rev. D 57, 3873 (1998).
- [25] M. G. Aartsen et al. (IceCube Collaboration), Phys. Rev. Lett. 117, 071801 (2016).
- [26] K. Abe et al. (Super-Kamiokande Collaboration), Phys. Rev. D 91, 052019 (2015).
- [27] F. Dydak et al. (CDHSW Collaboration), Phys. Lett. B 134B, 281 (1984).
- [28] I. E. Stockade et al. (CCFR Collaboration), Phys. Rev. Lett. 52, 1384 (1984).
- [29] K. B. M. Mahn et al. (MiniBooNE and SciBooNE Collaborations), Phys. Rev. D 85, 032007 (2012).
- [30] J. Kopp, P. A. N. Machado, M. Maltoni, and T. Schwetz, J. High Energy Phys. 05 (2013) 050.
- [31] S. Gariazzo, C. Giunti, M. Laveder, Y. F. Li, and E. M. Zavanin, J. Phys. G 43, 033001 (2016).
- [32] F. An et al. (Daya Bay Collaboration), Nucl. Instrum. Methods Phys. Res., Sect. A 811, 133 (2016).
- [33] F. P. An et al. (Daya Bay Collaboration), Phys. Rev. D 95, 072006 (2017).
- [34] P. Huber, Phys. Rev. C 84, 024617 (2011).
- [35] T. A. Mueller et al., Phys. Rev. C 83, 054615 (2011).
- [36] F. P. An et al. (Daya Bay Collaboration), arXiv:1704.01082 [hep-ex]
- [37] A. L. Read, J. Phys. G 28, 2693 (2002).
- [38] T. Junk, Nucl. Instrum. Methods Phys. Res., Sect. A 434, 435 (1999).
- [39] X. Qian, A. Tan, J. J. Ling, Y. Nakajima, and C. Zhang, Nucl. Instrum. Methods Phys. Res., Sect. A 827, 63 (2016).
- [40] F. P. An et al. (Daya Bay Collaboration), Phys. Rev. Lett. 117, 151802 (2016).
- [41] B. Achkar et al. (Bugey Collaboration), Nucl. Phys. B434, 503 (1995).
- [42] P. Adamson et al. (Daya Bay Collaboration, MINOS Collaboration), Phys. Rev. Lett. 117, 151801 (2016).
- [43] B. Armbruster et al. (KARMEN Collaboration), Phys. Rev. D 65, 112001 (2002).
- [44] P. Astier et al. (NOMAD Collaboration), Phys. Lett. B 570, 19 (2003).