Herschel observations of the circumstellar environment of
the two Herbig Be stars R Mon and PDS27
††thanks: Herschel is an ESA space observatory with science instruments provided by European-led Principal Investigator consortia and with important participation from NASA.
Abstract
Context. The circumstellar environment of Herbig Be stars in the far-infrared is poorly characterised, mainly because they are often embedded and rather distant. The analysis of far-infrared spectroscopy allows us to make a major step forward by covering multiple rotational lines of molecules, e.g. CO, that are useful probes of physical conditions of the gas.
Aims. To characterise the gas and dust in the disc and environment of Herbig Be stars, and to compare the results with those of their lower-mass counterparts, the Herbig Ae stars.
Methods. We report and analyse far-infrared observations of two Herbig Be stars, R Mon and PDS 27, obtained with Herschel’s instruments PACS and SPIRE.
We construct spectral energy distributions and derive the infrared excess. We extract line fluxes from the PACS and SPIRE spectra and construct rotational diagrams in order to estimate the excitation temperature of the gas. We derive CO, [O I] and [C I] luminosities to determine physical conditions of the gas, as well as the dominant cooling mechanism.
Results. We confirm that the Herbig Be stars are surrounded by remnants from their parental clouds, with an IR excess that mainly originates in a disc. In R Mon we detect [O I], [C I], [C II], CO (26 transitions), water and OH, while in PDS 27 we only detect [C I] and CO (8 transitions). We attribute the absence of OH and water in PDS 27 to UV photo-dissociation and photo-evaporation. From the rotational diagrams, we find several components for CO: we derive 94990 K, 35820 K & 7712 K for R Mon, 9612 K & 314 K for PDS 27 and 258 K & 276 K for their respective compact neighbours. The forsterite feature at 69 m was not detected in either of the sources, probably due to the lack of (warm) crystalline dust in a flat disc. We find that cooling by molecules is dominant in the Herbig Be stars, while this is not the case in Herbig Ae stars where cooling by [O I] dominates. Moreover, we show that in the Herbig Be star R Mon, outflow shocks are the dominant gas heating mechanism, while in Herbig Ae stars this is stellar.
Conclusions. The outflow of R Mon contributes to the observed line emission by heating the gas, both in the central spaxel/beam covering the disc and the immediate surroundings, as well as in those spaxels/beams covering the parabolic shell around it. PDS 27, a B2 star, has dispersed a large part of its gas content and/or destroyed molecules; this is likely given its intense UV field.
Key Words.:
circumstellar matter – stars: pre-main sequence – stars: individual (R Mon, PDS 27) – protoplanetary discs – ISM: molecules – astrochemistry1 Introduction
Low- and intermediate-mass star formation theory assumes that stellar masses are accumulated as a consequence of gravitational collapse of a dense molecular core, while conservation of angular momentum forces the infalling material to form an accretion disc around the central protostar. However, once the disc is formed, turbulence and viscosity contribute to the motion of the disc material towards the star while angular momentum causes the opposite movement. During the accretion phase, viscous dissipation also results into the heating of the inner part of the disc, but once accretion comes to a halt, the disc is heated by stellar irradiation, being warm at the surface and colder in the midplane (McKee & Ostriker 2007). This passive disc phase lasts for several Myrs during which the disc dissipates slowly due to low-level accretion, photo-evaporation and/or planet formation.
Herbig Ae/Be (HAeBe) stars are pre-main sequence A- or B-type stars with optical emission lines and an IR excess due to the thermal emission of dust grains and photon emission by polycyclic aromatic hydrocarbons (PAHs). In particular, Herbig Be (HBe) stars are the link between massive protostars and the intermediate-mass Herbig Ae (HAe) stars.
HAe discs have been characterised in terms of their spectral energy distribution (SED): group I sources have a relatively strong far-IR flux, which is energetically similar to the flux in the near-IR, while group II sources show a similar near-IR excess as group I sources but their flux falls off more strongly towards the far-IR Meeus et al. (2001). These differences were interpreted as a consequence of a different disc geometry, with flaring/flat discs in which dust grains grow and settle towards the midplane (Dullemond & Dominik 2004b) and/or flat discs that are shadowed by a puffed up inner wall (Dullemond & Dominik 2004a). However, recent observations suggest that group I sources have a dust-depleted gap in their inner disc (Maaskant et al. 2013) beyond which the disc flares.
For the more massive B and O type stars, however, the picture of a disc is less clear. The evolution of their discs has been theoretically studied (Hollenbach et al. 1994; Gorti & Hollenbach 2009), and it is predicted that their strong UV radiation evaporates part of it on a timescale yrs, so that they are smaller and less massive than HAe discs. Based on millimetre observations, Fuente et al. (2003) concluded that the discs around HBe stars are likely flat and loose a large fraction of their mass (90%) before the pre-main-sequence stellar phase. Also IR interferometric data suggest that the discs of HBe stars are flatter and truncated on the outside, as seen for MWC 147 (Kraus et al. 2008) and MWC 297 (Acke et al. 2008). The flattening of the disc could be due to rapid grain growth, causing the optical depth of the disc to drop and allowing the UV photons to penetrate deeper into the disc and photo-evaporate its external layers (Dullemond & Dominik 2004b), while dust settling occurs at a higher rate.
Verhoeff et al. (2012) selected a sample of HBe stars to study the spatial distribution and mineralogy of their warm dust, and compared the results to HAe stars. Their mid-IR imaging revealed compact material distributed in discs, and more diversity in the shape of the infrared SEDs of HBe stars when compared to HAe stars. They also found that most HBe discs are more flat and truncated on the outside, so not just scaled-up versions of HAe discs.
In this paper, we will analyse two HBe objects, R Mon and PDS 27, for which we have Herschel PACS (Photodetector Array Camera and Spectrometer; Poglitsch et al. 2010) and SPIRE (Spectral and Photometric Imaging REceiver; Griffin et al. 2010) far-IR spectra, as well as photometric images. In Section 2 we list the properties of our stars, while in Section 3 we present the observations. The results and discussion are shown in Sections 4 and 5, while we round off with conclusions in and 6.
2 Sample
| Name | RA | DEC | Spec. | log | Distance | log | Radius | Mass | |
|---|---|---|---|---|---|---|---|---|---|
| J2000.0 | Type | (K) | (kpc) | (mag) | () | () | () | ||
| R Mon | 06h 39’ 09.9″ | +08∘ 44’ 10.7″ | B8IIIev | 4.07 0.05 | 0.8 | 2.5 0.1 | 2.12 0.12 | 2.8 0.4 | 3.4 0.8a𝑎aa𝑎aMora et al. (2001), |
| PDS 27 | 07h 19’ 35.9″ | -17∘ 39’ 18.7″ | B2?eb𝑏bb𝑏bVieira et al. (2003), and | 4.34 0.14 | 1.25d𝑑dd𝑑dVieira et al. (2003); Ababakr et al. (2015) give a distance of 3.17 kpc, based on kinematic arguments. | 4.8 0.1 | 3.80 0.11 | 5.5 0.8 | 9.1 1.8c𝑐cc𝑐cJones & Herbig (1982) |
R Mon and PDS 27 are part of a larger sample of Herbig Be stars in a Herschel proposal (OT1_gmeeus_1). However, these are the only two objects that were observed in spectroscopic mode, allowing us to study the gas and dust properties. We list their parameters in Table 1.
R Mon
is an intermediate-mass pre-main-sequence star with a spectral type B8IIIev (Mora et al. 2001), classified as a HAeBe star (Herbig 1960; Finkenzeller & Mundt 1984). It is located at a distance of 800 pc (Jones & Herbig 1982) and its apparent V magnitude varies between 11 and 13.8 mag. CO radio observations (12CO ) showed that R Mon is located in a flattened molecular cloud and drives a strong bipolar outflow in north-south direction, that has carved out a bipolar cavity (Canto et al. 1981) where the southern part is being obscured. The walls of the cavity are illuminated by R Mon, creating ”Hubble’s Variable Nebula” or NGC 2261, extending 2’ to the North along P.A. 350∘ (Close et al. 1997).
Brugel et al. (1984) detected a high-velocity (100 km s-1) collimated jet in [SII], positioned through the axis of symmetry of the reflection nebula NGC 2261. The jet extends 4-10 to the North and 10-16 to the South. They concluded that the collimation must occur close (, or 2000 au) to the star. High-resolution (FWHM 0.2) adaptive optics observations by Close et al. (1997) uncovered a companion at a separation of 0.69 from R Mon, thought to be a very young T Tauri star (TTS). Scattered light images show a conical reflection nebula. Close et al. (1997, see Figure 15) proposed a model in which R Mon has a small ( au) disc surrounded by an optically thick, dusty flattened envelope. A strong outflow carves out a conical cavity in the surrounding envelope, that is optically thin.
Fuente et al. (2003) derived from 2.7mm interferometric observations that the emission is extended up to 3-4, thus 3000 au, too large for a disc, and also suggested a flattened envelope surrounding the disc. A few years later, Fuente et al. (2006) presented PdBI continuum observations at 1.3 and 2.7mm with higher angular resolution and sensitivity, as well as 12CO rotational lines. The 1.3mm image shows a disc extending up to 0.3, with a mass of 0.007 . The CO (2-1) and CO (1-0) lines are optically thick, and consistent with a gaseous disc in keplerian rotation with an outer radius of 1500 au and a total disc mass of 0.014–0.08 . However, Sandell et al. (2011) argue that their CO rotation curve might be contaminated by emission from the outflow. Alonso-Albi et al. (2009) also suggests that a gaseous flat disc surrounds R Mon, based on their 13CO observations.
PDS 27.
Also known as DW CMa, is located on the edge of the dark cloud KHAV 201. Its spectral type is estimated to be B2?e (Vieira et al. 2003). Manchado et al. (1990) observed P-Cygni profiles and concluded that they could be reproduced with a wind velocity of about 130 30 km s-1, typical for optical jets, Herbig-Haro (HH) and solar-mass TTS.
The presence of hot dust with a temperature of up to 1400 K can be derived from its location in the near-IR colour-colour diagram (J–H vs. H–K), whereas far-IR data also indicate the presence of cold dust with temperatures ranging from 60 to 200 K (Beichman et al. 1986; Manchado et al. 1990). There are no millimetre observations for PDS 27 in the literature, nor a mention of a close companion.
3 Observations and data reduction
We obtained PACS and SPIRE spectroscopic data for R Mon and PDS 27. The data were reduced with the official version 14.0 of the Herschel Interactive Processing Environment (HIPE; Ott 2010).
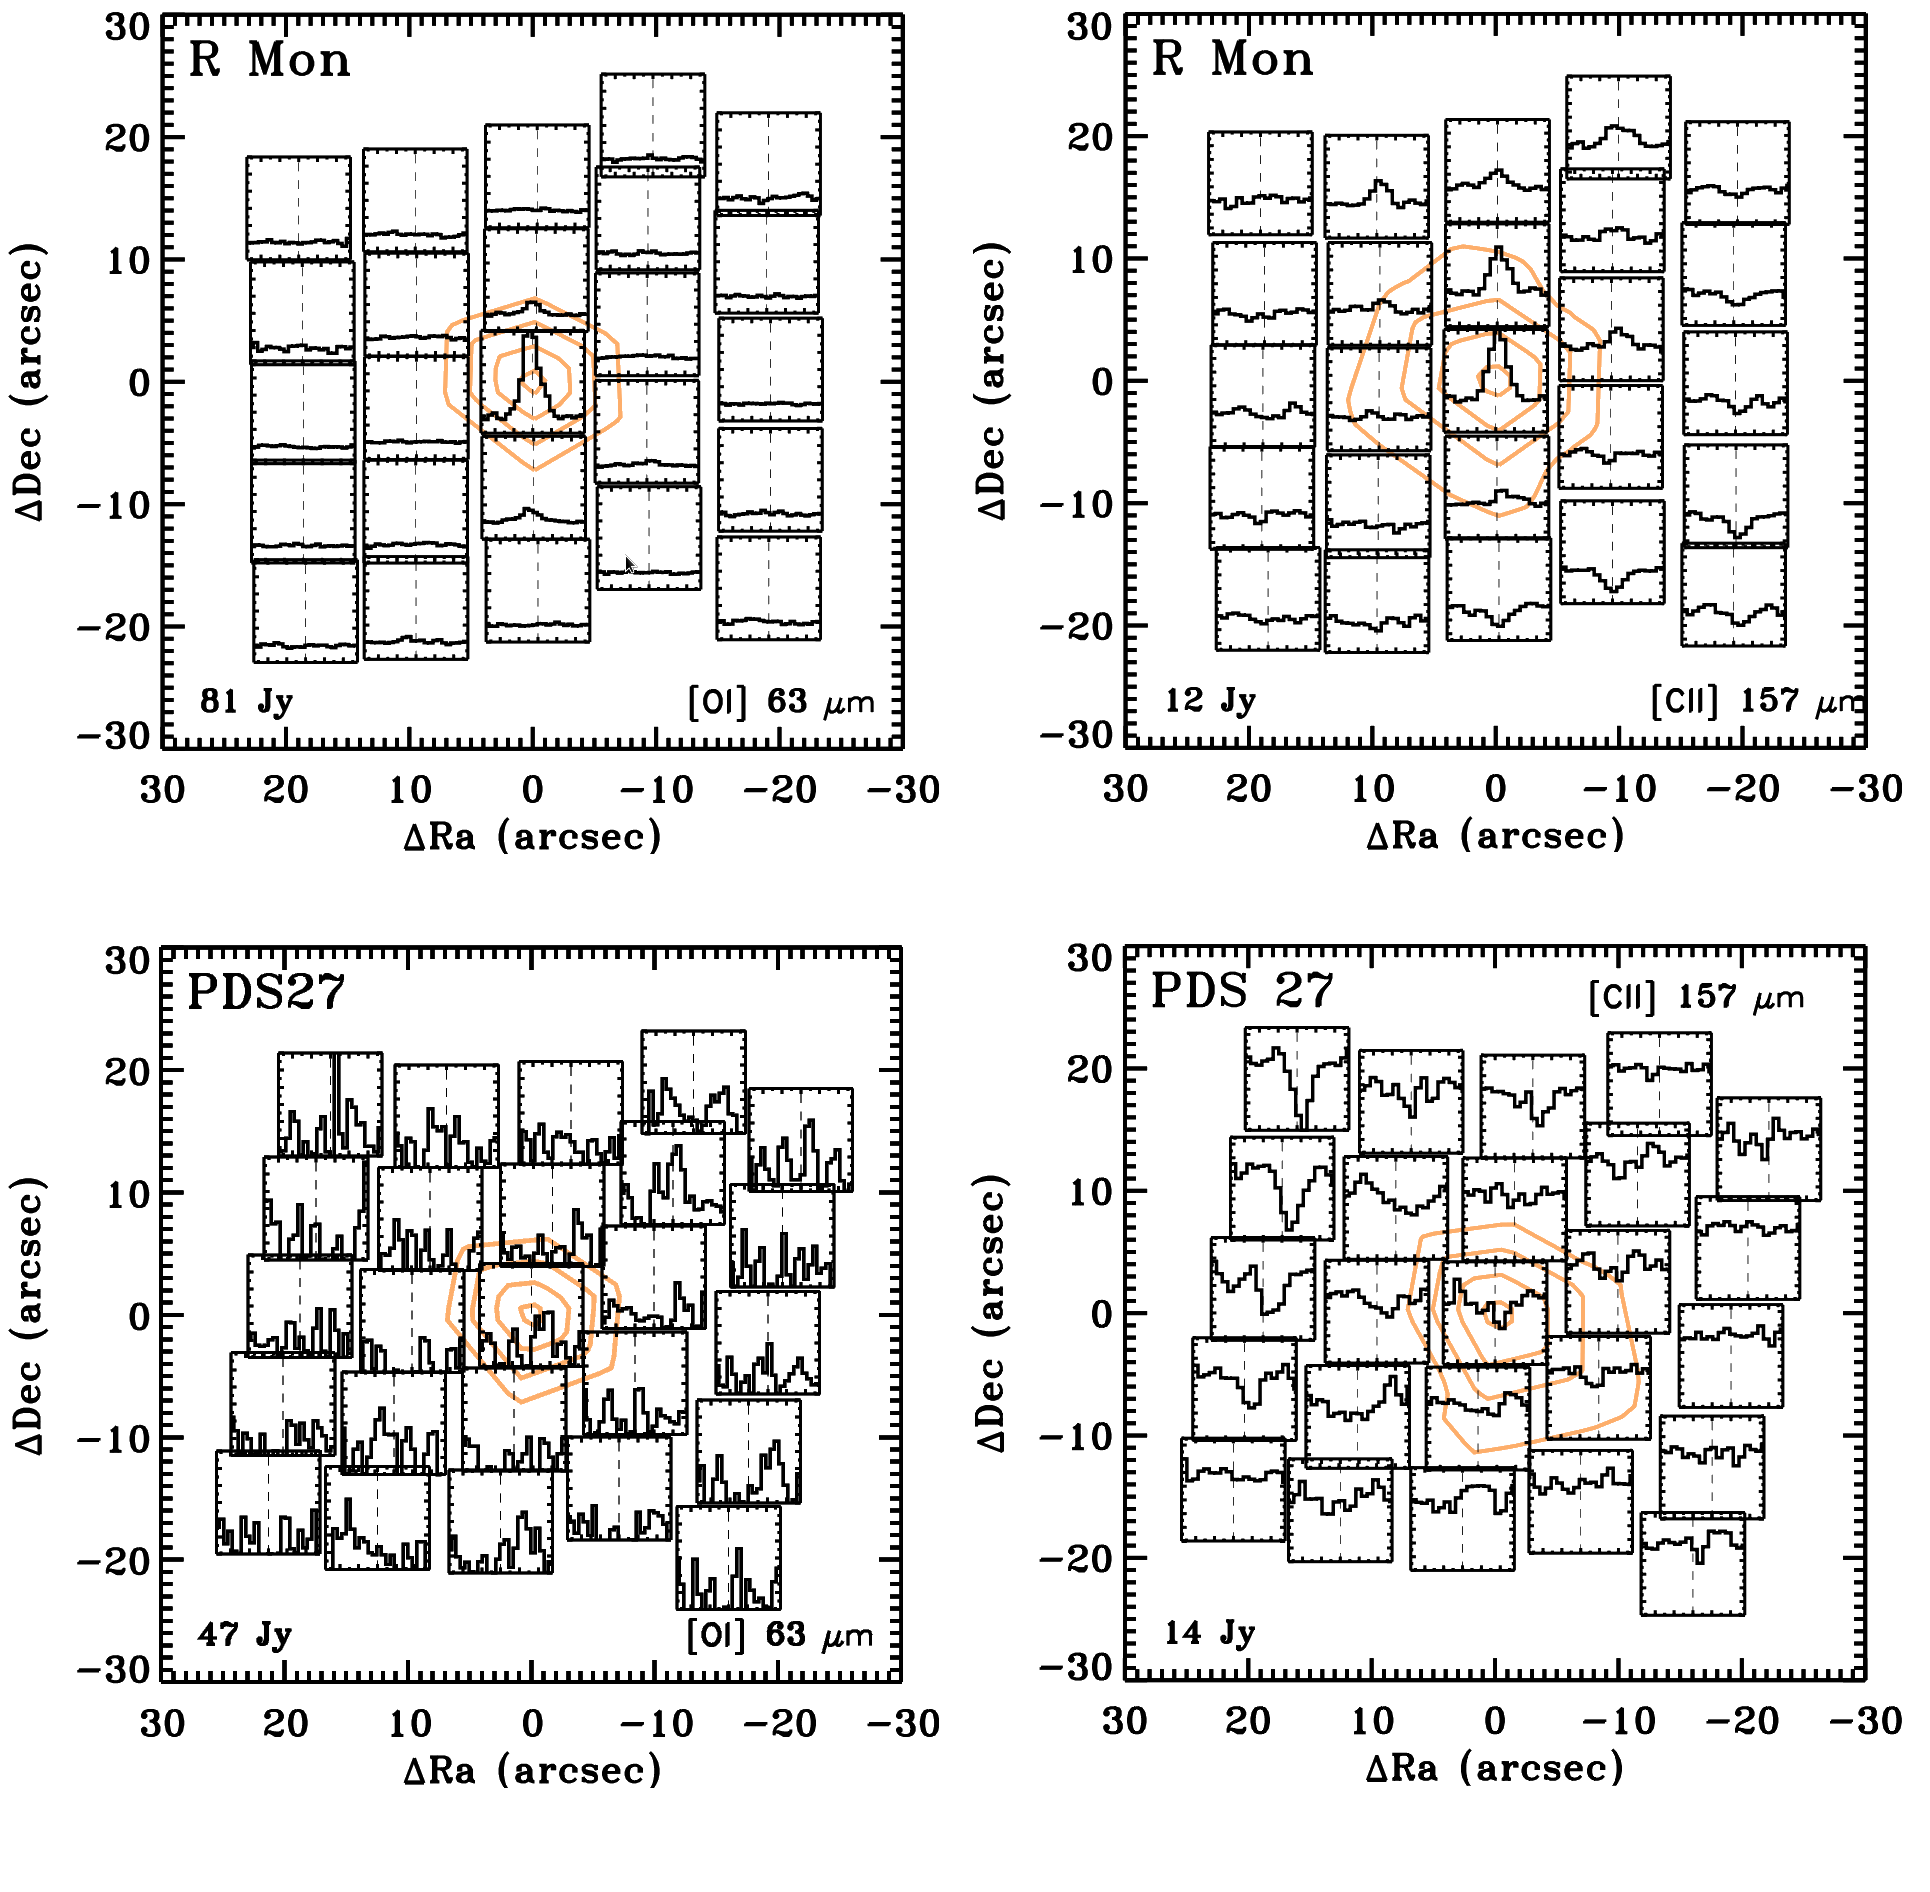
PACS is an integral field spectrometer (IFS) with a 55 array of spectral pixels, each 9.4″ 9.4″in size (also referred to as “spaxels”). They cover the spectral range from 51 to 210 m with a resolution , divided into four orders, referred to as “B2A”, “B2B”, “short R1” and “long R1”. For each spectroscopic observation, two settings were used in order to have a full coverage: SED B2A + short R1 (51-73 m + 102-146 m) and SED B2B + long R1 (70-105 m + 140-220 m). Two repetitions were obtained in order to be able to remove cosmic rays and improve the wavelength accuracy. The total observation time adds up to 7037 seconds for each target. Each order was reduced using a modified pipeline optimised for extended sources (Green et al. 2013). We extracted the spectra from the central spaxel, scaled to the flux of the central 33 spaxels (see Figure 8).
SPIRE spectroscopic data were taken in a single pointing with sparse spatial sampling, at high (H) spectral resolution. For each source, 20 repetitions were performed, adding up to a total observation time of 3423 seconds per target. The spectrum is divided into two orders covering the spectral ranges 194–325 m (“SSW”, Spectrograph Short Wavelengths) and 320–690 m (“SLW”, Spectrograph Long Wavelengths), with a resolution of , increasing at shorter wavelengths. Each order was reduced separately within HIPE, using the standard pipeline for single pointing. We first extracted the spectra from the SPIRE detectors SSW D4 and SLW C3, which are centered on the main sources, R Mon and PDS 27. We also extracted the other detectors to analyse the surrounding environment.
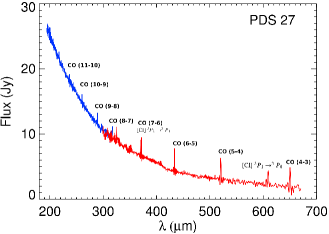
The fluxes were extracted using a gaussian fit to the lines with a first-order polynomial to the continuum. We used the RMS on the continuum (excluding the line) to derive a 1 error on the line by integrating a gaussian with height equal to the continuum RMS and width of the instrumental FWHM. We only call a line a detection when it has at least a 3 signal. The SPIRE spectra for R Mon and PDS 27 in Figure 2 show, especially for R Mon, absorption-like features near the detected emission lines. These features are due to the instrumental line shape of the FTS instrument, which is an asymmetric sinc function.
Without any prior knowledge about the size of the objects, we derived that our sources are partially extended in the SPIRE beams by comparing the point-source and extended-source calibration available in the pipeline. Therefore, we applied a correction using the ’semiExtendedCorrector’ task in HIPE, in order to extract the spectra in the central beam. The output is a spectrum corrected to a reference beam size that is constant with frequency (see Section 7.6 of the SPIRE Data Reduction Guide - DRG).
Both sources are plagued with surrounding emission that contributes more towards longer wavelengths where larger beams are used. Given the difference in spaxel/beam size between PACS and SPIRE, we can expect an offset in flux levels between the spectra at the wavelengths where they overlap. Therefore, we first produced a continuous spectrum over the whole 50-670 wavelength. By doing this we assume that the emission comes from a region similar in size over the whole wavelength range. This method is commonly used for non-compact sources (e.g., Green et al. 2013). In order to produce a continuous spectrum from 50 to 670 micron, we first scaled the PACS bands so they would match, taking the shortest wavelength range (most compact) as a reference. Next we matched the SPIRE bands with those of PACS. The factors used to match the range 50-75 m are 1, 0.93, 0.91, 0.87, 0.9 for R Mon and 1.04, 0.95, 0.94, 0.77, 0.75 for PDS 27 (ranges 70-95, 100-150, 140-200, 200-300, 280-670 m, respectively). The resulting scaled spectra are shown in Figure 1 and 2, and used to measure the line fluxes.
4 Results
4.1 Continuum SEDs
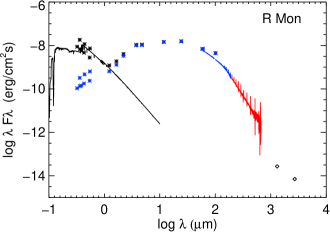
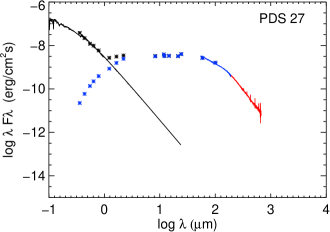
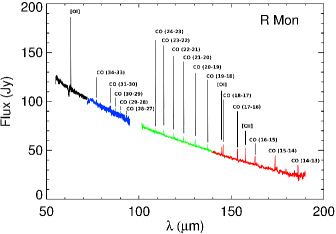
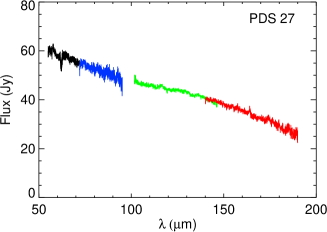
The ancillary optical and near-IR photometric data (Verhoeff et al. 2012) was complemented with our new Herschel spectroscopic data, and the millimeter data from Fuente et al. (2003) for R Mon, in order to construct the spectral energy distribution (see Figure 3).
As seen in Figure 3, our sources have a disc-like IR excess that starts in the near-IR and extends to the far-IR/mm region, with a maximum around 30 m. This excess can in part be attributed to the emission from the disc. In order to compare the IR excess to the stellar emission, we calculated the ratio between the observed emission and the Kurucz atmosphere model (Kurucz 1993), both for the whole wavelength range and in the near-, mid- and far-IR (see Table 2). The total IR excess LIR/L∗ is 3.36 for R Mon and 0.13 for PDS 27, rather different from HAe discs that have on average 0.57 and 0.31 for group I and II, respectively (Pascual et al. 2016). This could be attributed to differences in their discs properties. A possible explanation for the large excess ratio seen in R Mon could be the presence of an outflow; systems which exhibit strong outflows have discs that are powered by accretion (Bans & Königl 2012). It is very likely that PDS 27 has a small depleted disc, reprocessing the stellar radiation.
The FIR-to-NIR ratio is useful to provide an idea of the morphology of the protostellar disc. The ratios we compute are 2.17 for R Mon and 1.73 for PDS 27, comparable to average values of HAe discs, 2.27 for group I (flared) and 1.17 for group II (flat) discs (Pascual et al. 2016). We conclude that the HBe values are indicative of flared discs.
| LIR/L∗ | LNIR/L∗ | LMIR/L∗ | LFIR/L∗ | LFIR/LNIR | |
|---|---|---|---|---|---|
| (total) | 2–5 | 5–20 | 20–200 | ||
| (m) | (m) | (m) | |||
| R Mon | 3.36 | 0.57 | 1.52 | 1.21 | 2.17 |
| PDS 27 | 0.13 | 0.03 | 0.04 | 0.05 | 1.73 |
| group I | 0.57 | 0.13 | 0.11 | 0.21 | 2.27 |
| group II | 0.31 | 0.10 | 0.09 | 0.05 | 1.17 |
Notes: HAe group I and II average values taken from Pascual et al. (2016).
4.2 Line emission
| Transition | Line flux ( W m-2) | ||
|---|---|---|---|
| (m) | R Mon | PDS 27 | |
| [O I] | 63.2 | 242.10.5 | 19.9 |
| [O I] | 145.5 | 24.40.5 | 5.1 |
| [C II] | 157.7 | 24.40.5 | 5.2 |
| [C I] | 370.8 | 3.20.3 | 3.10.4 |
| [C I] | 609.8 | 2.30.1 | 3.10.1 |
| OH | 84.42a | 9.10.7 | – |
| OH | 84.60 | 7.40.7 | – |
| OH | 119.23 | 4.80.6 | – |
| OH | 119.44 | 5.80.6 | – |
| OH | 163.12 | 3.00.4 | – |
| OH | 163.40 | 3.40.4 | – |
| o-H2O | 108.07 | 6.50.9 | – |
| o-H2O | 113.54b | 19.40.7 | – |
| o-H2O | 132.41 | 4.40.5 | – |
| o-H2O | 179.53 | 4.50.5 | – |
| CO3433 | 77.11 | 6.30.7 | – |
| CO3130 | 84.41a | 9.10.7 | – |
| CO3029 | 87.19 | 5.80.7 | – |
| CO2928 | 90.16 | 6.40.6 | – |
| CO2827 | 93.36 | 7.70.7 | – |
| CO2423 | 108.8 | 10.81.0 | |
| CO2322 | 113.5b | 19.40.7 | – |
| CO2221 | 118.6 | 14.50.6 | – |
| CO2120 | 124.2 | 14.10.4 | – |
| CO2019 | 130.4 | 15.70.5 | – |
| CO1918 | 137.2 | 12.80.5 | – |
| CO1817 | 144.8 | 16.10.6 | – |
| CO1716 | 153.3 | 19.50.6 | – |
| CO1615 | 162.8 | 16.00.4 | – |
| CO1514 | 173.6 | 19.90.6 | – |
| CO1413 | 186.0 | 16.60.9 | – |
| CO1312 | 200.5 | 14.91.7 | – |
| CO1211 | 217.1 | 13.81.2 | – |
| CO1110 | 236.8 | 13.80.8 | 2.20.7 |
| CO109 | 260.5 | 14.90.5 | 3.20.6 |
| CO98 | 289.4 | 13.90.3 | 2.50.4 |
| CO87 | 325.5 | 6.80.6 | 2.80.9 |
| CO76 | 372.0 | 7.50.3 | 3.60.4 |
| CO65 | 434.0 | 7.20.2 | 4.90.2 |
| CO54 | 520.7 | 9.00.1 | 5.10.1 |
| CO43 | 651.1 | 7.40.2 | 5.90.1 |
Notes: a blend of CO and OH; b blend of CO and H2O.
The main transitions targeted with PACS and SPIRE are fine structure lines of [O I], [C I], [C II] and emission from CO, OH, and H2O. The details of the detected transitions and their fluxes can be found in Table 3.
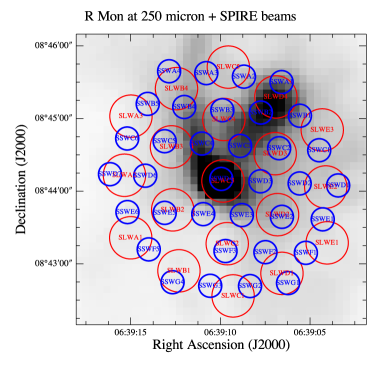
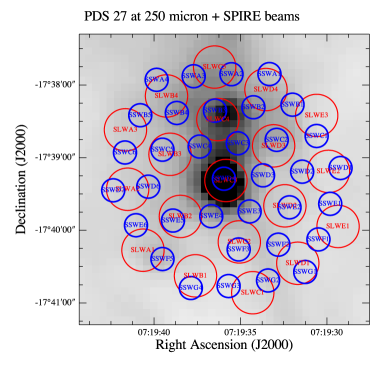
Overall, the R Mon spectra are richer in emission lines than PDS 27. Both R Mon and PDS 27 have a compact source in their surroundings, located at 64 and 58″, respectively. These ’neighbours’ fall outside the PACS field of view, but they are in the field of view of SPIRE, as can be seen in Figure 6. The T Tauri companion of R Mon (at a distance of 0.69″) could in principle contribute to the spectra; however, we can neglect its contribution because of their small brightness ratio. Indeed, if we consider the [O I] 63 m line flux and continuum of DG Tau, one of the brightest TTS, and scale it to the distance of R Mon, we obtain a line flux of 5.5 W/m2 and a continuum flux of 0.45 Jy, thus 2% and 0.5 % of the line and continuum fluxes of R Mon, respectively, which is within the error of the observations.
4.2.1 Oxygen fine structure lines
Oxygen is the third most abundant element in the ISM and its fine structure line at 63.2 m is by far the strongest line observed in R Mon, with a flux W/m2. The [O I] line at 145 m is also strong in R Mon and the ratio of [O I] 63 m / [O I] 145 m is . This is at the lower end of the 10-30 range found for Herbig Ae stars (Meeus et al. 2012), where the emission was attributed to the disc. It is also consistent with the median ratio of 10 (range from 5.5 to ) found in deeply-embedded low-mass Class 0 protostars (Karska et al. 2013), where the emission is linked to the outflow.
Assuming collisional excitation with H2, Nisini et al. (2015) find that the [O I] 63 m / [O I] 145 m ratio above 10 corresponds to densities in the cm-3 regime, but is insensitive to the gas temperature. The values of the ratio around 9-10 match the models with cm-3 when the main collisional partner is atomic H. The uncertainty in the H-to-H2 fraction, however, translates to an order of magnitude uncertainty in the derived densities.
On the other hand, the low values of the [O I] 63 m / [O I] 145 m ratio could be attributed to line-of-sight absorptions in the [O I] 63 m line. Recent velocity-resolved spectra of the [O I] 63 m line show that self-absorptions are strong towards high-mass protostars (Leurini et al. 2015), but negligible in their nearby, low-mass counterparts (Kristensen et al. 2017). The spectral resolution of PACS ( about 90 km/s at the 63 m) is not sufficient to correct for potential self-absorptions.
Finally, the considerably lower values found for the [O I] emission lines in PDS 27 suggest that the origin of emission may be different than in R Mon and low-mass protostars. We do not expect the [O I] 63 m flux to be affected by off-position contamination, since the densities to excite the line are relatively high. We will discuss the possible scenarios for this source in Section 5.3.
4.2.2 Carbon fine structure lines
In R Mon, the [C II] 157.7 m line is clearly detected, and is present in all 25 spaxels, some of them even in absorption (see Figure 8). This is because the line is present with different strengths in the chop-on positions, as well as in the chop-off positions that are subtracted to obtain the final spectra. In PDS 27, we see a faint absorption of [C II] 157.7 m at the stellar position (see Figure 8). In the other spaxels we see stronger absorption features, especially towards the east. We can conclude that also in PDS 27 [C II] is present in variable amounts in the chop-on and -off positions.
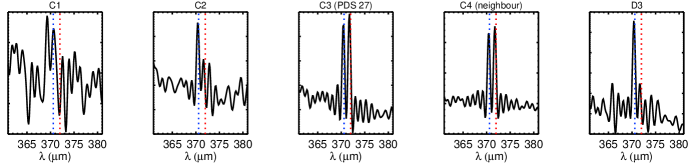
The [C I] (2-1) and (1-0) transitions at 370 and 610 m are detected in both PDS 27 and R Mon. Both lines are seen in most of the beams of PDS 27, with exception of the noisiest spectra. For R Mon, the [C I] (2-1) line is also omnipresent, while the lower-excitation [C I] (1-0) line is only clearly present in the more central SLW beams (C3, C4, D2 and D3).
4.2.3 Carbon monoxide
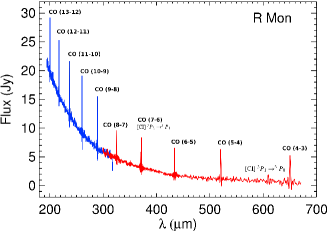
Many transitions of carbon monoxide are detected in both PACS and SPIRE, as listed in Table 3. In R Mon, PACS detects 16 transitions, from to , with between 3279 and 581 K. On the other hand, no CO detections are seen with PACS for PDS 27. In R Mon, SPIRE detects 10 transitions, from to , with between 503 and 55 K. For PDS 27, eight transitions are detected, from to .
For R Mon, the CO emission originates mainly from the central spaxel in PACS. In SPIRE, on the other hand, transitions up to CO (8-7) are observed in several beams. In particular, for the lowest transition, CO (4-3), we detect the line in most of the beams but the outer ones. The amount of beams in which a line is detected decreases for higher transitions, from roughly half (of 19) for CO (5-4) to only the five central ones covering the cavity (SLW C3, C4, C5, D3 and D4) for CO (7-6).
For PDS 27, the lowest transition CO (4-3) is also present in most of the beams, while for increasing the amount of beams decreases rapidly: only five for CO (5-4) and CO (6-5), three (SLW C3, C4 and C5) for CO (7-6) and two (SLW C3 and C4) at CO (8-7).
For both objects, transitions higher than CO (8-7) are only observed at the position of the star. Therefore, we can conclude that the CO emission, especially for transitions higher than (5-4) does not originate from the larger-scale environment.
4.2.4 OH and water
HBe stars are more massive, warm and luminous than their HAe counterparts, and have stronger UV emission. Thi & Bik (2005) showed that the ratio H2O/OH tends to be smaller when the ratio UV flux/gas density increases, probably due to the destruction of H2O by UV radiation. In discs this means that H2O could be located in deeper, colder layers than OH, but not be detectable, as Fedele et al. (2011) concluded.
In R Mon we find four detections of water lines (Eup between 114 and 324 K), and three of the OH doublets (Eup between 120 and 291 K). There are also hints of doublets at 79.1, 71.2 and 65.2 m, but they are not 3-sigma detections. These water lines detected are typically the strongest observed, as also seen in a sample of low-mass protostars (Karska et al. 2013). In this context it is important to note that in Herbig Ae stars, warm water lines were only convincingly seen in HD 163296 (spectral type A1; Meeus et al. 2012; Fedele et al. 2013), while HD 100546 (spectral type B9.5Ve) only shows evidence of cold water (observed with Herschel/HIFI; Hogerheijde et al. 2011). It is surprising that no high-excitation (E 500 K) water lines are detected, unlike what is observed in gas-rich T Tauri discs (Riviere-Marichalar et al. 2012) and the Herbig Ae star HD 163296 (Meeus et al. 2012). For the three OH doublets detected in R Mon we constructed a rotational diagram which was fitted with a single temperature component, T K.
In contrast, in PDS 27 we do not detect any H2O or OH lines, likely because the UV radiation is too strong for molecules to survive photo-dissociation, at least in those layers where its emission would be visible to us.
4.3 Dust features
The forsterite feature at 69 m, evidence for crystalline dust, has been observed in the PACS spectra of several HAeBe discs (seven out of 23 observed; Sturm et al. 2013). In R Mon and PDS 27 we do not see forsterite at 69 m. This could indicate that forsterite is either absent, or at a too high/low temperature to emit efficiently at 69 m, as is discussed by Maaskant et al. (2015).
5 Discussion
5.1 Physical conditions of the gas
| Beam | rCI | rCICO | highest |
|---|---|---|---|
| CO | |||
| R Mon | |||
| C2 | 1.78 | – | – |
| C3 | 1.40.1 | 0.0070.001 | 34-33 |
| C4 | 1.30.1 | 0.170.05 | 8-7 |
| D4 | 2.00.3 | 0.28 | 7-6 |
| PDS 27 | |||
| C2 | 0.50.1 | 0.64 | 4-3 |
| C3 | 1.00.1 | 0.210.03 | 11-10 |
| C4 | 1.70.2 | 0.230.05 | 8-7 |
| D3 | 1.00.1 | 0.6 | 5-4 |
Line ratios of CO and CI lines are interesting since they are sensitive to the physical conditions of the emitting gas. In particular, they can be used to derive - at least comparatively - the density and temperature of different regions (e.g., Kramer et al. 2004; Rodón et al. 2015). Both neutral and ionised carbon can be formed in low density gas, as they have critical densities of only cm-3 (Kaufman et al. 1999), while for the lowest CO transition in our data () the critical density is 100 times higher, cm-3.
We selected five representative SPIRE SLW beams to study the gas in the environment of our sources. For R Mon we selected C1, C2, C3 (R Mon), C4 and D4 (compact neighbour). For PDS 27 we selected C1, C2, C3 (PDS 27), C4 (neighbour) and D3. Apart from the central beam, the SPIRE spectra are not flux calibrated, but given that we want to calculate line ratios, this does not hamper our analysis. Also the fact that we do not have PACS spectra for the other beams does not affect our results, as we do not see higher CO transitions in those beams. For both objects, no lines were detected in beam C1. For R Mon, the beam C2 has a low signal-to-noise spectrum, where only [C I] (2-1) was detected. We calculate the following line ratios, following Rodón et al. (2015), see Table 4:
- rCI
-
= CI(2-1)/CI(1-0)
- rCICO
-
= CI/CO
The rCI ratio is sensitive to the density: optically thick [C I] lines have line ratios of about 1 or less, whereas optically thin lines have line ratios larger than 1. If the lines are optically thin, the excitation temperature is a function of the line ratio, with higher temperatures for higher ratios. For the beams at/around R Mon, we find rCI values between 1 and 2, indicating optically thin gas, while for PDS 27 we observe one beam (C2) where the gas is optically thick. Overall, we find higher CI line ratios in the parabolic shell above R Mon, suggesting warmer temperatures (as we describe in Section 5.2) than around PDS 27.
The relative importance of cooling by CI and CO can be characterised by the ratio rCICO that takes all CI and CO lines into account (see Table 4). A lower value of rCICO shows that cooling by CO is more important than by CI, a result of a higher density. In R Mon cooling by CO clearly dominates, less so in PDS 27. On the other hand, in R Mon beams C2 and D4, as well as in PDS 27 beams C2 and D4 cooling by CI dominates, thus in a lower-density environment. In the following subsection, we will use the CO rotational diagrams to further analyse the temperature of selected regions.
5.2 CO rotational diagrams
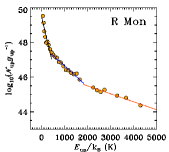
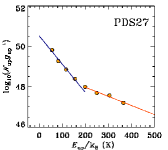
Carbon monoxide is the easiest molecule to analyse because its critical density, the upper level energy, and the frequency of its transitions increase monotonously as a function of the upper state, . In our spectra, we detected 26 transitions in R Mon and eight for PDS 27. In Figure 4, we present the CO rotational diagrams for our sources and selected regions of their environment. Under the assumption of local thermodynamic equilibrium (LTE), and optically thin emission, the number of molecules per degenerate sub-level in the upper state of the transition, , is proportional to the line flux. This way, one can assign a rotational temperature () that would be expected to be equal to the kinetic temperatures if all levels were thermalised, so that the temperature of the emitting gas can be determined.
The rotational diagram of R Mon shows a positive curvature in the entire wavelength range. Such a shape can be the result of a smooth distribution of gas temperatures captured in the beam (Neufeld 2012; Manoj et al. 2013a). Alternatively, the CO diagram can be reflecting the presence of three distinct physical components.
| Source | ||||
|---|---|---|---|---|
| (K) | (K) | (K) | ||
| R Mon | 7712 | 35820 | 94990 | (9.12.8) |
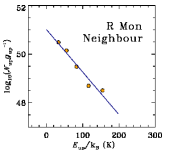
| Neighbour | 258 | – | – | (1.00.4) |
| Beam C2 | 4214 | – | – | (2.50.7) |
| Beam C4 | 3210 | – | – | (6.10.4) |
| PDS 27 | 314 | 9612 | – | (4.11.2) |
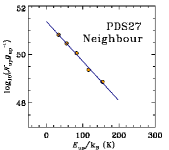
| Neighbour | 276 | – | – | (2.30.3) |
| Beam C2 | 306 | – | – | (2.80.8) |
| Beam D3 | 295 | – | – | (4.20.9) |
We fit three linear components to the CO rotational diagram of R Mon, with the breaks at = 431 K and = 1800 K. The temperatures corresponding to those components are 80 K, 360 K, and 950 K (see Table 5). The presence of warm and hot temperature components agrees with previous observations of HAeBe stars such as HD 100546 (e.g., Meeus et al. 2013; van der Wiel et al. 2014). In PDS 27, we can fit two components, corresponding to rotational temperatures of 30 K and 100 K. For the neighbours, we only fit one component with a rotational temperature of 25 K (R Mon) and 27 K (PDS 27). The total number of CO molecules among the different components that is observed is 3.4 for R Mon and 4.1 molecules in PDS 27. Additionally we selected several beams in the surrounding environments of R Mon (SLW C2, D4) and PDS 27 (SLW C2, D3) with detections up to CO (8-7), and derived rotational temperatures in the range 30-40 K.
Rotational diagrams, however, do not provide a unique description of the gas conditions. Non-LTE molecular excitation models are necessary to reproduce the observed of the different components. R Mon is the only case where we find warmer components of 350-950 K, therefore we can compare these results with the NLTE models shown in Fig. 12 of Karska et al. (2013). Based on the H2O emission and the high densities needed to excite it, the range of possible scenarios is better described by a situation where CO is close to LTE in a warm, dense () gas. These high densities are compatible with highly compressed gas, which has been found at a few hundred AU of the protostar and at shock positions (e.g., Santangelo et al. 2012; Tafalla et al. 2013).
In surveys of deeply-embedded low-mass protostars, CO emission can be described by up to 3 temperature components corresponding to 100, 300, and 700 K (Green et al. 2013; Karska et al. 2013; Manoj et al. 2013b), and it is interpreted as arising in shocks (Karska et al. 2014; Kristensen et al. 2017). The similarity of the CO emission in R Mon to those sources (Figure 4) suggests that also here the bulk of emission originates from an outflow, and not the disc. On the other hand, the lack of detection of CO towards PDS 27 shows its similarity to the more evolved disc sources where both the CO and H2O emission is scarce. This interpretation is further supported by the correlation between the [O I] 63 m emission and continuum in 63 m in disc sources (see Section 5.3).
5.3 [O I] and [C II]
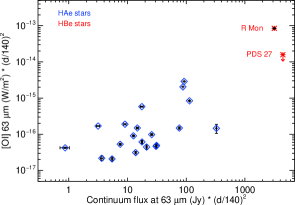
Previous studies have shown a correlation between the [O I] 63 m line flux and the continuum flux at 70 m for a sample of TTS (Howard et al. 2013) and HAe stars (Meeus et al. 2012). Howard et al. (2013) also found that sources with an outflow have stronger [O I] line fluxes than their non-outflow counterparts (see their Fig. 16). We study the [O I] emission in our sources and compare it to the observed one in HAe stars (data from GASPS observations; Meeus et al. 2012) in Figure 5. The top panel shows the observed [O I] emission versus the continuum flux. We see that, while PDS 27 still could follow the trend of the HAe stars, the line flux of R Mon is too high, as has been observed in TTS with outflows. Most likely, part of its [O I] emission originates at the base of its outflow (given that the emission is only seen in the central spaxel; see Figure 8), and not just in the disc.
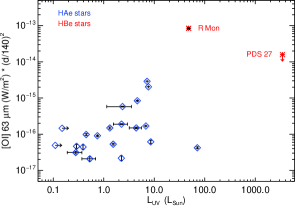
UV and X-ray radiation are very important for the chemistry and temperature balance of protoplanetary discs (e.g., Kamp et al. 2010; Aresu 2012). In particular, UV photons can heat their discs through the photo-electric effect in PAHs in the surface layers, as well as photo-evaporate the outer disc (Gorti & Hollenbach 2009). In Figure 5, bottom panel, we plot the [O I] 63 m line flux as a function of the UV luminosity (calculated as lower limits from atmosphere models in the range of 1150-2430 ). For HAe stars, there is a correlation between the [O I] 63 m flux and the UV luminosity, as reported earlier for a limited sample in Pinte et al. (2010) and supported by disc models in Kamp et al. (2011). R Mon clearly lies above the expected [O I] flux, which can be a consequence of an increase in OH photo-dissociation in the disc surface and/or close to the star, therefore a PDR emission result from the UV irradiation of the outflow. In addition, the data presented in this paper -enhanced [O I], [C II] and CO lines, as well as the presence of water lines- show clear evidence for emission from the shocked material due to the presence of the outflow, which can add up to the [O I] emission from the disc. However separating the contribution of the outflow from the PDR emission remains hard without resolved emission profiles. As the stellar UV luminosity for PDS 27 is much higher, one could also expect a higher [O I] flux, but this is not the case. This is possibly due to the rapid dissipation of gas in the disc of PDS 27 due to its harsh UV radiation.
The [C II] 157.7 m emission line of ionised carbon can originate in the disc surface, where it is mostly optically thin (Kamp et al. 2011), but also in the surroundings of the disc. The interpretation of the [C II] 157.7 m line is complex due to its relatively low spatial and spectral resolution. It could originate both in the disc and the environment, as the observed extended emission indicates. In PDS 27 we see the line in absorption, suggesting that the emission of the surroundings, used for background subtraction is higher than that of the star itself.
5.4 Comparison with other sources
| Object | Cooling Line luminosity (10-3 L⊙) | Lmol/L | LCO/F70 | LUV (L⊙) | |||||
| OI | CI | CII | CO | OH | H2O | ||||
| R Mon | 53.20 | 1.10 | 4.86 | 63.80 | 7.14 | 6.94 | 1.46 | 3.3 | 48 |
| PDS 27 | 12.17 | 3.00 | 2.53 | 14.71 | – | – | 1.21 | 0.54 | 3450 |
| HD 97048 | 1.32 | 0.02 | 0.09 | 0.34 | 0.027 | – | 0.28 | 6.4e-3 | 7.69 |
| HD 100546 | 1.94 | 0.01 | 0.06 | 0.47 | 0.026 | – | 0.26 | 8.6e-4 | 7.22 |
The far-IR emission in protostars can originate in distinct parts of the stellar environment, as described by van Dishoeck et al. (2011). In order to determine the dominant heating mechanism in our sources, we calculated the total line luminosity accounting for the observed transitions in each detected species (see Table 6).
For R Mon, cooling by CO and [O I] dominates, with CO 20% more than [O I]. Also, cooling by OH and H2O is present in R Mon in equal amounts, while in PDS 27 only cooling by CO is found. We compare cooling in HBe with that of two early HAe stars, HD 100546 and HD 97048, which have the largest UV fluxes of the HAe sample in Meeus et al. (2012). The HAe stars experience much less line cooling than the HBe stars, what can be explained by their difference in UV luminosity as shown in Kamp et al. (2011). This is also shown by the ratio of molecular to atomic cooling, Lmol/L, which is a factor 5 lower for HAe stars than for HBe stars: while in HAe stars atomic cooling dominates, HBe stars show more molecular cooling. Since our HBe stars are younger than the HAe stars and have a denser environment, it is interesting to compare to low-mass young objects: Karska et al. (2013) show that the ratio Lmol/L is close to unity for class I and II, while it is a factor 4-5 larger for class 0, the youngest sources, in agreement with our results. Our objects are somewhat more evolved, and in addition to the stellar heating of the disc, the UV-heated gas along cavity walls and winds can play a central role if shocks are present in HBe stars.
Outflow shocks can easily explain the heating of CO molecules, and therefore the unusually high CO luminosity in our HBe stars, the enhanced [O I] emission, and the presence of extended FIR water lines (e.g., Nisini et al. 2010; Karska et al. 2013) whose origin is corroborated by the broad line profiles of from HIFI (e.g., Kristensen et al. 2012; Mottram et al. 2014). In particular, R Mon shows a powerful outflow of a few hundreds of km/s (Canto et al. 1981; Close et al. 1997). The CO line-to-continuum ratio is at least a factor of 1000 larger for HBe than for HAe stars, which suggests the presence of both UV-heated and shock-excited gas (Meijerink et al. 2013). While the emission emission lines observed in R Mon can be explained with a combination of low-velocity shocks and PDRs (e.g. Kamp et al. 2011; Pellegrini et al. 2013), the environment in PDS 27 suggests that the central star dispersed most of the material and the detected emission comes mainly from the disc. On the contrary, no strong outflows are known in HAe stars, and the heating of the gas is mainly stellar.
6 Conclusions
We presented and analysed Herschel PACS and SPIRE spectroscopy, covering the range 60 to 700 m, to study the disc and environment of the Herbig Be stars R Mon and PDS 27. Our results can be summarised as follows:
-
•
We use new far-IR spectroscopy data to complement the ancillary near-IR and millimetre data for our targets in order to study their respective SEDs and calculate IR excesses. When compared with HAe stars, the IR excess of R Mon is much stronger, while that of PDS 27 is weaker, what could point to a smaller or less gas-rich disc. On the other hand, the FIR/NIR ratio of both stars is similar to that of group I HAe stars, indicative of a flared disc.
-
•
[O I] 63 m line is by far the strongest line observed in R Mon; with a [O I] 63/145 ratio of 9.9, at the lower end of the range found for HAe stars (10-30). In PDS 27 we do not detect [O I]. R Mon does not follow the correlation of [O I] 63 m line with UV luminosity nor with 70m continuum flux observed in HAe stars (Meeus et al. 2012). [C II] is present in variable strengths in all the spaxels of the PACS detector. In R Mon it is seen in emission, and in PDS 27 in absorption, indicating that at the chop off position the flux is higher than at the star.
-
•
We detect four water lines and three OH doublets in R Mon, but none in PDS 27. We attribute the presence of water in R Mon to the shocked material from the outflow, and the absence of water and OH lines in PDS 27 to the harsh UV field, photo-dissociating those molecules.
-
•
Forbidden lines of neutral carbon were detected for both sources at 370 and 609 m. However, these lines are also detected in most other SPIRE beams - in a FOV of , indicating that the lines originate in the low density environment rather than in the discs of the HBe stars.
-
•
We detect many CO emission lines: 26 transitions in R Mon (with PACS+SPIRE), and eight in PDS 27 (SPIRE). For the neighbours we detect five transitions, each within the SPIRE range. The highest transition ( with = 3279 K) is observed in R Mon. We construct rotational diagrams and find different temperature and density components in R Mon and PDS 27: a cold component with = 77 and 31 K for R Mon and PDS 27, respectively, and a warm component with = 358 and 96 K for R Mon and PDS 27, respectively. An extra hot temperature component of 949 K is observed for R Mon. For the neighbours we only need one component 25 K, thus cooler sources.
-
•
The derived physical conditions and gas cooling budget in R Mon show a close similarity to more embedded star forming regions, suggesting that the emission originates from the surroundings rather than the disc. The dominant CO cooling, the enhanced [O I] and [C II] and the presence of water lines suggest that shocks associated to the outflow in the environment of R Mon, are the main source for the gas heating. In contrast, the FIR characteristics of PDS 27 resemble those of Herbig Ae stars. Here, the gas is UV-heated from the B2 star, dispersing the surrounding material; therefore the detected emission originates from the disc.
Acknowledgements.
The authors thank Daniel Harsono, Eric Pellegrini and Sacha Hony for excellent conversations that have improved this manuscript. GM is funded by Spanish grant RyC–2011–07920. GM and CE acknowledge partial support from the Spanish grant AYA2014–55840–P. AK acknowledges support from the Polish National Science Center grants 2013/11/N/ST9/00400 and 2016/21/D/ST9/01098.References
- Ababakr et al. (2015) Ababakr, K. M., Fairlamb, J. R., Oudmaijer, R. D., & van den Ancker, M. E. 2015, MNRAS, 452, 2566
- Acke et al. (2008) Acke, B., Verhoelst, T., van den Ancker, M. E., et al. 2008, A&A, 485, 209
- Alonso-Albi et al. (2009) Alonso-Albi, T., Fuente, A., Bachiller, R., et al. 2009, A&A, 497, 117
- Aresu (2012) Aresu, G. 2012, PhD thesis, Groningen University
- Bans & Königl (2012) Bans, A. & Königl, A. 2012, ApJ, 758, 100
- Beichman et al. (1986) Beichman, C. A., Myers, P. C., Emerson, J. P., et al. 1986, ApJ, 307, 337
- Brugel et al. (1984) Brugel, E. W., Mundt, R., & Buehrke, T. 1984, ApJ, 287, L73
- Canto et al. (1981) Canto, J., Rodriguez, L. F., Barral, J. F., & Carral, P. 1981, ApJ, 244, 102
- Close et al. (1997) Close, L. M., Roddier, F., Hora, J. L., et al. 1997, ApJ, 489, 210
- Dullemond & Dominik (2004a) Dullemond, C. P. & Dominik, C. 2004a, A&A, 417, 159
- Dullemond & Dominik (2004b) Dullemond, C. P. & Dominik, C. 2004b, A&A, 421, 1075
- Fedele et al. (2013) Fedele, D., Bruderer, S., van Dishoeck, E. F., et al. 2013, A&A, 559, A77
- Fedele et al. (2011) Fedele, D., Pascucci, I., Brittain, S., et al. 2011, ApJ, 732, 106
- Finkenzeller & Mundt (1984) Finkenzeller, U. & Mundt, R. 1984, A&AS, 55, 109
- Fuente et al. (2006) Fuente, A., Alonso-Albi, T., Bachiller, R., et al. 2006, ApJ, 649, L119
- Fuente et al. (2003) Fuente, A., Rodríguez-Franco, A., Testi, L., et al. 2003, ApJ, 598, L39
- Gorti & Hollenbach (2009) Gorti, U. & Hollenbach, D. 2009, ApJ, 690, 1539
- Green et al. (2013) Green, J. D., Evans, II, N. J., Jørgensen, J. K., et al. 2013, ApJ, 770, 123
- Griffin et al. (2010) Griffin, M. J., Abergel, A., Abreu, A., et al. 2010, A&A, 518, L3
- Herbig (1960) Herbig, G. H. 1960, ApJS, 4, 337
- Hogerheijde et al. (2011) Hogerheijde, M. R., Bergin, E. A., Brinch, C., et al. 2011, Science, 334, 338
- Hollenbach et al. (1994) Hollenbach, D., Johnstone, D., Lizano, S., & Shu, F. 1994, ApJ, 428, 654
- Howard et al. (2013) Howard, C. D., Sandell, G., Vacca, W. D., et al. 2013, ApJ, 776, 21
- Jones & Herbig (1982) Jones, B. F. & Herbig, G. H. 1982, AJ, 87, 1223
- Kamp et al. (2010) Kamp, I., Tilling, I., Woitke, P., Thi, W.-F., & Hogerheijde, M. 2010, A&A, 510, A18
- Kamp et al. (2011) Kamp, I., Woitke, P., Pinte, C., et al. 2011, A&A, 532, A85
- Karska et al. (2013) Karska, A., Herczeg, G. J., van Dishoeck, E. F., et al. 2013, A&A, 552, A141
- Karska et al. (2014) Karska, A., Kristensen, L. E., van Dishoeck, E. F., et al. 2014, A&A, 572, A9
- Kaufman et al. (1999) Kaufman, M. J., Wolfire, M. G., Hollenbach, D. J., & Luhman, M. L. 1999, ApJ, 527, 795
- Kramer et al. (2004) Kramer, C., Jakob, H., Mookerjea, B., et al. 2004, A&A, 424, 887
- Kraus et al. (2008) Kraus, S., Hofmann, K.-H., Benisty, M., et al. 2008, A&A, 489, 1157
- Kristensen et al. (2017) Kristensen, L. E., Gusdorf, A., Mottram, J. C., et al. 2017, ArXiv e-prints [arXiv:1704.07593]
- Kristensen et al. (2012) Kristensen, L. E., van Dishoeck, E. F., Bergin, E. A., et al. 2012, A&A, 542, A8
- Kurucz (1993) Kurucz, R. L. 1993, VizieR Online Data Catalog, 6039
- Leurini et al. (2015) Leurini, S., Wyrowski, F., Wiesemeyer, H., et al. 2015, A&A, 584, A70
- Maaskant et al. (2015) Maaskant, K. M., de Vries, B. L., Min, M., et al. 2015, A&A, 574, A140
- Maaskant et al. (2013) Maaskant, K. M., Honda, M., Waters, L. B. F. M., et al. 2013, A&A, 555, A64
- Manchado et al. (1990) Manchado, A., Garcia-Lario, P., Sahu, K. C., & Pottasch, S. R. 1990, A&AS, 84, 517
- Manoj et al. (2013a) Manoj, P., Watson, D. M., Neufeld, D. A., et al. 2013a, ApJ, 763, 83
- Manoj et al. (2013b) Manoj, P., Watson, D. M., Neufeld, D. A., et al. 2013b, ApJ, 763, 83
- McKee & Ostriker (2007) McKee, C. F. & Ostriker, E. C. 2007, ARA&A, 45, 565
- Meeus et al. (2012) Meeus, G., Montesinos, B., Mendigutía, I., et al. 2012, A&A, 544, A78
- Meeus et al. (2013) Meeus, G., Salyk, C., Bruderer, S., et al. 2013, A&A, 559, A84
- Meeus et al. (2001) Meeus, G., Waters, L. B. F. M., Bouwman, J., et al. 2001, A&A, 365, 476
- Meijerink et al. (2013) Meijerink, R., Kristensen, L. E., Weiß, A., et al. 2013, ApJ, 762, L16
- Mora et al. (2001) Mora, A., Merín, B., Solano, E., et al. 2001, A&A, 378, 116
- Mottram et al. (2014) Mottram, J. C., Kristensen, L. E., van Dishoeck, E. F., et al. 2014, A&A, 572, A21
- Neufeld (2012) Neufeld, D. A. 2012, ApJ, 749, 125
- Nisini et al. (2010) Nisini, B., Benedettini, M., Codella, C., et al. 2010, A&A, 518, L120
- Nisini et al. (2015) Nisini, B., Santangelo, G., Giannini, T., et al. 2015, ApJ, 801, 121
- Ott (2010) Ott, S. 2010, in Astronomical Society of the Pacific Conference Series, Vol. 434, Astronomical Data Analysis Software and Systems XIX, ed. Y. Mizumoto, K.-I. Morita, & M. Ohishi, 139
- Pascual et al. (2016) Pascual, N., Montesinos, B., Meeus, G., et al. 2016, A&A, 586, A6
- Pellegrini et al. (2013) Pellegrini, E. W., Smith, J. D., Wolfire, M. G., et al. 2013, ApJ, 779, L19
- Pinte et al. (2010) Pinte, C., Woitke, P., Ménard, F., et al. 2010, A&A, 518, L126
- Poglitsch et al. (2010) Poglitsch, A., Waelkens, C., Geis, N., et al. 2010, A&A, 518, L2
- Riviere-Marichalar et al. (2012) Riviere-Marichalar, P., Ménard, F., Thi, W. F., et al. 2012, A&A, 538, L3
- Rodón et al. (2015) Rodón, J. A., Zavagno, A., Baluteau, J.-P., et al. 2015, A&A, 579, A10
- Sandell et al. (2011) Sandell, G., Weintraub, D. A., & Hamidouche, M. 2011, ApJ, 727, 26
- Santangelo et al. (2012) Santangelo, G., Nisini, B., Giannini, T., et al. 2012, A&A, 538, A45
- Sturm et al. (2013) Sturm, B., Bouwman, J., Henning, T., et al. 2013, A&A, 553, A5
- Tafalla et al. (2013) Tafalla, M., Liseau, R., Nisini, B., et al. 2013, A&A, 551, A116
- Thi & Bik (2005) Thi, W.-F. & Bik, A. 2005, A&A, 438, 557
- van der Wiel et al. (2014) van der Wiel, M. H. D., Naylor, D. A., Kamp, I., et al. 2014, MNRAS, 444, 3911
- van Dishoeck et al. (2011) van Dishoeck, E. F., Kristensen, L. E., Benz, A. O., et al. 2011, PASP, 123, 138
- Verhoeff et al. (2012) Verhoeff, A. P., Waters, L. B. F. M., van den Ancker, M. E., et al. 2012, A&A, 538, A101
- Vieira et al. (2003) Vieira, S. L. A., Corradi, W. J. B., Alencar, S. H. P., et al. 2003, AJ, 126, 2971
Appendix A SPIRE beams
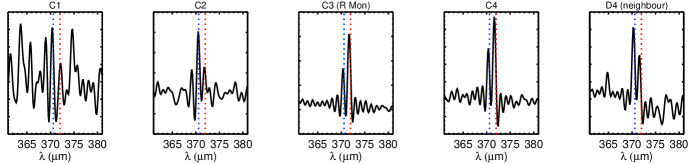
In Figure 6, we plot the beams of the SPIRE detectors on the SPIRE images, together with the corresponding labels. In Figure 7 we zoom in around 370 m, to reveal what species dominates cooling at those wavelengths: in R Mon and beam C4, CO dominates, while in PDS 27 and C4 there are roughly equal contributions. In others beams neutral carbon emission dominates.
Appendix B The [O I] and [C II] emission as observed with PACS
In Figure 8 we show the 25 spaxels around the stars zoomed in on the [C II] feature. It is clear that the feature is present in variable strengths, in R Mon in emission at the stellar position and towards the N, while in absorption to the S. In PDS 27 we see the feature in absorption in almost all spaxels.