HuGaDB: Human Gait Database for Activity Recognition from Wearable Inertial Sensor Networks
Abstract
This paper presents a human gait data collection for analysis and activity recognition consisting of continues recordings of combined activities, such as walking, running, taking stairs up and down, sitting down, and so on; and the data recorded are segmented and annotated. Data were collected from a body sensor network consisting of six wearable inertial sensors (accelerometer and gyroscope) located on the right and left thighs, shins, and feet. Additionally, two electromyography sensors were used on the quadriceps (front thigh) to measure muscle activity. This database can be used not only for activity recognition but also for studying how activities are performed and how the parts of the legs move relative to each other. Therefore, the data can be used (a) to perform health-care-related studies, such as in walking rehabilitation or Parkinson’s disease recognition, (b) in virtual reality and gaming for simulating humanoid motion, or (c) for humanoid robotics to model humanoid walking. This dataset is the first of its kind which provides data about human gait in great detail. The database is available free of charge https://github.com/romanchereshnev/HuGaDB.
1 Introduction
The increasing availability of wearable body sensors leads to novel scientific studies and industrial applications [1]. The main large areas include gesture recognition, human activity recognition, and human gait analysis. Several databases have been released for benchmarking; however, due to a wide variety of sensor types and the complexity of activities, these databases are rather distinct. Now, we will review these areas and the corresponding databases in a taxonomic manner.
Gesture recognition (GR) mainly focuses on recognizing hand-drawn gestures in the air. Patterns to be recognized may include numbers, circles, boxes, or Latin alphabet letters. Prediction is usually made on data obtained from smartphone sensors or some special gloves equipped with kinematic sensors, such as 3-axis accelerometers, 3-axis gyroscopes, and occasionally electromyography (EMG) sensors, to measure the electrical potential on the human skin during muscular activities [2]. A database for gesture recognition is available in [3].
Human activity recognition (HAR), on the other hand, aims at recognizing daily lifestyle activities. For instance, an interesting research topic is recognizing activities in or around the kitchen, such as cooking; loading the dishwasher or washing machine; preparing brownies or salads; scrambling eggs; light cleaning; opening or closing drawers, the fridge, or doors; and so on. Often these activities can be interrupted by, for example, answering phones. Databases on this topic include the MIT Place dataset [4, 5], Darmstadt Daily Routine dataset [6], Ambient Kitchen [7], CMU Multi-Modal Activity Database (CMU-MMAC) [8], and Opportunity dataset [9, 10]. In this topic, on-body inertial sensors are usually worn on the wrist, back, or ankle, however, additional sensors are used, such as temperature sensor, proximity sensor, water consumption sensor, heart rate and so on. For instance, CMU-MMAC includes videos, audios, RFID tags, motion capture system based on on-body markers, and physiological sensors such as galvanic skin response (GSR) and skin temperature, which are all located on both forearms and upper arms, left and right calves and thighs, abdomen, and wrists.
Other types of HAR usually focus on walking-related activities, such as walking, jogging, turning left or right, jumping, laying down, going up or down the stairs, and so on. Data on this topic can be found in the WARD dataset [11], PAMAP2 dataset [12, 13], HASC challenge [14, 15, 16], USC-HAD [17, 18], and MAREA [19]. For data collection, on-body sensors are often placed on the participant’s wrist, waist, ankles, and back.
In some databases, exceptional efforts are taken to provide a reliable benchmark. The body sensor network conference (BSNC) (http://bsncontest.org) [20], for instance, has carried out a contest where organizers provided three different datasets from different research groups. Databases differ in sensor types used and activities recorded. Another team, called the Evaluating Ambient Assisted Living Systems through Competitive Benchmarking – Activity Recognition (EvAAL-AR), provides a service to evaluate HAR systems live on the same activity scenarios performed by an actor [21]. In this contest, each team brings its own activity recognition system, and the evaluation criteria attempt to capture the practical usability: recognition accuracy, user acceptance, recognition delay, installation complexity, and interoperability with ambient-assisted living systems.
Gait analysis focuses not only on the recognition of activities observed but also on how activities are performed. This can be useful in health-care systems for monitoring patients recovering after surgery or fall detection or in diagnosing the state of, for example, Parkinson’s disease [22, 23]. For instance, the Daphnet Gait dataset (DG) [24] consists of recordings of 10 participants affected with Parkinson’s disease instructed to carry out activities that are likely to be difficult to perform, such as walking. The objective is to detect these incidents from accelerometer data recorded from above the ankle, above the knee, and on the trunk. On the other hand, Bovi et al. provide a gait dataset collected from 40 healthy people with various ages as a reference dataset [25]. In the aforementioned BSNC, the third database (ID:IC) contains gait data before knee surgery and 1, 3, 6, 12, and 24 weeks (respectively) after it.
2 Motivation and Design Goals
The main purpose of this dataset is to provide detailed gait data to study how the parts of the legs move individually and relative to each other during activities such as walking, running, standing up, and so on. A summary of the activities can be found in Table 1. This dataset contains continuous recordings of combinations of activities, and the data are segmented and annotated with the label of the activity currently performed. Thus, this dataset is also suitable for analyzing human gait and activities between transitions.
Mainly inertial sensors were used for data acquisition. We decided to use inertial sensors because they are inexpensive, simple to use anywhere such as indoor and outdoor area, and widely available compared with other systems. For instance, compared with video-based motion capture systems, they require expensive video cameras and special full bodysuit with special markers on it. In addition, they are restricted to being used in the installed test area and they are sensitive to lightning and suffer from lost markers phenomenon.
In total, six inertial sensors were placed on the right and left thighs, shins and feet; and data were collected from 18 healthy participants, providing total 10 hours of recording. This allows one to investigate how the parts of the legs move individually and relative to each other within and in-between activities. Our dataset could be used as control data, for instance, in health-care-related studies, such as walking rehabilitation or Parkinson’s disease recognition. In virtual reality or gaming, our dataset can be used to model a virtual human movements by reproducing the leg movements from the accelerometer data by simply taking the integrals. In fact, it is not limited to virtual environment and could be used to train to walk and move humanoid robots to make them more humanlike and cope with the uncanny valley.
This dataset is unique in the sense that it is the first to provide human gait data in great detail mainly from inertial sensors and contains segmented annotations for studying the transition between different activities.
ID Activity Time sec (min) Percent Samples Description 1 Walking 11544 (192) 32.15 679073 Walking and turning at various speeds on a flat surface 2 Running 1218 (20) 3.39 71653 Running at various paces 3 Going up 2237 (37) 6.23 131604 Taking stairs up at various speeds 4 Going down 1982 (33) 5.52 116637 Taking the stairs down at various speeds and steps 5 Sitting 4111 (68) 11.45 241849 Sitting on a chair; sitting on the floor not included 6 Sitting down 409 (6) 1.14 24112 Sitting on a chair; sitting down on the floor not included 7 Standing up 380 (6) 1.06 22373 Standing up from a chair 8 Standing 5587 (93) 15.56 328655 Static standing on a solid surface 9 Bicycling 2661 (44) 7.41 156560 Typical bicycling 10 Up by elevator 1515 (25) 4.22 89144 Standing in an elevator while moving up 11 Down by elevator 1185 (19) 3.30 69729 Standing in an elevator while moving down 12 Sitting in car 3069 (51) 8.55 180573 Sitting while an travelling by car as a passenger Total 35903 598 100.00 2111962
3 Data Collection and Sensor Network Topology
In data collection, we used MPU9250 inertial sensors and electromyography (EMG) sensors. Each EMG sensor has a voltage gain is about 5000 and band-pass filter with bandwidth corresponding to power spectrum of EMG (10-500 Hz). A sample rate of each EMG-channel is 1.0 kHz, ADC resolution is 8 bits, input voltages: 0 - 5 Volts. The inertial sensors consisted of a 3-axis accelerometer and a 3-axis gyroscope integrated into a single chip. Data were collected with accelerometer’s range equal to g with sensitivity 16.384 LSB/g and gyroscope’s range equal to s with sensitivity 16.4 LSB s. All sensors are powered from a battery, that helps to minimize electrical grid noise.
Accelerometer and gyroscope signals were stored in int16 format. EMG signals are stored in uint8. Therefore, accelerometer data can be converted to m / s2 by dividing raw data 32768 and multiplying it by 2g. Raw gyroscope data can be converted to s by multiplying it by 2000/32768. Raw EMG data can be converted to Volts by multiplying it 0.001/255. We kept the raw data in our data collection in case one prefers other normalization techniques.
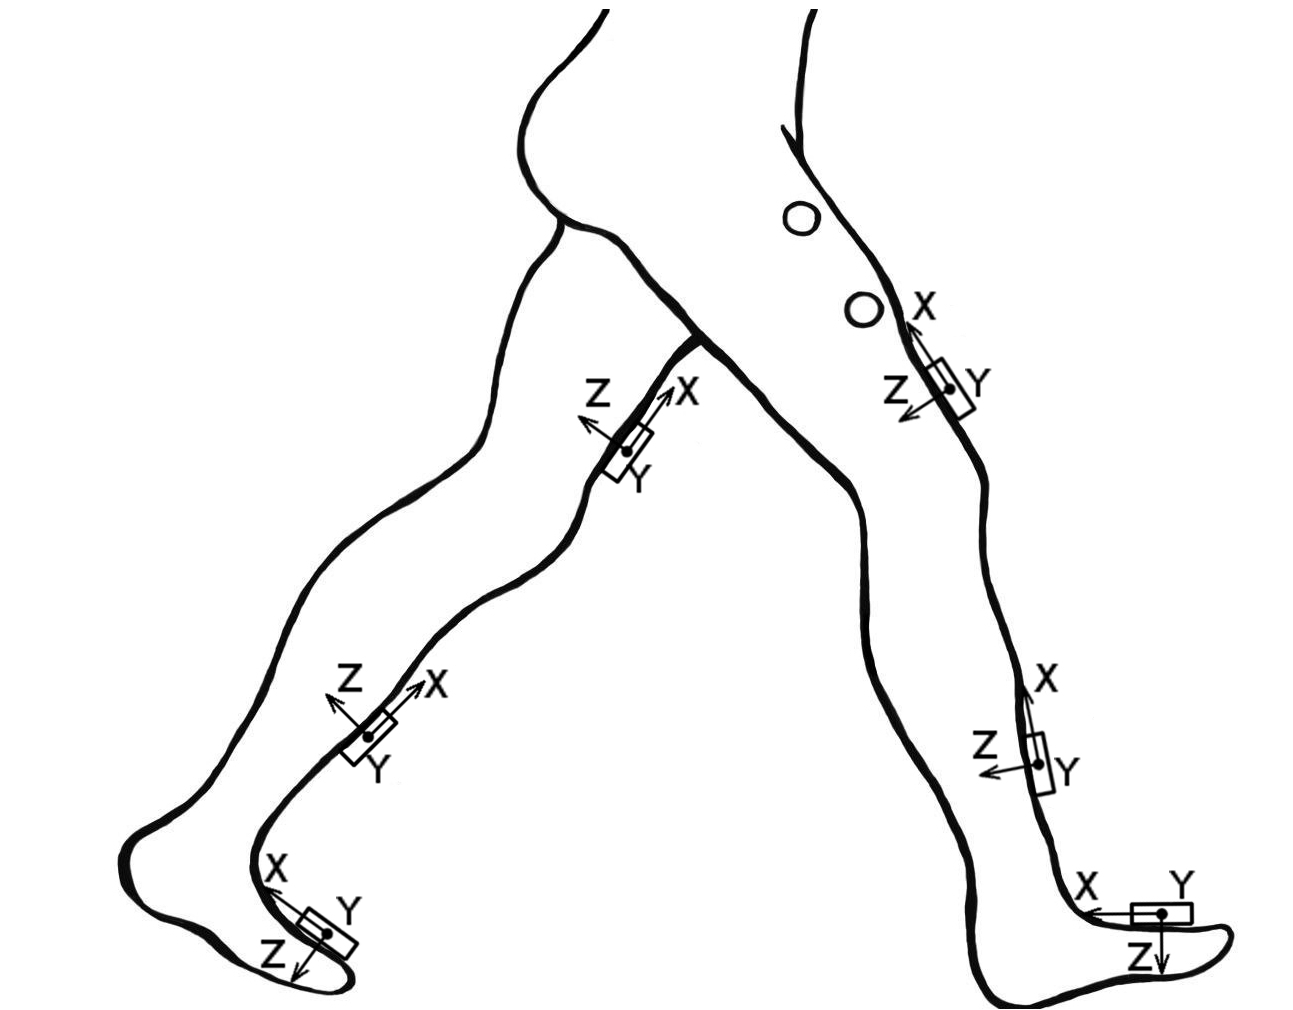
In total, three pairs of inertial sensors and one pair of EMG sensors were installed symmetrically on the right and left legs with elastic bands. A pair of inertial sensors were installed on the rectus femoris muscle 5 centimetres above the knee, a pair of sensors around the middle of the shinbone at the level where the calf ends, and a pair on the feet on the metatarsal bones. Two EMG sensors were placed on vastus lateralis and connected to the skin with three electrodes. The locations of the sensors are shown in Figure 1. In total, 38 signals were collected, 36 from the inertial sensors and 2 from the EMG sensors.
The sensors were connected through wires with each other and to a microcontroller box, which contained an Arduino electronics platform with a Bluetooth module. The microcontroller collected 56.3500 samples per second in average with standard deviation (std) 3.2057 and then transmitted them to a laptop through Bluetooth connection.
The data were collected from 18 participants. These participants were healthy young adults: 4 females and 14 males, average age of 23.67 (std: 3.69) years, an average height of 179.06 (std: 9.85) cm, and an average weight of 73.44 (std: 16.67) kg.
The participants performed a combination of activities at normal speed and casual way, and there were no obstacles placed on their way. For instance, a participant was instructed to perform the following activities: starting from a sitting position, sitting - standing up - walking - going up the stairs - walking - sitting down. The experimenter recorded the data continually using a laptop and annotated the data with the activities performed. This provided us a long, continuous sequence of segmented data annotated with activities. We developed our own data collector program. In total, 2,111,962 samples were collected from all the 18 participants, and they provided a total of 10 hours of data.
Data acquisition was carried out mainly inside a building. However, activities such as running, bicycling, and sitting in a car were performed outside. We collected data in a moving elevator and vehicle. In these scenarios, the activities performed were simply standing or sitting. However, a force impact on the accelerometer sensors and in certain applications, it may be important to consider these facts. Note that we did not collect data on a treadmill.
4 Data Format
Data obtained from the sensors were stored in flat text files. We decided to store the data in flat files because they have one of the most universal formats, and they can be easily preprocessed in all programming languages on every system. One data file contains one recording, which is either a single activity (e.g., walking) or a series of activities. Every file name was created according to the template HGD_vX_ACT_PR_CNT.txt. HGD is a prefix that means human gait data and vX means the version of the data files, currently v1. ACT is a variable, and it denotes the activity ID that was performed. If a file contains a series of different types of activities, then it is indicated as VARIOUS. PR indicates the ID of the person who performed the activity. Data recording was repeated a few times, and CNT is a counter for this. For example, a file named HGD_v1_walking_17_02.txt contains data from participant 17 while he was walking for the second time. The file naming convention is summarized in Table 2.
| TAG | Description | Type | Comment |
|---|---|---|---|
| HGD | Prefix | fixed | Data files start with this prefix |
| vX | Version number | integer | Indicates the version of the data format |
| ACT | Activity | string | Indicates the type of activity |
| PR | Participant ID | integer | Indicates the subject whos data was recorded |
| CNT | Counter | integer | Counter for repeated experiments |
TAG Description Type Comment #Activity List of the activities string Lists the activity types in this file #ActivityID List of the ID of activities List of integers lists the activity types in this file #Date-Time Date and Time YEAR-MM-DD-HR-MN Year-Month-Day-Hour-Min format
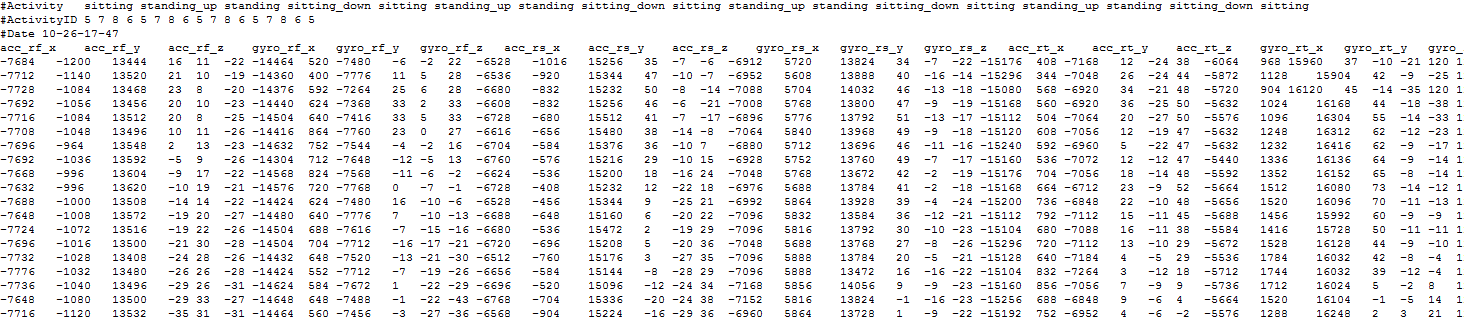
The main body of the data files contains tab-delimited raw, unnormalized data obtained from the sensors directly. Each data file starts with a header, which contains metainformation. It summarizes the list of activities, the IDs of the activities recorded, and the time and date of the recording. This is summarized in Table 3.
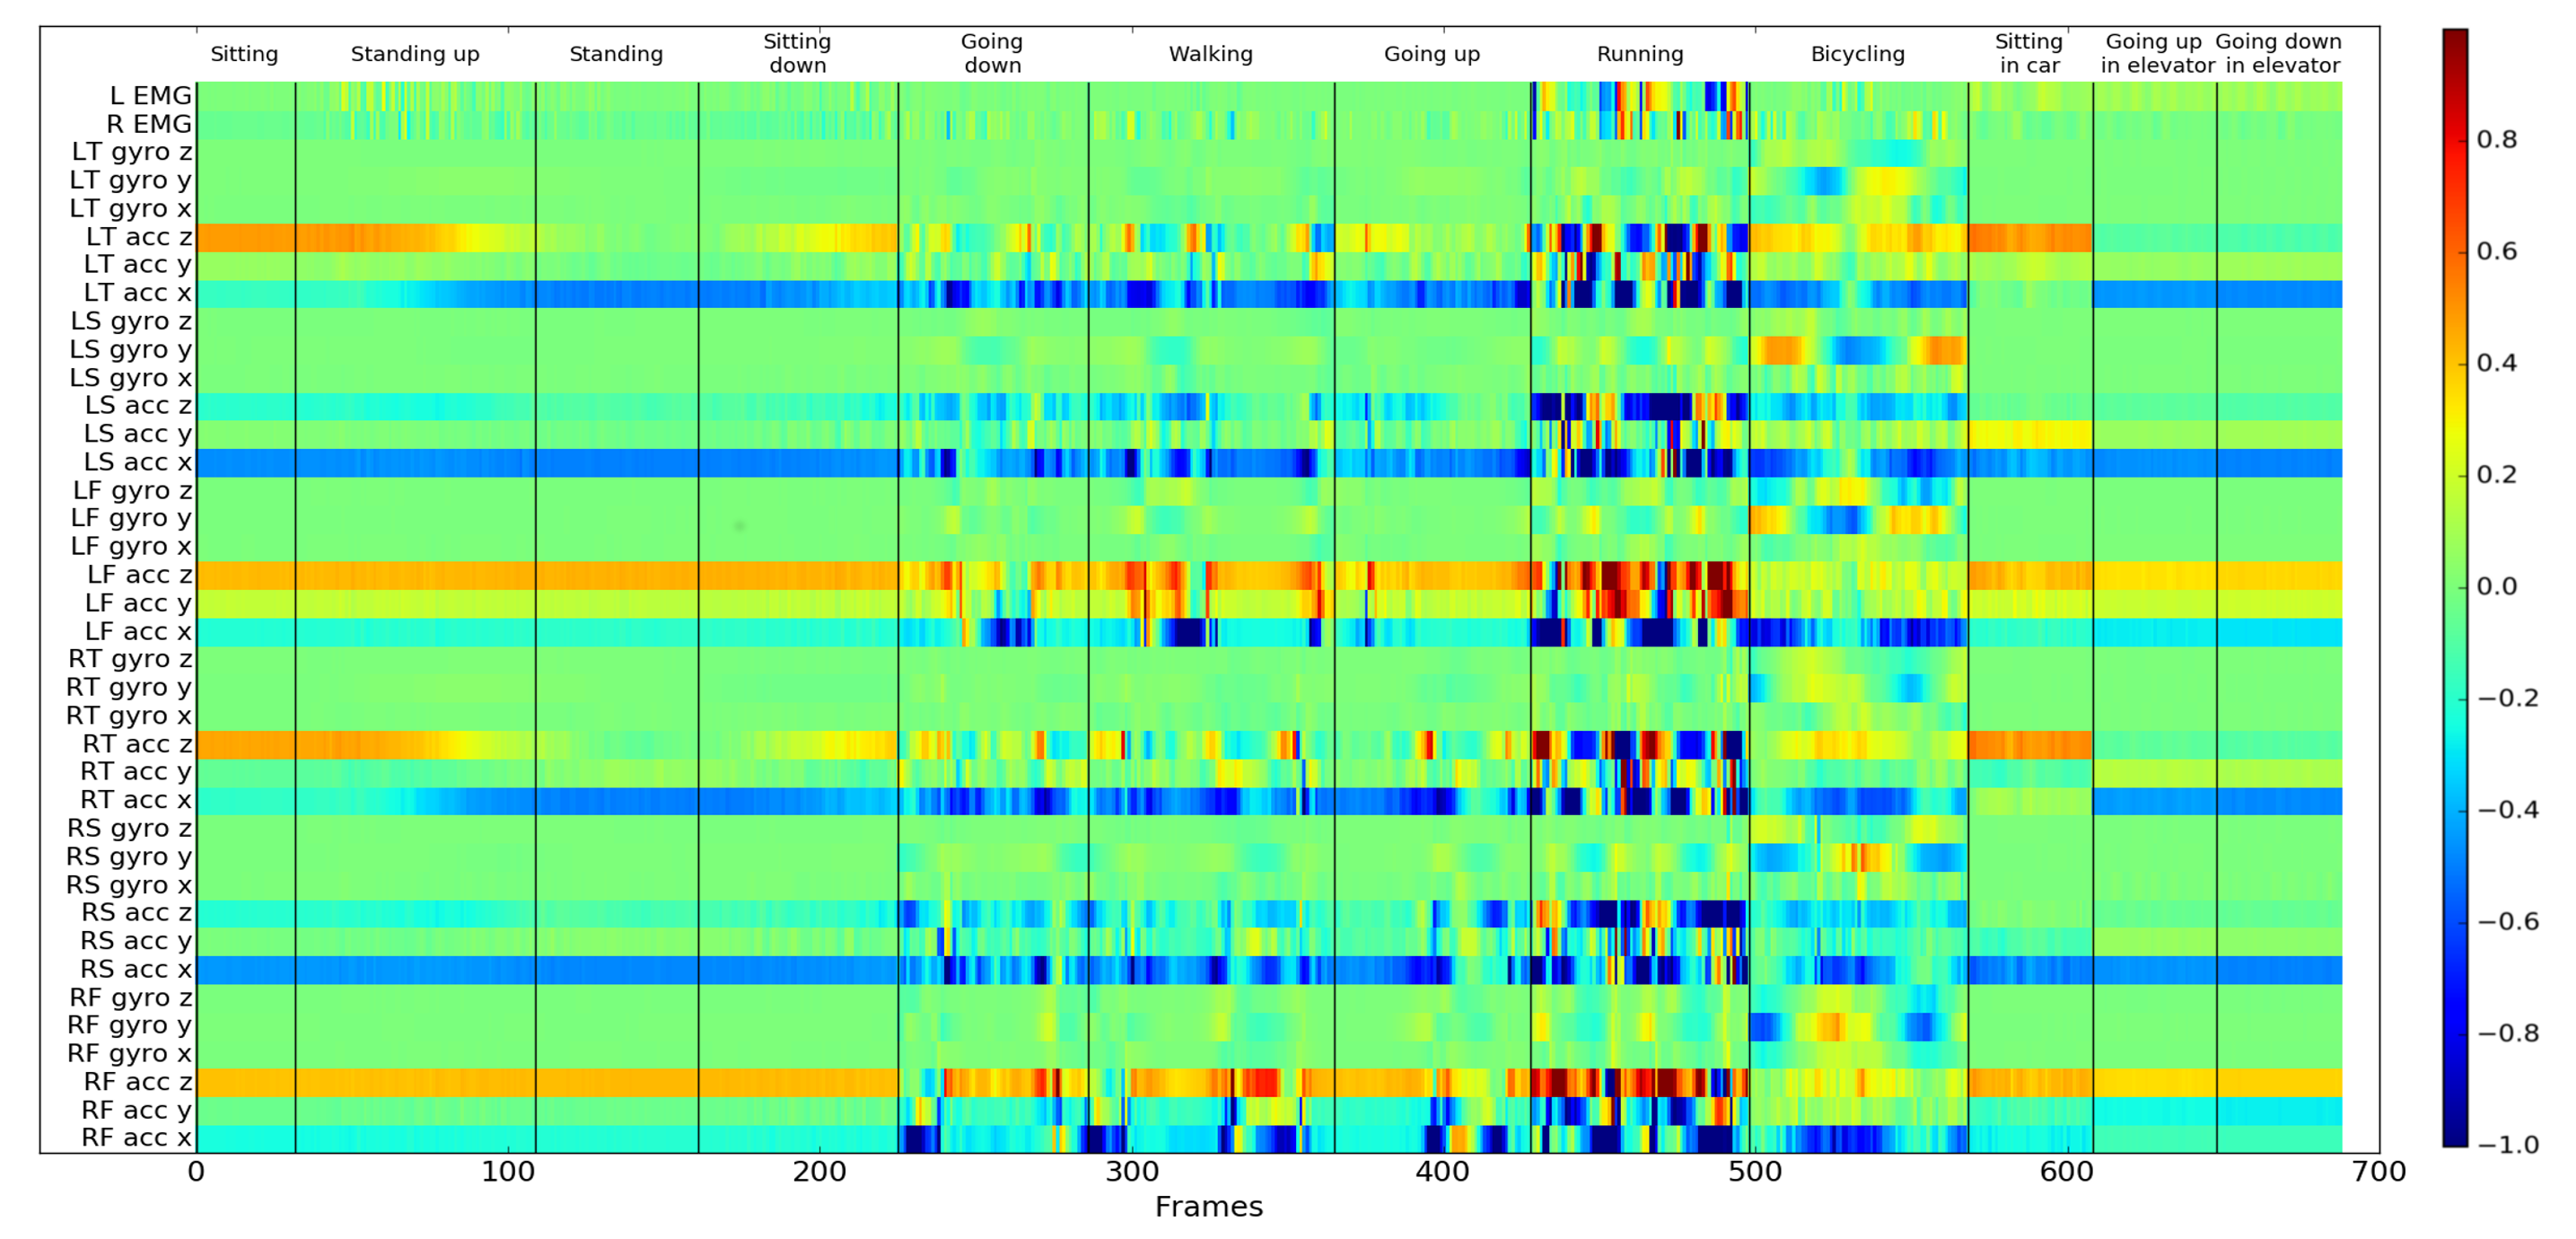
The main data body of every file has 39 columns. Each column corresponds to a sensor, and one row corresponds to a sample. The order of the columns is fixed. The first 36 columns correspond to the inertial sensors, the next 2 columns correspond to the EMG sensors, and the last column contains the activity ID. The activities are coded as shown in Table 1. The inertial sensors are listed in the following order: right foot (RF), right shin (RS), right thigh (RT), left foot (LT), left shin (LS), and left thigh (LT), followed by right EMG (R) and left EMG (L). Each inertial sensor produces three acceleration data on x,y,z axes and three gyroscope data on x,y,z axes. For instance, the column named ’RT_acc_z’ contains data obtained from the z-axis of accelerometer located on the right thigh.
Sample data with respect to the activities are visualized through a heat map representation in Figure 2.
A screenshot of some part of data file can be seen in Figure 3
The data files can be loaded easily in most of the popular programming languages. For instance, they can be loaded in Python using the following script:
Please note that it requires NumPy library. It also can be loaded in Matlab with the following one-line command:
We have prepared a script to load the data into SQLite database, which is available at the database’s website: https://github.com/romanchereshnev/HuGaDB/blob/master/Scripts/create_db.py.
5 Discussion on Data Variance
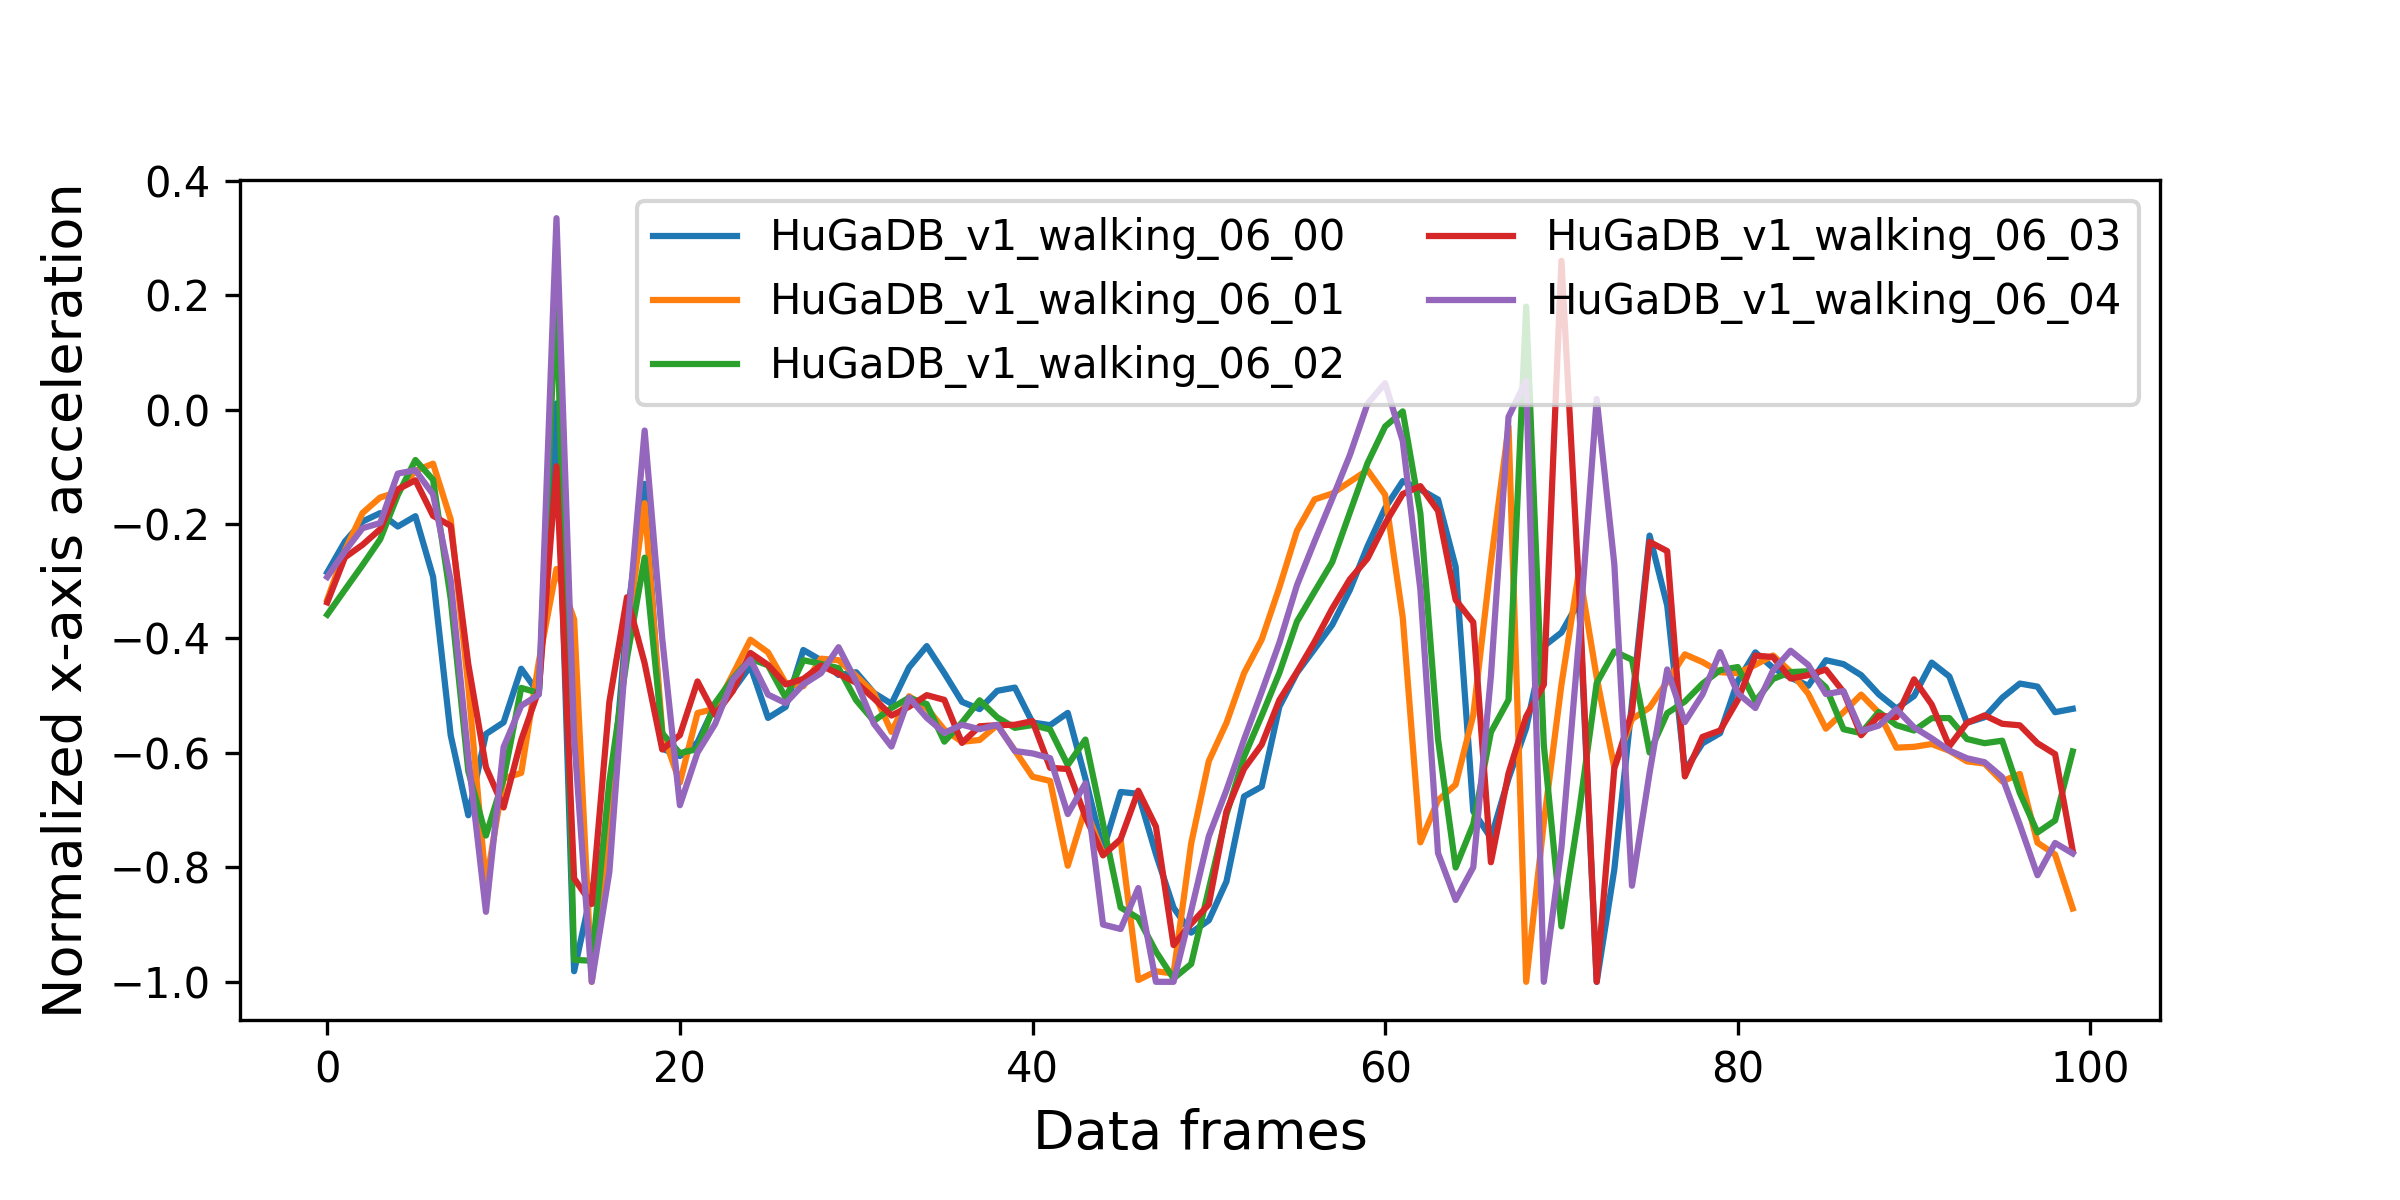
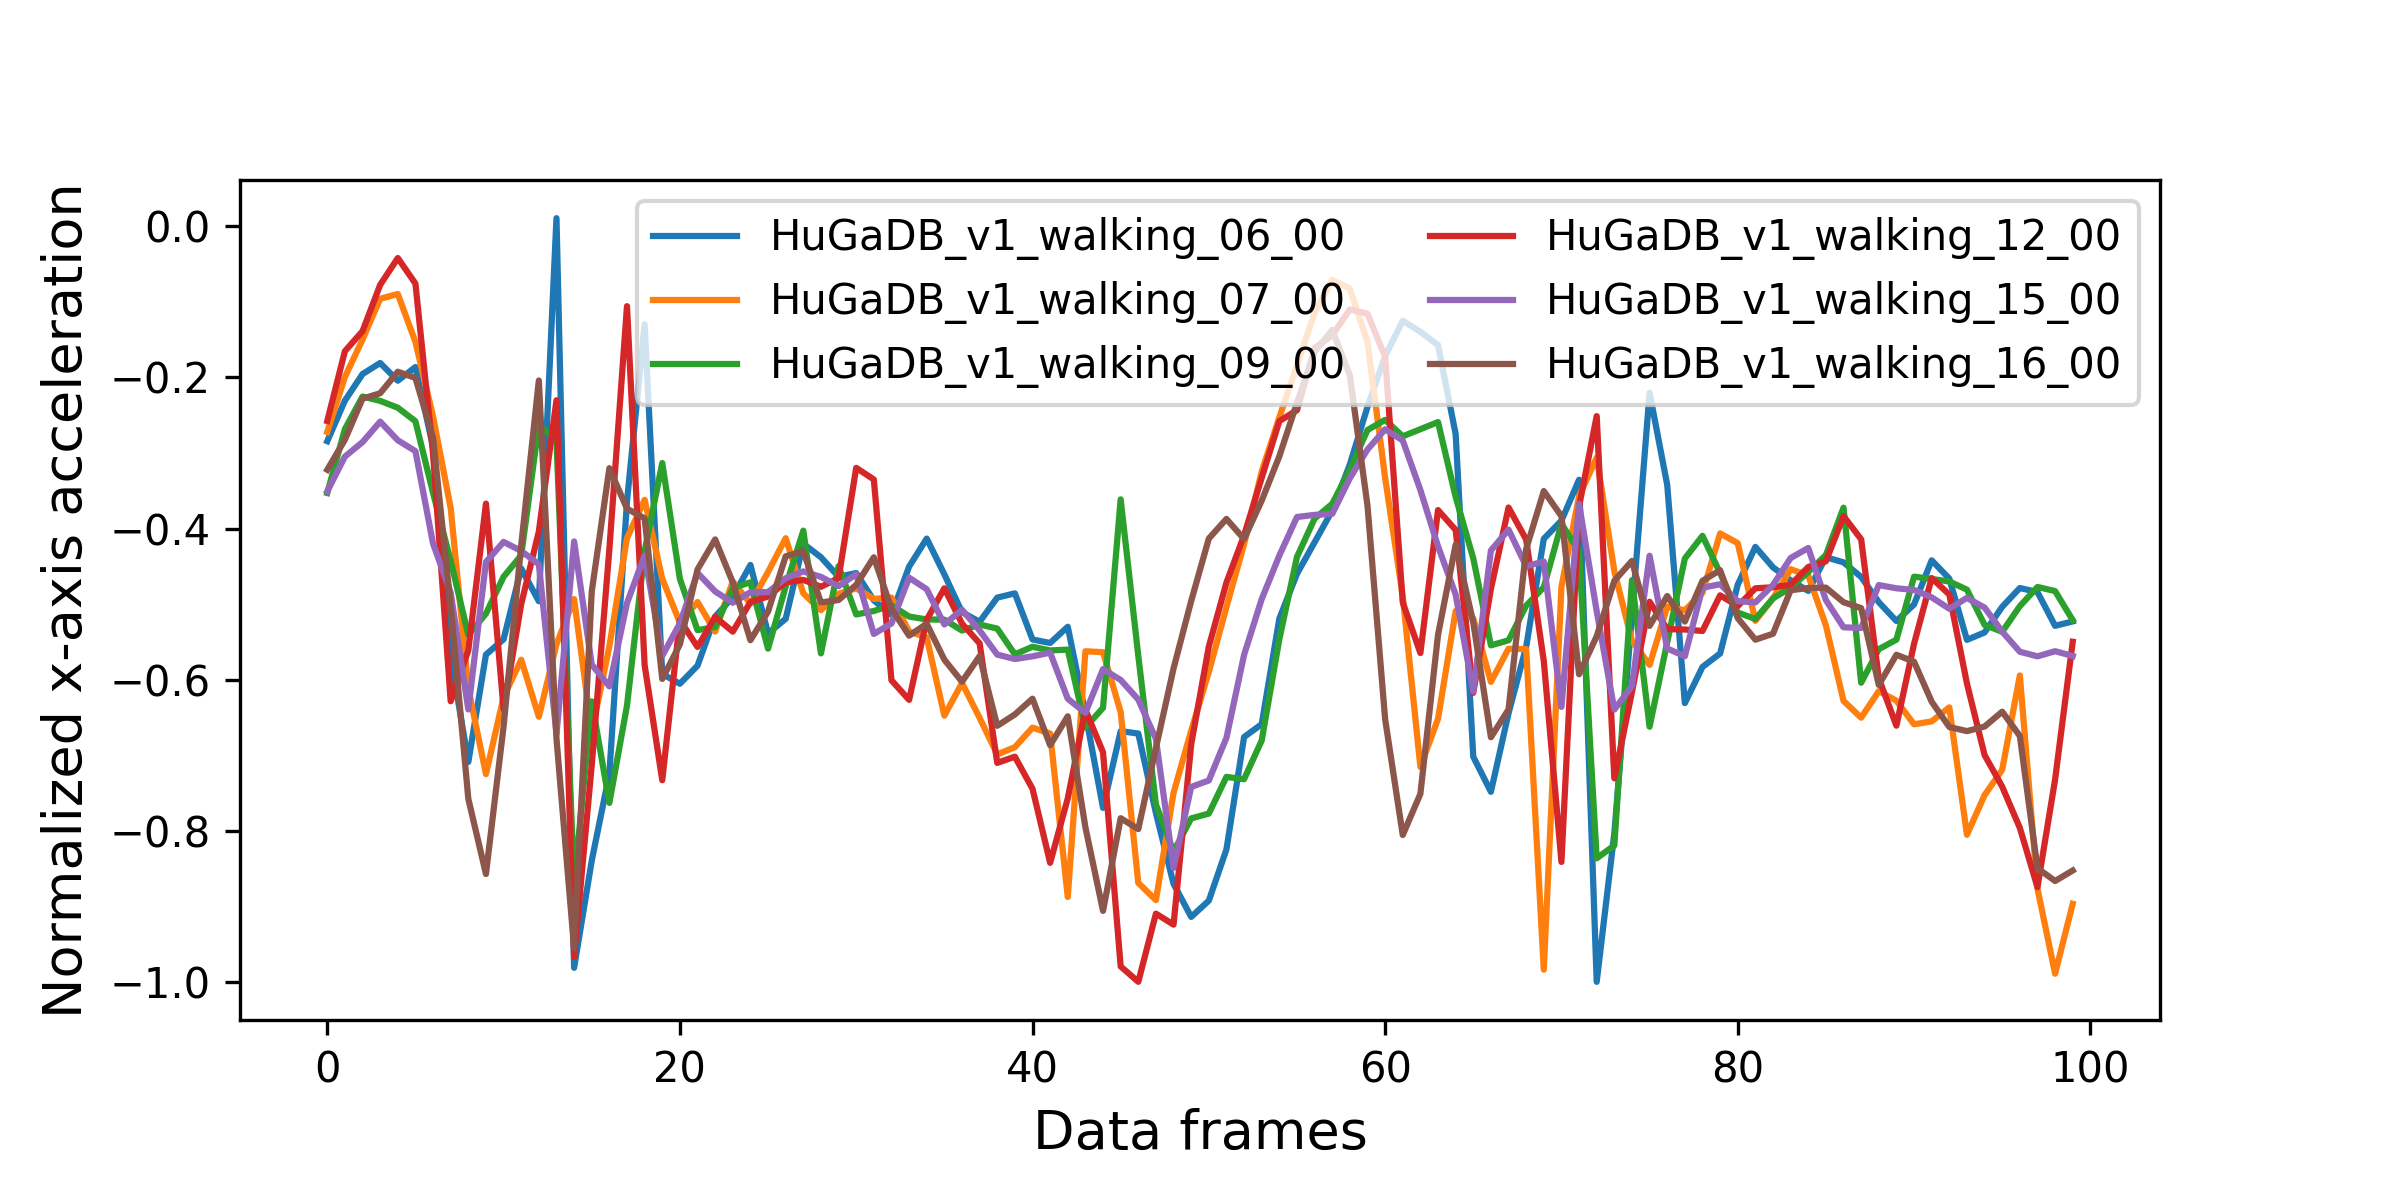
We were interested seeing the variance among the data collected, in particular, the data variance A) within a single user and B) between several users. For this reason, we plotted in Figure 4 the x-axes acceleration data from the thigh recorded during a short two-three-step walk. Panel A shows the data from various recordings performed by the same user. It can be seen that the data variance at a single frame is quite low suggesting that people perform activities very similar way. On the other hand, panel B shows data obtained from six different, randomly chosen users. Here, a much higher variance can be seen in the same frames compared to the previous case. The increased variance may arise from several facts including: difference in gait, difference in leg shape, sensors mounted in slightly different positions, etc. We obtained similar conclusions on data obtained from different sensors during different activities. We note that, even higher variance was observed in the EMG data, which resulted from the difference in the electricity conduction characteristics of the skin, skin thickness, etc.
 |
| (A) Single user |
 |
| (B) Various users |
Taking into account the high data variance between different users, we emphasize the importance of proper evaluation of machine learning methods developed for human activity recognition. Therefore, we propose using the supervised cross-validation approach for constructing training and test sets [26]. In this approach, all the data from a designated user are held out only for tests and the data from the other 17 participants are used for training. Thus, this approach provides a reliable estimation of how an activity recognition system would perform with a new user whose data was not seen before.
Variance can arise from using different brands of sensors. Unfortunately, we did not have the capacity to collect data from different brands of sensors. We hope the measurement noise is small in general and that different sensors can be calibrated to be compatible with each other.
6 Availability
The database is available free of charge at https://github.com/romanchereshnev/HuGaDB (455 Mb).
7 Summary
The HuGaDB dataset contains detailed kinematic data for analyzing human gait and activity recognition. This dataset differs from previously published datasets in the sense that HuGaDB provides human gait data in great detail mainly from inertial sensors and contains segmented annotations for studying the transition between different activities. Data were obtained from 18 participants, and in total, they provide around 10 hours of recording. This dataset can be used in health-care-related studies, such as walking rehabilitation, or in modeling human movements in virtual reality or humanoid robotics. The dataset will be updated with new data from new participants in the future.
References
- [1] Charu C Aggarwal. Managing and mining sensor data. Springer Science & Business Media, 2013.
- [2] Christoph Amma, Marcus Georgi, and Tanja Schultz. Airwriting: A wearable handwriting recognition system. Personal and Ubiquitous Computing, 18(1):191–203, 2014.
- [3] Marcus Georgi, Christoph Amma, and Tanja Schultz. Recognizing hand and finger gestures with IMU based motion and EMG based muscle activity sensing. In Proceedings of the International Conference on Bio-inspired Systems and Signal Processing, pages 99–108, 2015.
- [4] Emmanuel Munguia Tapia, Stephen S Intille, Louis Lopez, and Kent Larson. The design of a portable kit of wireless sensors for naturalistic data collection. In International Conference on Pervasive Computing, pages 117–134. Springer, 2006.
- [5] Stephen S Intille, Kent Larson, JS Beaudin, Jason Nawyn, E Munguia Tapia, and Pallavi Kaushik. A living laboratory for the design and evaluation of ubiquitous computing technologies. In CHI’05 Extended Abstracts on Human Factors in Computing Systems, pages 1941–1944. ACM, 2005.
- [6] Tâm Huynh, Mario Fritz, and Bernt Schiele. Discovery of activity patterns using topic models. In Proceedings of the 10th international conference on Ubiquitous computing, pages 10–19. ACM, 2008.
- [7] Cuong Pham and Patrick Olivier. Slice&dice: Recognizing food preparation activities using embedded accelerometers. In European Conference on Ambient Intelligence, pages 34–43. Springer, 2009.
- [8] Fernando De la Torre, Jessica Hodgins, Adam Bargteil, Xavier Martin, Justin Macey, Alex Collado, and Pep Beltran. Guide to the carnegie mellon university multimodal activity (cmu-mmac) database. Robotics Institute, page 135, 2008.
- [9] Ricardo Chavarriaga, Hesam Sagha, Alberto Calatroni, Sundara Tejaswi Digumarti, Gerhard Tröster, José del R. Millán, and Daniel Roggen. The opportunity challenge: A benchmark database for on-body sensor-based activity recognition. Pattern Recognition Letters, 2013.
- [10] Hesam Sagha, Sundara Tejaswi Digumarti, José del R Millán, Ricardo Chavarriaga, Alberto Calatroni, Daniel Roggen, and Gerhard Tröster. Benchmarking classification techniques using the opportunity human activity dataset. In Systems, Man, and Cybernetics (SMC), 2011 IEEE International Conference on, pages 36–40. IEEE, 2011.
- [11] Allen Y Yang, Philip Kuryloski, and Ruzena Bajcsy. Ward: A wearable action recognition database. 2009.
- [12] Attila Reiss and Didier Stricker. Introducing a new benchmarked dataset for activity monitoring. In 2012 16th International Symposium on Wearable Computers, pages 108–109. IEEE, 2012.
- [13] Attila Reiss and Didier Stricker. Creating and benchmarking a new dataset for physical activity monitoring. In Proceedings of the 5th International Conference on Pervasive Technologies Related to Assistive Environments, page 40. ACM, 2012.
- [14] Nobuo Kawaguchi, Nobuhiro Ogawa, Yohei Iwasaki, Katsuhiko Kaji, Tsutomu Terada, Kazuya Murao, Sozo Inoue, Yoshihiro Kawahara, Yasuyuki Sumi, and Nobuhiko Nishio. Hasc challenge: Gathering large scale human activity corpus for the real-world activity understandings. In Proceedings of the 2nd Augmented Human International Conference, page 27. ACM, 2011.
- [15] Nobuo Kawaguchi, Hodaka Watanabe, Tianhui Yang, Nobuhiro Ogawa, Yohei Iwasaki, Katsuhiko Kaji, Tsutomu Terada, Kazuya Murao, Hisakazu Hada, Sozo Inoue, et al. Hasc2012corpus: Large scale human activity corpus and its application. In Proceedings of the IPSN, volume 12, 2012.
- [16] Nobuo Kawaguchi, Ying Yang, Tianhui Yang, Nobuhiro Ogawa, Yohei Iwasaki, Katsuhiko Kaji, Tsutomu Terada, Kazuya Murao, Sozo Inoue, Yoshihiro Kawahara, et al. Hasc2011corpus: towards the common ground of human activity recognition. In Proceedings of the 13th International Conference on Ubiquitous Computing, pages 571–572. ACM, 2011.
- [17] Mi Zhang and Alexander A Sawchuk. Usc-had: a daily activity dataset for ubiquitous activity recognition using wearable sensors. In Proceedings of the 2012 ACM Conference on Ubiquitous Computing, pages 1036–1043. ACM, 2012.
- [18] Mi Zhang and Alexander A Sawchuk. Human daily activity recognition with sparse representation using wearable sensors. IEEE journal of Biomedical and Health Informatics, 17(3):553–560, 2013.
- [19] Siddhartha Khandelwal and Nicholas Wickström. Evaluation of the performance of accelerometer-based gait event detection algorithms in different real-world scenarios using the marea gait database. Gait & Posture, 51:84–90, 2017.
- [20] Matteo Giuberti and Gianluigi Ferrari. Simple and robust BSN-based activity classification: Winning the first bsn contest. In Proceedings of the 4th International Symposium on Applied Sciences in Biomedical and Communication Technologies, page 34. ACM, 2011.
- [21] Hristijan Gjoreski, Simon Kozina, Matjaz Gams, Mitja Lustrek, Juan Antonio Álvarez-García, Jin-Hyuk Hong, Anind K Dey, Maurizio Bocca, and Neal Patwari. Competitive live evaluations of activity-recognition systems. IEEE Pervasive Computing, 14(1):70–77, 2015.
- [22] Anita Sant’Anna, Arash Salarian, and Nicholas Wickstrom. A new measure of movement symmetry in early Parkinson’s disease patients using symbolic processing of inertial sensor data. IEEE Transactions on Biomedical Engineering, 58(7):2127–2135, 2011.
- [23] Anita Sant’Anna. A symbolic approach to human motion analysis using inertial sensors: Framework and gait analysis study. PhD thesis, Halmstad University, 2012.
- [24] Marc Bachlin, Daniel Roggen, Gerhard Troster, Meir Plotnik, Noit Inbar, Inbal Meidan, Talia Herman, Marina Brozgol, Eliya Shaviv, Nir Giladi, et al. Potentials of enhanced context awareness in wearable assistants for Parkinson’s disease patients with the freezing of gait syndrome. In 2009 International Symposium on Wearable Computers, pages 123–130. IEEE, 2009.
- [25] Gabriele Bovi, Marco Rabuffetti, Paolo Mazzoleni, and Maurizio Ferrarin. A multiple-task gait analysis approach: kinematic, kinetic and emg reference data for healthy young and adult subjects. Gait & Posture, 33(1):6–13, 2011.
- [26] Attila Kertész-Farkas, Somdutta Dhir, Paolo Sonego, Mircea Pacurar, Sergiu Netoteia, Harm Nijveen, Arnold Kuzniar, Jack AM Leunissen, András Kocsor, and Sándor Pongor. Benchmarking protein classification algorithms via supervised cross-validation. Journal of biochemical and biophysical methods, 70(6):1215–1223, 2008.