Who Will Share My Image? Predicting the Content Diffusion Path in Online Social Networks
Abstract.
Content popularity prediction has been extensively studied due to its importance and interest for both users and hosts of social media sites like Facebook, Instagram, Twitter, and Pinterest. However, existing work mainly focuses on modeling popularity using a single metric such as the total number of likes or shares. In this work, we propose Diffusion-LSTM, a memory-based deep recurrent network that learns to recursively predict the entire diffusion path of an image through a social network. By combining user social features and image features, and encoding the diffusion path taken thus far with an explicit memory cell, our model predicts the diffusion path of an image more accurately compared to alternate baselines that either encode only image or social features, or lack memory. By mapping individual users to user prototypes, our model can generalize to new users not seen during training. Finally, we demonstrate our model’s capability of generating diffusion trees, and show that the generated trees closely resemble ground-truth trees.
1. Introduction
Online social networks (OSNs) have seen phenomenal growth: over a billion users on Facebook, and hundreds of millions on Google+, Twitter, and Pinterest. This new ecosystem of content generation and sharing enables rich data to be collected and analyzed to study individual and group behavior, as well as to study how information is diffused over social graphs. In particular, viral diffusion (also known as “word-of-mouth” diffusion) (Yang and Zha, 2013; Kimura and Saito, 2006; Bakshy et al., 2012) has been shown to be an important mechanism for advertising a new idea, technology, content, or product. Unlike the mass broadcast counterpart in which a single user directly spreads information to most recipients, in viral diffusion many individuals participate in spreading information in a chain-like structure.
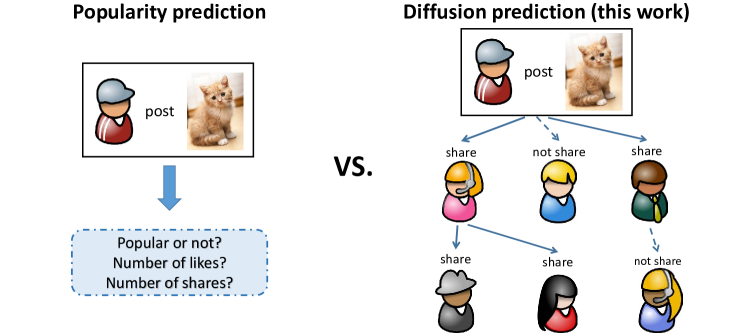
In this paper, we are interested in modeling how image content gets propagated through a social network. We focus on images because it has become one of the most important containers for sharing thoughts, interests, and feelings in OSNs (e.g., Pinterest, Instagram, Tumblr, Imgur). Unlike existing work (Huberman et al., 2008; Agarwal et al., 2010; Li et al., 2013; Khosla et al., 2014; Gelli et al., 2015; Deza and Parikh, 2015; Borges et al., 2016), which largely focus on a single absolute metric such as the total number of users who liked/shared a content (see Figure 1 left), we are instead interested in modeling the entire structure of the content propagation path (see Figure 1 right). To this end, we propose Diffusion-LSTM, a novel memory-based deep network that recursively predicts each step of the image content diffusion path, using both the history of social context features of all previous users in the diffusion path as well as the image content features.
Apart from an image’s content, the history of users in the diffusion path plays a key role in deciding whether the image will be further propagated, and if so, to whom next. For example, if we only know that the image was shared by a user who likes soccer, then the likelihood that the image will be shared by a soccer fan will be high. However, if we also know that the image was initially shared by a tennis fan before being shared by the soccer fan, then there is a high-likelihood that the next user will like either soccer, tennis, or sports in general. Similarly, if an image is initially shared by an influential user with lots of followers, then its likelihood to be propagated will remain high even after being shared by a user with only a few followers. Hence, we design our Diffusion-LSTM to capture the history of the social characteristics of all of the previous users who have shared the image in order to predict its future propagation path. Furthermore, in order to generalize our prediction model to new unseen users, we create prototype users by grouping individual users according to their social features.
To the best of our knowledge, our work is the first attempt to generate the complete diffusion path of an image through an online social network. Our results show superior diffusion path prediction performance compared to alternative baselines that lack history information or rely only on either image or social information. Finally, while we use Pinterest data to evaluate our model, we design it to be general and applicable to other image-driven social media as well.
2. Related Work
A large number of recent efforts have explored ways to predict content popularity, including for images (Khosla et al., 2014; Totti et al., 2014; Cheng et al., 2014; Gelli et al., 2015; Deza and Parikh, 2015; Guerini et al., 2013), videos (Li et al., 2013), GitHub repositories (Borges et al., 2016), blogs (Agarwal et al., 2010), memes (Weng et al., 2013), and tweets (Huberman et al., 2008; Hong et al., 2011; Kupavskii et al., 2013; Ma et al., 2013), by combing content features with user social features. In contrast to these prior work, which mainly focus on predicting a popularity score (e.g., number of shares) of the content, we aim to predict the entire content diffusion path through the social network, which is a much more challenging task. Predicting not only how many users will share a content but also the characteristics of each sharer in the diffusion sequence would enable deeper understanding of the diffusion process; e.g., one could identify the critical users in the diffusion path (Kimura and Saito, 2006; Bakshy et al., 2012) which would be useful e.g., for targeted advertisements.
Link prediction algorithms, which predict future edges between the nodes by using the current state of the graph (Liben-Nowell and Kleinberg, 2007; Wang et al., 2011; Scellato et al., 2011; Backstrom and Leskovec, 2011; Grover and Leskovec, 2016) are also related. Our approach is different in that it recursively predicts the entire diffusion path of a content (an image) using both the content and users’ social characteristics rather than predicting future edges for an existing graph.
Our Diffusion-LSTM architecture for social network tree prediction is related to Tree-LSTMs (Tai et al., 2015; Zhu et al., 2015; Zhang et al., 2016) in natural language processing (NLP). Unlike standard linear chain LSTMs, a Tree-LSTM takes the hidden vectors from multiple children to predict the next hidden state, and has shown superior performance for various NLP tasks like sentiment prediction and sentence semantic relatedness. However, due to their bottom-up structure (Tai et al., 2015; Zhu et al., 2015), they are not well suited for predicting/generating the content diffusion path in a social network, since the content diffusion path prediction has to start from the root user. Recent work by (Zhang et al., 2016) predicts the tree structure in a top-down manner, but it uses techniques that are specific for language dependency tree prediction, and thus cannot be directly used for social network tree prediction. In contrast to these works, our Diffusion-LSTM generates the content diffusion path in a top-down manner for social network tree prediction. To the best of our knowledge, our work is the first attempt to generate the complete diffusion path of an image through a social network.
Finally, our work is also related to image captioning in computer vision. In image captioning (e.g., (Karpathy and Fei-Fei, 2015; Chen and Zitnicki, 2015; Donahue et al., 2015; Vinyals et al., 2015; Johnson et al., 2016)), an LSTM takes the image semantic feature (Simonyan and Zisserman, 2015; Krizhevsky et al., 2012) along with the history of previous words to recursively predict the next word. In contrast, in our method (Diffusion-LSTM), an LSTM takes the image semantic feature along with the history of previous users’ social context features to recursively predict the image propagation path taken through the social network.
3. Approach
Our goal is to predict the path of diffusion of an image in an online social network. We first describe how we map individual users to a set of prototype users so that our proposed model can generalize to unseen users. We then describe our deep recurrent Diffusion-LSTM network architecture for modeling and predicting image diffusion.
3.1. Mapping individual users to prototypes
A diffusion path of an image encodes the sequence of users who shared it. The set of all possible diffusion paths depends on both the users in the social network as well as the network structure (i.e., connectivity between users). Since we want our model to be able to generalize to unseen users and unseen connections (i.e., be able to train and test with a different set of users in the social network), we map individual users to a fixed set of canonical prototype users who capture the general, shared characteristics of the individual users that are mapped to them (like in which categories they post, how popular they are). In this way, we can maintain the same prototypical users during training and testing, while ignoring subtle differences between the true users. Furthermore, when there is insufficient training data for each user, combining similar individual users into a single prototype user can enlarge the training data to produce a better prediction model.
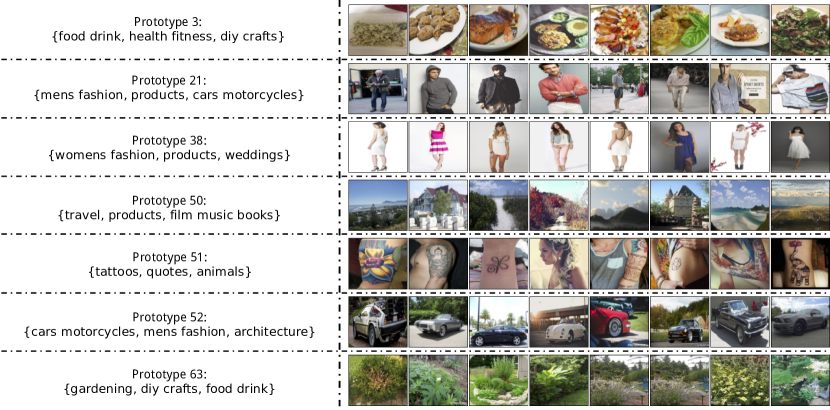
Specifically, we use -means to cluster the social features (described in more detail below) of the users into prototype groups.111We set the number of prototypes to 100 to cover a broad range of users. Empirically, we find that our algorithm is robust to a wide range of values. The social feature of a prototype group is the average social feature of all of its cluster members. An unseen user is mapped to the prototype (i.e., cluster center) whose social feature is most similar based on their euclidean distance. Figure 2 shows examples of prototype users. The left panel shows the top three Pinterest categories that the prototype user most frequently posts images to, while the right panel shows representative images posted by individual users who are mapped to that prototype. For example, prototype user 38 likes to share images of women’s fashion, while prototype user 52 likes to share images of cars.
3.2. Network architecture
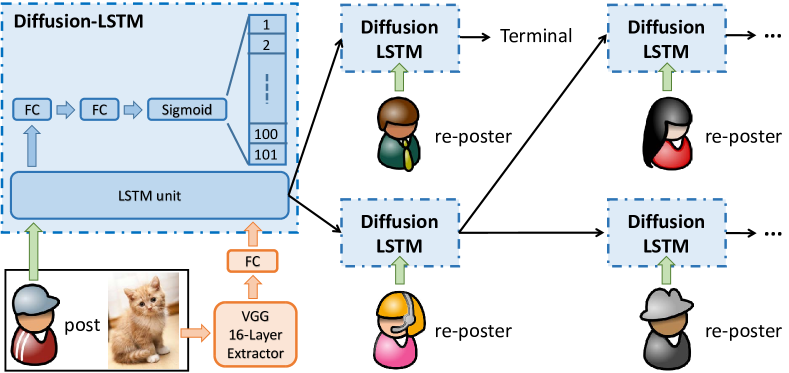
The proposed architecture for modeling image diffusion through a social network is shown in Figure 3. The input to our model is an image posted by a user and the user’s social information , and the output is the entire diffusion tree (sequence of re-posters) of the image. Specifically, the initial diffusion path is conditioned on the input image and the social features of the root user. Then, in each ensuing timestep, our model takes the history of the previous posters’ social features and the current poster’s social features, and outputs the next re-poster (among the current poster’s friends in the social network). The model stores and updates a memory that records the characteristics of the users in the diffusion path so far. The process ends when the next predicted user is “terminal”.
We next describe the image and social features, our Diffusion-LSTM model, and the loss function used to optimize the model.
3.3. Image and social features
The propagation path of an image in a social network should be a function of the image content as well as the users’ social features. For example, an interesting image is more likely to become viral if it is initially spread by a user who has many friends and followers.
For image features, we take the VGG 16 network (Simonyan and Zisserman, 2015) pretrained on ImageNet classification, and compute the FC7 activation feature (4096-D) for each image. This feature encodes high-level semantics in the image (e.g., its objects/parts/attributes).
For social features, for each user, we compute the total number of followers of that user, the total number of users that the user follows, the total number of pins (shares) of all images shared by that user, and the total number of likes of all images shared by that user. We also compute the probability distribution of the 38 Pinterest categories of all images posted by the user. This captures the types of images that the user likes to share. The 4-D aggregate counts and the 38-D category distribution are concatenated to create a single 42-D social feature.222While additional social factors such as gender, geographic location, age could also be used to enrich the feature, these factors are unfortunately missing for many of the users in the Pinterest dataset collected in (Han et al., 2015).
3.4. Diffusion-LSTM
At any step along the diffusion path, whether an image will be further propagated will depend not only on the social influence of the current poster, but also on that of the previous posters (i.e., the history of the diffusion path taken thus far). This is an intrinsically recursive problem, and is well-suited to be modeled using Recurrent Neural Networks, which are ideal for analyzing sequences.
Since we want to model long-range dependencies across many diffusion steps, we use an LTSM network (Hochreiter and Schmidhuber, 1997; Gers et al., 2000, 2002), which is more robust to the vanishing gradient problem than vanilla RNNs (Hochreiter, 1998; Bengio et al., 1994). LTSMs have been successfully used for the related problem of image captioning (e.g., (Vinyals et al., 2015)), where image features are combined with text features to recursively predict the next word in the image caption. In our case, the image features are combined with the current user’s social features to recursively predict the next users who will share the image (recall Figure 1 right).
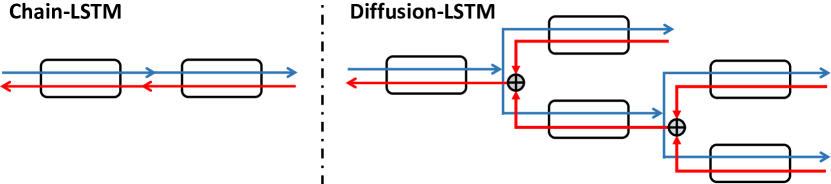
Our Diffusion-LSTM network for modeling image diffusion works exactly like a regular chain-structured LSTM network, with the only difference being the flow path of the memory cell and the hidden state following a tree. In a regular LSTM, the previous memory cell and hidden state from time step are passed to a single next node in time step . However, in our Diffusion-LSTM network, the previous memory cell and hidden state of a parent node from time step can be passed to multiple child nodes in time step , as shown in Figure 4. This means that during backpropagation, the gradient for a parent node will sum the gradients passed by all of its child nodes.
Formally, using the subscripts and for “child” and “parent” respectively, the Diffusion-LSTM parent-child transition equations are expressed as follows:
| (1) |
where is the input social feature of the user at the current step, , and are the weight matrices and bias vectors to be optimized, and denotes elementwise multiplication. denotes the forget gate vector (for remembering old information), denotes the input gate vector (for acquiring new information), denotes an output gate vector (as an output candidate), denotes the memory cell, and denotes the hidden state.
Our Diffusion-LSTM model consists of the regular LSTM unit followed by two FC layers and one sigmoid layer afterwards to predict one of the prototypical users or the “terminal” class. To reduce overfitting and increase the nonlinearity of the model, we add one dropout layer after the LSTM unit, and one ReLU layer and one dropout layer between two FC layers.
We project the image features into the initial root parent memory through an FC layer. This conditions the initial history of the propagation path with the contents of the image. Alternatively, one could concatenate a user’s social features with the image features, but this produces inferior results. The initial hidden state is simply set to all zero.
3.5. Loss function for modeling image diffusion
The diffusion path of an image can be broken-down into a sequence of classification problems, where the predicted classes for a given timestep indicate the users who will reshare the image in the ensuing timestep (i.e., next depth level of the social network tree). Furthermore, since the number of users who reshare the image can range anywhere from no user (zero) to different users, we model the diffusion prediction for a given timestep and tree node as a collection of binary classification problems (where the ’th class denotes the terminal class). Thus, we use the weighted multi-class binary cross entropy loss to optimize our model:
| (2) |
where indexes the classes (prototype users and terminal class), indexes the training instances (i.e., all nodes in all training trees), is the predicted probability of instance being in class , and is the ground-truth binary indicator indicating whether instance is in class .
Since the number of positive vs. negative instances in a class can be highly imbalanced, we use the weights and to balance their influence: , and () is the number of negative (positive) ground-truth instances for class . Without these balancing weights, the loss function can be dominated by the dominant (positive or negative) instances.
4. Experiments
In this section, we evaluate the accuracy of our model’s image diffusion path prediction, and compare to several baselines that either use only image or social features, or lack memory. We also show qualitative examples of our model’s generated diffusion trees.
4.1. Pinterest dataset
To analyze image content diffusion, we use the anonymized Pinterest data of (Han et al., 2015), which was collected for 44 days in 2013. The dataset consists of image propagation data (pintree id, sender id, receiver id), user data (user id, number of pins (shares), number of followers, number of followings, number of likes, gender, locale, country), and image data (pintree id, Pinterest category, source, number of likes, and time stamp). For each image, its entire propagation path is available. Overall, the dataset contains more than 340K diffusion paths (Pinterest trees or “pintrees”) shared by 1M users, which is randomly divided into training, validation, and test sets with size ratio . The mean pintree size is with standard deviation , the mean pintree width is with standard deviation , and the mean pintree depth is with standard deviation .
| Model | Social | Image | Memory | AP101 | mAP1-100 | mAP |
|---|---|---|---|---|---|---|
| Random Weights | Yes | Yes | Yes | 0.803 | 0.005 | 0.013 |
| FC | Yes | Yes | No | 0.899 | 0.126 | 0.133 |
| Diffusion-LSTM | No | Yes | Yes | 0.883 | 0.087 | 0.095 |
| Diffusion-LSTM | Yes | No | Yes | 0.932 | 0.206 | 0.213 |
| Diffusion-LSTM | Yes | Yes | Yes | 0.932 | 0.214 | 0.221 |
For social features, we use number of pins, number of followers, number of followings, and number of likes, because all other user data have more than data missing, while those four social features have less than data missing (which we simply fill with their mean values). As explained in Sec. 3, we expand the user social features with the Pinterest category distributions, which can be summarized from all images shared by a user.
4.2. Implementation details
We train our Diffusion-LSTM model with an initial learning rate of , and then lower the learning rate to when validation loss stops decreasing. We train both our model and all baselines until full convergence (30-60 epochs depending on the model). We optimize the weights of the model using backpropagation through time. We normalize each social feature to the range by first applying the log function and then dividing by the maximum value. We divide each Pinterest category distribution feature by to make it have roughly the same standard deviation as each non-category social features. For the VGG-16 image features, we subtract each dimension by its mean and divide by its standard deviation.
4.3. Baselines
We compare our Diffusion-LSTM model with several baselines:
Diffusion-LSTM with random weights: The same architecture as our Diffusion-LSTM model but with random weights. The initial memory is projected from image features at the beginning. This is a sanity check baseline to measure chance performance.
FC model with image and social features: This baseline consists of three fully connected (FC) layers. One ReLU layer and one dropout layer follow each of the first two FC layers. The last FC layer is followed by a sigmoid layer to convert the output values into probabilities. This baseline is chosen to study the importance of memory for content diffusion path prediction.
Diffusion-LSTM with only social features: The same architecture as our Diffusion-LSTM model but with only social features. No image features are used for this baseline, so initial memory is simply set to all zero. This baseline measures the role of social features for content diffusion path prediction.
Diffusion-LSTM with only image features: The same architecture as our Diffusion-LSTM model but with only image features. The initial memory is also set to all zero for this baseline. Since social features are not used, we instead use the (same) image features as input in each time step. This baseline measures the role of image features for content diffusion path prediction.
4.4. Per-node diffusion prediction accuracy
We first evaluate image diffusion prediction by comparing our predicted users with the ground-truth users for each node in a tree. We evaluate per-category average precision (AP), by varying the threshold in the prediction confidences. Following the standard practice in evaluating RNNs (Mikolov et al., 2010), we do not generate the tree (we will do this in the next section), but instead use the ground-truth path up to timestep for a tree node and evaluate whether the predicted users in timestep match the ground-truth (and do this for all and all nodes).
Table 1 shows the per-node prediction results. AP101 is the AP for the terminal class, while mAP1-100 is the mean AP for all prototype user classes. mAP is the mean AP computed over all classes. First, we can see that all baselines outperform the random weights baseline, which produces a very low mAP showing the difficulty of the task. The reason why the AP101 for random weights is so high is because there are many leaf nodes (terminal class) in the database. Specifically, the terminal class has a ratio of non-leaf vs. leaf (total of non-leaf and leaf). On the other hand, for the - prototype user classes, the negative vs. positive instance ratio is around (an average total of negatives and positives). The large difference in target ratios make the prediction task for the prototype classes much more difficult than the terminal class.
Second, we see that social features alone produce better prediction results than image features alone. This corroborates many previous findings (e.g., (Deza and Parikh, 2015; Khosla et al., 2014; Totti et al., 2014)), which showed that social features are more important than image features for content popularity prediction. In our case, we are predicting the diffusion path, which is a much more difficult problem, and when no social features are used, it is impossible to say precisely how an image will be propagated through a social network. Third, our Diffusion-LSTM model performs much better than the FC model, indicating the crucial role of storing the image posting history in memory for predicting the next re-posting users.
| Model | Social | Image | Memory | Depth MAE | HI |
|---|---|---|---|---|---|
| Chance Performance | Yes | Yes | Yes | 2.44 | 0.007 |
| FC | Yes | Yes | No | 2.46 | 0.278 |
| Diffusion-LSTM | Yes | No | Yes | 1.98 | 0.701 |
| Diffusion-LSTM | Yes | Yes | Yes | 1.85 | 0.708 |
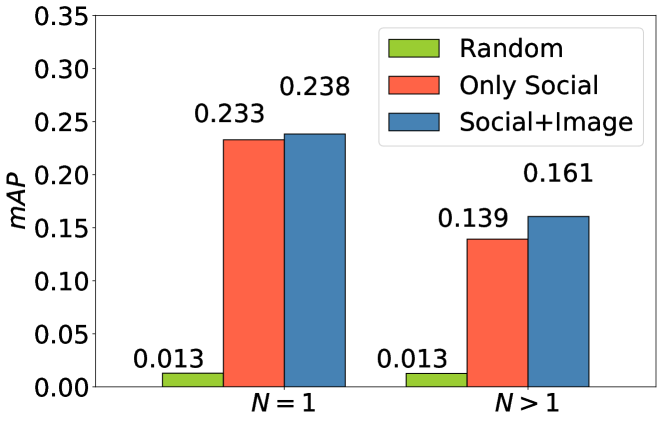
Finally, combining social features and image features produces the best results, improving overall mAP by over the baseline Diffusion-LSTM model using only social features. The main reason why the improvement is only is because most () users only post images in one Pinterest category instead of multiple categories. This means that those users are likely to always share similar images (e.g., of cats) to similar prototypical users (e.g., cat lovers). (Recall that we also use the probability distribution of the 38 Pinterest categories of all images posted by the user as part of the social features.) On the other hand, for users who post images of multiple Pinterest categories (e.g., cats, cars, travel, food), the image content will influence who among his/her followers will repost the image. To study this in more detail, we further break down prediction accuracy based on whether a user posts only to a single category versus multiple categories. Indeed, Figure 5 shows that image features yield only a slight improvement over social features for users who post only to a single category (), but significantly improve prediction performance for users who post to multiple categories ().
4.5. Tree generation accuracy
We next use our trained Diffusion-LSTM model to generate pintrees directly. We compare the generated tree with the ground-truth tree, given the same starting user and posted image. We compare the depth of the trees (which evaluates how well our model predicts the terminal class) and the user’s preferred Pinterest category distributions averaged across all non-root nodes (users) in the tree (which measures how well our model predicts the prototype users). We do not consider the root node since it is already given during generation. We compute the mean absolute error (MAE) for depth, and histogram intersection for the Pinterest category distribution: , where , are two normalized Pinterest category distributions (-D histograms).
To generate a tree, given the features for a user and associated image, we recursively make class (100 prototype users or terminal class) predictions. If a node is predicted as “terminal”, we stop; otherwise, we continue generating the tree. When generating a tree, we set the terminal class prediction threshold to be , while the prototype class prediction thresholds are chosen based on validation data using depth MAE. Due to the unequal number of ground-truth pintrees per depth, we evaluate the MAE for each tree depth separately and then average across depths. We truncate any pintree if its depth or size or width to avoid degenerate trees that never stop growing (otherwise, they induce infinite error in our evaluation). 99.9% of the pintrees in the training set fall under these criteria.
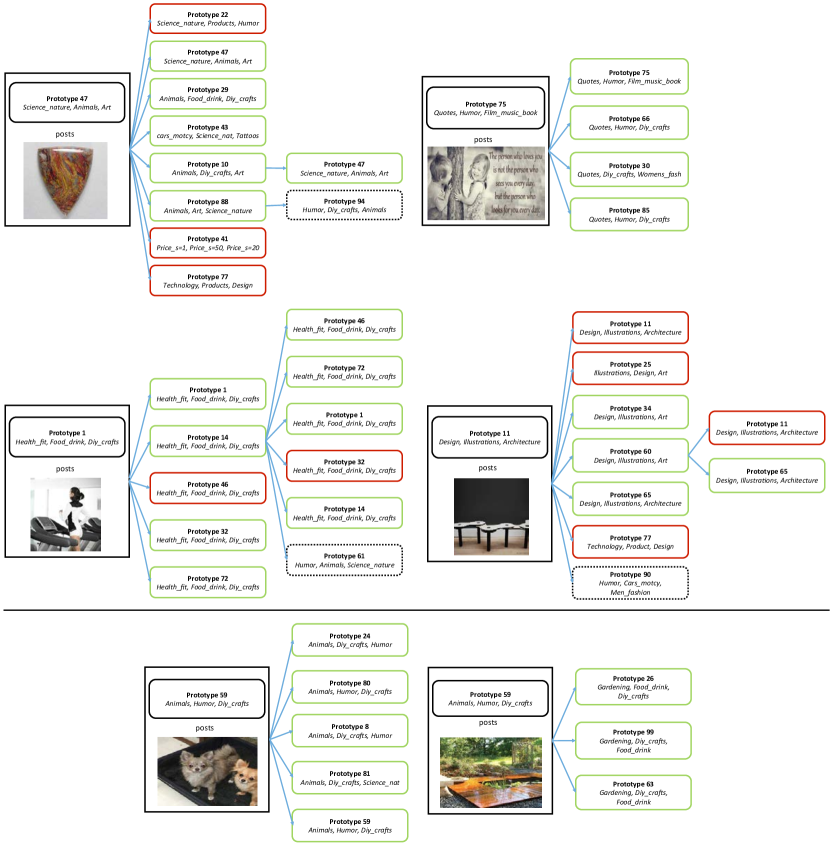
Table 2 shows the results. Our generated trees are more similar to the ground-truth trees than the FC baseline, which again shows the importance of memory, and the Diffusion-LSTM baseline that lacks image features (the one that lacks social features does much worse, similar to per-node prediction). All methods outperform chance performance (sampling trees according to the training data distribution), which shows that learning is important for diffusion prediction. Figure 6 (top) shows visualizations of pintrees generated by our Diffusion-LSTM model. Our predicted pintrees are quite similar to the ground-truth pintrees. Even for the mispredicted users (red boxes), their Pinterest categories are very close to the ground-truth users’ categories. Interestingly, for our top-left generated pintree, our model predicts that a user from prototype 47 will share the image from a user from prototype 10 who initially shared the image from another user from prototype 47. This shows the importance of memory as our model can remember that the image was initially shared by a user from prototype 47 and uses this to make the correct prediction.
Finally, in Figure 6 (bottom), we show how the generated pintrees change when the same prototype user posts different types of images. When a user who posts frequently to the animal category posts a gardening image (Figure 6 (bottom) right), it is shared by users who post frequently to the gardening category (indicating image plays a role). Social features still play a role, as can be seen by the common Pinterest categories between the original user and re-sharers (Diy_crafts is in common in both Figure 6 (bottom) left and right). This indicates image propagation is dependent on both image content and user social features.
5. Conclusion
We presented a deep recurrent network for generating the diffusion path of an image through a social network. By keeping track of the posting history of an image, our Diffusion-LSTM outperforms alternative baselines that lack memory or use only image or social features. We further demonstrated our model’s capability of generating meaningful pintrees.
Although we mainly focused on Pinterest data, the proposed model is general and can be applied to different social network datasets. To further boost prediction performance, we could fine-tune the VGG 16 network, since the ImageNet dataset and Pinterest dataset may possess different characteristics (Pinterest images are more likely to be “artsy”). Finally, with sufficient training data for each user, it may also be possible to train the Diffusion-LSTM to directly predict the specific friends who will share the image, rather than predicting prototype users.
Acknowledgements
This work was supported in part by GPUs donated by NVIDIA and the research fund of Hanyang University (HY-2017-N).
References
- (1)
- Agarwal et al. (2010) N. Agarwal, M. Galan, H. Liu, and S. Subramanya. 2010. WisColl: Collective Wisdom Based Blog Clustering. In Information Sciences.
- Backstrom and Leskovec (2011) L. Backstrom and J. Leskovec. 2011. Supervised Random Walks: Predicting and Recommending Links in Social Networks. In WSDM.
- Bakshy et al. (2012) E. Bakshy, I. Rosenn, C. Marlow, and L. Adamic. 2012. The Role of Social Networks in Information Diffusion. In WWW.
- Bengio et al. (1994) Y. Bengio, P. Simard, and P. Frasconi. 1994. Learning Long-term Dependencies with Gradient Descent is Difficult. In IEEE Transactions on Neural Networks.
- Borges et al. (2016) H. Borges, A. Hora, and M. T. Valente. 2016. Predicting the Popularity of Github Repositories. In PROMISE.
- Chen and Zitnicki (2015) X. Chen and C. Lawrence Zitnicki. 2015. Mind’s Eye: A Recurrent Visual Representation for Image Caption Generation. In CVPR.
- Cheng et al. (2014) J. Cheng, L. Adamic, P. Dow, J. Kleinberg, and J. Leskovec. 2014. Can cascades be predicted?. In WWW.
- Deza and Parikh (2015) A. Deza and D. Parikh. 2015. Understanding Image Virality. In CVPR.
- Donahue et al. (2015) J. Donahue, L. Anne Hendricks, S. Guadarrama, M. Rohrbach, S. Venugopalan, K. Saenko, and T. Darrell. 2015. Long-term Recurrent Convolutional Networks for Visual Recognition and Description. In CVPR.
- Gelli et al. (2015) F. Gelli, T. Uricchio, M. Bertini, A. Del Bimbo, and S. F. Chang. 2015. Image Popularity Prediction in Social Media Using Sentiment and Context Features. In ACM Multimedia.
- Gers et al. (2000) F. A. Gers, J. Schmidhuber, and F. Cummins. 2000. Learning to Forget: Continual Prediction with LSTM. In Neural Computation.
- Gers et al. (2002) F. A. Gers, N. N. Schraudolph, and J. Schmidhuber. 2002. Learning Precise Timing with LSTM Recurrent Networks. In JMLR.
- Grover and Leskovec (2016) A. Grover and J. Leskovec. 2016. Node2vec: Scalable Feature Learning for Networks. In KDD.
- Guerini et al. (2013) M. Guerini, J. Staiano, and D. Albanese. 2013. Exploring image virality in google plus. In SocialCom.
- Han et al. (2015) J. Han, D. Choi, A. Choi, J. Choi, T. Chung, T. T. Kwon, J. Y. Rha, and C. H. Chuah. 2015. Sharing Topics in Pinterest: Understanding Content Creation and Diffusion Behaviors. In COSN.
- Hochreiter (1998) S. Hochreiter. 1998. The Vanishing Gradient Problem During Learning Recurrent Neural Nets and Problem Solutions. In IJUFKS.
- Hochreiter and Schmidhuber (1997) S. Hochreiter and J. Schmidhuber. 1997. Long short-term memory. In Neural Computation.
- Hong et al. (2011) L. Hong, O. Dan, and B. D. Davison. 2011. Predicting Popular Messages in Twitter. In WWW.
- Huberman et al. (2008) B. A. Huberman, D. M. Romero, and F. Wu. 2008. Social Networks that Matter: Twitter Under the Microscope. In arXiv:0812.1045v1.
- Johnson et al. (2016) J. Johnson, A. Karpathy, and L. Fei-Fei. 2016. Densecap: Fully convolutional localization networks for dense captioning. In CVPR.
- Karpathy and Fei-Fei (2015) A. Karpathy and L. Fei-Fei. 2015. Deep Visual-semantic Alignments for Generating Image Descriptions. In CVPR.
- Khosla et al. (2014) A. Khosla, A. Das Sarma, and R. Hamid. 2014. What Makes an Image Popular?. In WWW.
- Kimura and Saito (2006) M. Kimura and K. Saito. 2006. Tractable Models for Information Diffusion in Social Networks. In European Conference on Principles of Data Mining and Knowledge Discovery.
- Krizhevsky et al. (2012) A. Krizhevsky, I. Sutskever, and G. Hinton. 2012. Imagenet Classification with Deep Convolutional Neural Networks. In NIPS.
- Kupavskii et al. (2013) A. Kupavskii, A. Umnov, G. Gusev, and P. Serdyukov. 2013. Predicting the Audience Size of a Tweet. In AAAI.
- Li et al. (2013) H. Li, X. Ma, F. Wang, J. Liu, and K. Xu. 2013. On Popularity Prediction of Videos Shared in Online Social Networks. In CIKM.
- Liben-Nowell and Kleinberg (2007) D. Liben-Nowell and J. Kleinberg. 2007. The link-prediction problem for social networks. In JASIST.
- Ma et al. (2013) Z. Ma, A. Sun, and G. Cong. 2013. On Predicting the Popularity of Newly Emerging Hashtags in Twitter. In JASIST.
- Mikolov et al. (2010) T. Mikolov, M. Karafiát, L. Burget, J. Cernocký, and S. Khudanpur. 2010. Recurrent neural network based language model. In INTERSPEECH.
- Scellato et al. (2011) S. Scellato, A. Noulas, and C. Mascolo. 2011. Exploiting place features in link prediction on location-based social networks. In KDD.
- Simonyan and Zisserman (2015) K. Simonyan and A. Zisserman. 2015. Very Deep Convolutional Networks for Large-scale Image Recognition. In ICLR.
- Tai et al. (2015) K. S. Tai, R. Socher, and C. D. Manning. 2015. Improved Semantic Representations from Tree-structured Long Short-term Memory Networks. In ACL.
- Totti et al. (2014) L. Totti, F. Costa, S. Avila, E. Valle, W. Meira Jr, and V. Almeida. 2014. The Impact of Visual Attributes on Online Image Diffusion. In WebSci.
- Vinyals et al. (2015) O. Vinyals, A. Toshev, S. Bengio, and D. Erhan. 2015. Show and Tell: A Neural Image Caption Generator. In CVPR.
- Wang et al. (2011) D. Wang, D. Pedreschi, C. Song, F. Giannotti, and A. L. Barabasi. 2011. Human Mobility, Social Ties, and Link Prediction. In KDD.
- Weng et al. (2013) L. Weng, F. Menczer, and Y. Y. Ahn. 2013. Virality Prediction and Community Structure in Social Networks. In Scientific Reports.
- Yang and Zha (2013) S. H. Yang and H. Zha. 2013. Mixture of Mutually Exciting Processes for Viral Diffusion. In ICML.
- Zhang et al. (2016) X. Zhang, L. Lu, and M. Lapata. 2016. Top-down Tree Long Short-term Memory Networks. In NAACL.
- Zhu et al. (2015) X. Zhu, P. Sobihani, and H. Guo. 2015. Long Short-term Memory Over Recursive Structures. In ICML.