Chemical Complexity in the Eu–enhanced Monometallic Globular Cluster NGC 5986111This paper includes data gathered with the 6.5m Magellan Telescopes located as Las Campanas Observatory, Chile.
Abstract
NGC 5986 is a poorly studied but relatively massive Galactic globular cluster that shares several physical and morphological characteristics with “iron–complex” clusters known to exhibit significant metallicity and heavy element dispersions. In order to determine if NGC 5986 joins the iron–complex cluster class, we investigated the chemical composition of 25 red giant branch and asymptotic giant branch cluster stars using high resolution spectra obtained with the Magellan–M2FS instrument. Cluster membership was verified using a combination of radial velocity and [Fe/H] measurements, and we found the cluster to have a mean heliocentric radial velocity of 99.76 km s-1 ( = 7.44 km s-1). We derived a mean metallicity of [Fe/H] = –1.54 dex ( = 0.08 dex), but the cluster’s small dispersion in [Fe/H] and low [La/Eu] abundance preclude it from being an iron–complex cluster. NGC 5986 has [Eu/Fe] = 0.76 dex ( = 0.08 dex), which is among the highest ratios detected in a Galactic cluster, but the small [Eu/Fe] dispersion is puzzling because such high values near [Fe/H] –1.5 are typically only found in dwarf galaxies exhibiting large [Eu/Fe] variations. NGC 5986 exhibits classical globular cluster characteristics, such as uniformly enhanced [/Fe] ratios, a small dispersion in Fe–peak abundances, and (anti–)correlated light element variations. Similar to NGC 2808, we find evidence that NGC 5986 may host at least 4–5 populations with distinct light element compositions, and the presence of a clear Mg–Al anti–correlation along with an Al–Si correlation suggests that the cluster gas experienced processing at temperatures 65–70 MK. However, the current data do not support burning temperatures exceeding 100 MK. We find some evidence that the first and second generation stars in NGC 5986 may be fully spatially mixed, which could indicate that the cluster has lost a significant fraction of its original mass.
1 INTRODUCTION
In contrast to the expectation that stars within a single globular cluster should exhibit relatively uniform composition patterns, early high resolution spectroscopic analyses found that the abundances of elements such as O, Na, and Al can vary significantly between stars in the same cluster (e.g., Cohen 1978; Peterson 1980; Norris et al. 1981; Norris & Pilachowski 1985; Hatzes 1987). Subsequent observations confirmed these early results and expanded upon the realization that not only are certain element pairs, such as O and Na, (anti–)correlated (e.g., Drake et al. 1992; Kraft et al. 1993, 1997; Norris & Da Costa 1995; Pilachowski et al. 1996; Sneden et al. 1997, 2000; Ivans et al. 1999, 2001; Cavallo & Nagar 2000), but that similar light element abundance patterns are present in nearly all old ( 6–8 Gyr) Galactic globular clusters (e.g., Carretta et al. 2009a,b; see also reviews by Gratton et al. 2004, 2012a). Recently, the list has grown to include old extragalactic globular clusters as well (Mucciarelli et al. 2009; Schiavon et al. 2013; Larsen et al. 2014; Dalessandro et al. 2016; Niederhofer et al. 2017; Hollyhead et al. 2017), which supports the suggestion by Carretta et al. (2010a) that a population’s stars must exhibit an O–Na anti–correlation to be labeled as a globular cluster.
Since the heavier and Fe–peak element abundances typically exhibit small ( 0.1 dex) star–to–star dispersions within globular clusters, the light element (anti–)correlations have been interpreted as a by–product of high temperature ( 40 MK) proton–capture burning (e.g., Denisenkov & Denisenkova 1990; Langer et al. 1993, 1997; Prantzos et al. 2007). Initial analyses of bright red giant branch (RGB) stars suggested that in situ processing and deep mixing could be responsible for a majority of the abundance variations (e.g., see review by Kraft 1994). However, the discovery of similar chemical trends in globular cluster main–sequence and subgiant branch stars (e.g., Briley et al. 1994, 1996; Gratton et al. 2001; Cohen & Meléndez 2005; Bragaglia et al. 2010a; D’Orazi et al. 2010; Dobrovolskas et al. 2014) revealed that the chemical composition variations must be a result of pollution from a previous generation of more massive stars.
Interestingly, the introduction of Hubble Space Telescope (HST) optical and near–UV photometry to the field showed that globular clusters form distinct populations of stars with unique light element compositions (e.g., Piotto et al. 2007, 2012, 2015; Milone et al. 2012a, 2012b) rather than the continuous distributions that are expected from simple dilution models. When combined with ground–based high resolution spectroscopy, combinations of color and pseudo–color indices can be used to create “chromosome” maps (Milone et al. 2015a, 2015b) that anchor the photometry of different stellar populations to specific compositions. Furthermore, a combination of these chromosome maps, isochrone fitting, and direct measurements have shown that, as a consequence of proton–capture nucleosynthesis, stars with enhanced abundances of [N/Fe]222[A/B] log(NA/NB)star – log(NA/NB)☉ and log (A) log(NA/NH) + 12.0 for elements A and B., [Na/Fe], and [Al/Fe] and low abundances of [C/Fe], [O/Fe], and [Mg/Fe] are also enriched in He with Y ranging from 0.01–0.15 (e.g., Norris 2004; Piotto et al. 2005; Bragaglia et al. 2010a, 2010b; Dupree et al. 2011; Pasquini et al. 2011; Milone et al. 2012a; Villanova et al. 2012; Milone 2015). In fact, the discrete nature of multiple populations in globular clusters, the variety of He enhancements and light element patterns, and the large fraction (60–80; Carretta 2015, their Figure 16) of polluted “second generation” stars in clusters place strong constraints on the possible pollution sources and enrichment time scales. However, identifying and quantifying the exact pollution source(s) remain unsolved problems (e.g., see critical discussions in Renzini 2008; Valcarce & Catelan 2011; Bastian et al. 2015; Bastian & Lardo 2015; Renzini et al. 2015; D’Antona et al. 2016).
As an added complication, a small but growing number of 10 “iron–complex” globular clusters are now known to possess intrinsic spreads in [Fe/H] that are found concurrent with the aforementioned light element abundance variations (e.g., Marino et al. 2009, 2011a, 2011b, 2015; Carretta et al. 2010b, 2011; Johnson & Pilachowski 2010; Yong et al. 2014a; Johnson et al. 2015a, 2017)333Note that the metallicity spreads for some clusters are disputed (Mucciarelli et al. 2015a, 2015b; Lardo et al. 2016; but see also Lee 2016).. These clusters are suspected to be the remnant cores of former dwarf spheroidal galaxies (e.g., Bekki & Freeman 2003; Lee et al. 2007; Georgiev et al. 2009; Da Costa 2016), and therefore may trace a part of the Galaxy’s minor merger history. Despite exhibiting broad ranges in mass, metallicity, and galactocentric distance, iron–complex clusters share several notable features: (1) they are among the most massive clusters in the Galaxy and all have MV –8.3; (2) most have very blue and extended horizontal branch morphologies; (3) the dispersion in [Fe/H] is 0.1 dex when measured from high resolution spectra; (4) several clusters contain discrete metallicity groups rather than just broadened distributions; (5) many have [Fe/H] –1.7; (6) and in all cases the stars with higher [Fe/H] have strong s–process enhancements. Using these characteristics as a template, we can search for new iron–complex clusters by measuring light and heavy element abundances in previously unobserved massive clusters with extended blue horizontal branches.
In this context, Da Costa (2016) noted that NGC 5986 may be a promising iron–complex candidate. This cluster is relatively massive with MV = –8.44 (Harris 1996; 2010 revision), has an irregular and highly eccentric prograde–retrograde orbit (Casetti–Dinescu et al. 2007; Allen et al. 2008; Moreno et al. 2014), hosts a predominantly blue and very extended horizontal branch (Kravtsov et al. 1997; Ortolani et al. 2000; Rosenberg et al. 2000; Alves et al. 2001; Momany et al. 2004; Piotto et al. 2015), and is estimated to have [Fe/H] –1.6 (Zinn & West 1984; Geisler et al. 1997; Ortolani et al. 2000; Kraft & Ivans 2003; Jasniewicz et al. 2004; Rakos & Schombert 2005; Dotter et al. 2010). However, except for an investigation into the composition of two post–asymptotic giant branch (AGB) stars by Jasniewicz et al. (2004), no detailed chemical abundance analysis has been performed for NGC 5986. Therefore, we present here a detailed composition analysis of 25 RGB and AGB stars in NGC 5986, and aim to determine if the cluster belongs to the iron–complex class or is instead a more typical monometallic cluster.
2 OBSERVATIONS AND DATA REDUCTION
The spectra for this project were acquired using the Michigan–Magellan Fiber System (M2FS; Mateo et al. 2012) and MSpec spectrograph mounted on the Clay–Magellan 6.5m telescope at Las Campanas Observatory. The observations were obtained on 2016 June 22 and 2016 June 27 in clear weather and with median seeing ranging between about 0.9 and 1.2. All observations utilized the same instrument configuration that included binning both CCDs 1 2 (dispersion spatial) with four amplifiers in a slow readout mode. The “red” and “blue” spectrographs were each configured in high resolution mode, and the 1.2 fibers, 125m slits, and echelle gratings produced a typical resolving power of R / 27,000. We also employed the “BulgeGC1” order blocking filters that provide 6 consecutive orders spanning 6120–6720 Å at the cost of only using 48 of the possible 256 fibers.
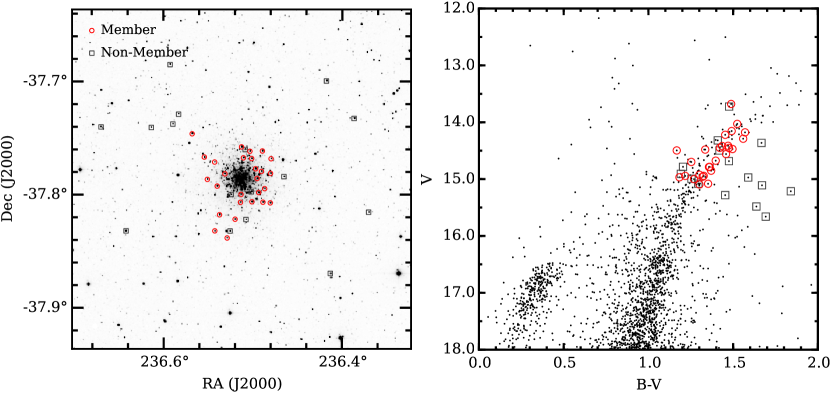
Potential target stars were identified using J and KS photometry available from the Two Micron All Sky Survey (2MASS; Skrutskie et al. 2006). We selected stars with J–KS colors of 0.7–1.1 magnitudes and KS ranging from 10.0–11.8 magnitudes. These selection criteria are equivalent to a range of about 1.1–1.9 magnitudes in B–V color and 13.5–15.7 magnitudes in the V–band, which we illustrate in Figure 1 using optical photometry from Alves et al. (2001). A broad color range was adopted in order to probe the possible existence of intrinsic metallicity variations in the cluster. However, Figure 1 shows that all of the stars redder than the formal RGB were determined to have radial velocities inconsistent with cluster membership (see Section 3). We note also that two stars with high membership probabilities (2MASS 15460024–3748232 and 2MASS 15460078–3745426) may be bluer and brighter than the formal RGB and AGB sequences, and as a consequence could be post–AGB stars.
The coordinates for all targets were obtained from the 2MASS catalog, and we were able to place fibers on 43 stars and 5 sky positions using a single configuration. Fibers were assigned to targets ranging from about 0.8–8 from the cluster center, but the member stars were only found inside 3.5. Stars inside 0.8 were avoided in order to mitigate the effects of blending and scattered light. With respect to the Alves et al. (2001) observations, we observed approximately 18 of all possible cluster stars with B–V in the range 1.1–1.9 magnitudes and with V between 13.5 and 16.0 magnitudes. The star names, coordinates, and photometry for all target stars are provided in Table 1. The evolutionary state, based on a visual inspection of Figure 1, is also provided in Table 1 for the member stars.
2.1 Data Reduction
The data reduction procedure followed the methods outlined by Johnson et al. (2015b) in which the IRAF444IRAF is distributed by the National Optical Astronomy Observatory, which is operated by the Association of Universities for Research in Astronomy, Inc., under cooperative agreement with the National Science Foundation. tasks CCDPROC, zerocombine, and darkcombine were used to trim the overscan regions, create master bias and dark frames, and remove the bias and dark current effects. These basic data reduction tasks were performed independently on each amplifier frame. The reduced images were then rotated and transposed using the imtranspose task and combined via the imjoin routine to create one full monolithic image per CCD per exposure.
The remaining tasks of aperture tracing, flat–field correcting, scattered light removal, wavelength calibration, cosmic ray cleaning, and spectrum extraction were carried out using the dohydra task. Master sky spectra for each exposure set were created by scaling and combining the extracted sky fiber spectra, which were then subtracted from the object exposures. The final sky subtracted images were continuum normalized and combined after removing the heliocentric velocities from each exposure and dividing by a high signal–to–noise (S/N) telluric spectrum. The final combined spectra had typical S/N ratios of approximately 100–200 per resolution element.
3 RADIAL VELOCITIES AND CLUSTER MEMBERSHIP
The radial velocities for all stars were calculated using the XCSAO (Kurtz & Mink 1998) cross–correlation routine. The synthetic spectrum of a cool metal–poor giant, smoothed and resampled to match the observations, was used as the reference template, and a heliocentric radial velocity value was independently determined for every order of each exposure. However, we avoided regions with very strong lines (e.g., H) and those where residual telluric features may still be present (e.g., 6270–6320 Å). The heliocentric radial velocity values listed in Table 1 represent the average velocity measurements of each order and exposure per star. Similarly, the velocity error values in Table 1 represent the standard deviation of all radial velocity measurements for each star. The average measurement uncertainties in Table 1 are 0.27 km s-1 ( = 0.07 km s-1) for the cluster members and 0.51 km s-1 ( = 0.27 km s-1) for the non–members.
Despite being a relatively massive cluster, very little kinematic information is available for NGC 5986. Previous work estimated the systemic heliocentric radial velocity of NGC 5986 to be 90–97 km s-1 with a dispersion of 6–8 km s-1 (Hesser et al. 1986; Rutledge et al. 1997; Jasniewicz et al. 2004; Moni Bidin et al. 2009). We find in general agreement with past work but measure a higher heliocentric radial velocity of 99.76 km s-1 for NGC 5986 and a velocity dispersion of 7.44 km s-1. For the non–member stars, we measure an average heliocentric radial velocity of –0.48 km s-1 ( = 60.24 km s-1).
As can be seen in Figure 2, the cluster and field star populations have clearly distinct velocity distributions. However, we note that the star 2MASS 15455164–3747031 is likely a foreground interloper. This star has a velocity of 105.81 km s-1, which is nominally consistent with cluster membership, but is significantly redder than the fiducial RGB sequence shown in Figure 1. Therefore, we have classified 2MASS 15455164–3747031 as a non–member in Table 1 and do not consider it further. Using the final membership assignments outlined in Table 1, we find 63 (27/43 stars) of the stars in our sample to be likely cluster members.
4 ANALYSIS
4.1 Stellar Parameters and Abundance Determinations
The analysis procedure adopted here closely follows the methods outlined in Johnson et al. (2015a), and includes use of the same: line lists, reference Solar abundance ratios, equivalent width (EW) measuring software, grid of –enhanced ATLAS9 model atmospheres (Castelli & Kurucz 2004)555The model atmosphere grid can be downloaded from: http://wwwuser.oats.inaf.it/castelli/grids.html., and local thermodynamic equilibrium (LTE) line analysis code MOOG666The MOOG source code is available at: http://www.as.utexas.edu/chris/moog.html. (Sneden 1973; 2014 version). On average, we measured approximately 40 Fe I and 5 Fe II lines per star, and used the EW values of both species and the abfind driver in MOOG to iteratively solve for the model atmosphere parameters effective temperature (Teff), surface gravity (log(g)), metallicity ([M/H]), and microturbulence (mic.). In particular, the Teff values were determined by removing trends in plots of log (Fe I) versus excitation potential, log(g) was estimated by enforcing ionization equilibrium between Fe I and Fe II, mic. was set by removing trends in plots of log (Fe I) versus log(EW/), and the model metallicity was set to the measured [Fe/H] abundance. A list of the adopted model atmosphere parameters for each star is provide in Table 2. Note that for 2MASS 15455531–3748266 and 2MASS 15460957–3747333 we were unable to converge to a stable model atmosphere solution and do not consider these stars further.
Similar to the case of Fe I and Fe II, the abundances of Si I, Ca I, Cr I, and Ni I were determined by an EW analysis using the MOOG abfind driver, the model atmosphere parameters listed in Table 2, and the line list provided in Johnson et al. (2015a; their Table 2). On average, the Si I, Ca I, Cr I, and Ni I abundances were based on the measurements of 4, 6, 2, and 5 lines, respectively. All abundances have been measured relative to the metal–poor giant Arcturus, which is done to help offset effects due to departures from LTE and 1D versus 3D model atmosphere deficiencies. The final [Si/Fe], [Ca/Fe], [Cr/Fe], and [Ni/Fe] abundances for all member stars are provided in Tables 3–4.
For O I, Na I, Mg I, Al I, La II, and Eu II, the abundances have been determined via the synth spectrum synthesis module in MOOG. Similar to the EW analysis, the atomic and molecular line lists within 10 Å of each feature have been tuned to reproduce the Arcturus spectrum. Specifically, the log gf values and reference Solar and Arcturus abundances for all species, except O I, are the same as those in Johnson et al. (2015a). Isotopic shifts and/or hyperfine broadening were accounted for with La II and Eu II using the line lists from Lawler et al. (2001a,b). For oxygen, we used the 6300.3 Å [O I] line and adopted the same atomic parameters and reference abundances as those provided by Johnson et al. (2014; their Table 2). Although Dupree et al. (2016) showed that the 6300.3 Å feature can be affected by a star’s chromosphere, the present data set does not provide enough information to reliably constrain a chromospheric model. Therefore, the oxygen abundances presented here are based only on radiative/convective equilibrium models.
All elements measured via spectrum synthesis included the updated CN line lists from Sneden et al. (2014), and the local CN lines were fit by fixing [C/Fe] = –0.3, holding [O/Fe] at the best–fit value determined from the 6300.3 Å line, and treating the N abundance as a free parameter. The 6319 Å Mg I triplet required additional care because the lines are relatively weak and can be affected by a broad Ca I auto–ionization feature. We modeled the impact of the auto–ionization line by artificially modifying the log (Ca) abundance during each synthesis such that the slope of the continuum around the Mg I lines was well–fit. The final [O/Fe], [Na/Fe], [Mg/Fe], [Al/Fe], [La/Fe], and [Eu/Fe] abundances for all member stars are provided in Tables 3–4, but are based on an average of only 1–2 lines for each element.
4.2 Model Atmosphere Parameter and Abundance Uncertainties
We investigated uncertainties in the model atmosphere parameters using comparisons between spectroscopic and photometric Teff and log(g) values, by investigating the typical residual scatter present in plots of log (Fe I) versus log(EW/), and by examining the typical line–to–line scatter in the derived log (Fe I) and log (Fe II) abundances. In order to estimate stellar parameters from photometry, we have to assume a cluster distance and reddening. Ortolani et al. (2000) and Alves et al. (2001) estimate distances of 11.2 kpc and 10.7 kpc, respectively, and for this work we have adopted a distance of 10.7 kpc. For the reddening, we note that while the differential reddening toward NGC 5986 is relatively low (Alves et al. 2001), the absolute reddening value is moderately high with literature estimates ranging from approximately E(B–V) = 0.22 mag. to 0.36 mag. (Zinn 1980; Bica & Pastoriza 1983; Rosenberg et al. 2000; Alves et al. 2001; Recio–Blanco et al. 2005). We initially assumed E(B–V) = 0.29 mag., which is the mean of the full literature range, but subsequent tests showed that the best agreement between the spectroscopic and photometric Teff values occurred with E(B–V) = 0.33 mag.
Using the V magnitudes from Alves et al. (2001) and the 2MASS J and KS magnitudes, we followed the photometric transformation procedure outlined in Johnson et al. (2005; see their Section 3.1) to obtain photometric temperatures for all NGC 5986 members. Assuming E(B–V) = 0.33 mag., we found the star–to–star dispersion to be 72 K. Similarly, assuming a distance of 10.7 kpc and a typical stellar mass of 0.8 M⊙777Although we are assuming the same mass for all stars in the photometric surface gravity calculation, Figure 1 shows that several stars are likely on the AGB and may have masses of 0.6 M⊙. However, the photometric gravity is only sensitive to log(M/M⊙) so the difference in log(g) is only 0.10 dex., we found the average difference in photometric and spectroscopic gravities to be 0.08 dex in log(g), with a dispersion of 0.22 dex. Therefore, we have adopted Teff and log(g) of 75 K and 0.20 dex, respectively, as typical uncertainty values. For the model metallicity uncertainties, we found the average line–to–line scatter in log (Fe I) and log (Fe II) to be 0.10 dex ( = 0.02 dex) and 0.11 dex ( = 0.04 dex), respectively. We have adopted 0.10 dex as the typical uncertainty in a star’s model atmosphere metallicity. Finally, an examination of the line–to–line scatter in plots of log (X) versus log(EW/) suggests that the typical microturbulence uncertainty is approximately 0.10 km s-1.
In order to estimate the impact of model atmosphere uncertainties on the abundance measurements, we redetermined the abundances of each element after changing Teff 75 K, log(g) 0.20 dex, [Fe/H]888Note that the use of –enhanced model atmospheres largely compensates for differences between the iron abundance ([Fe/H]) and overall metallicity ([M/H]). 0.10 dex, and mic. 0.10 km s-1. Abundance uncertainty terms were calculated for each element by individually varying the model atmosphere parameters while holding the other values fixed. The abundance uncertainties due to varying each model atmosphere parameter were then added in quadrature, along with the line–to–line measurement uncertainties, and are provided in Tables 3–4.
Finally, we note that an investigation into trends of [X/Fe] versus Teff and [Fe/H] revealed that minor trends may exist between [Ca/Fe] and Teff and [Eu/Fe] and [Fe/H]. For Ca, we find that stars with Teff 4400 K have [Ca/Fe] = 0.29 dex ( = 0.03 dex) while those with Teff 4400 K have [Ca/Fe] = 0.23 dex ( = 0.03 dex). However, the star–to–star dispersion in [Ca/Fe] is only 0.04 dex for the entire sample, and we did not find any trends between Teff and log (Fe I), log (Fe II), nor log (Ca I). Combined with the paucity of similar trends between Teff and any other [X/Fe] ratios, we believe that the mild correlation between Teff and [Ca/Fe] is insignificant.
The correlation between [Eu/Fe] and [Fe/H] is more troubling as stars with [Fe/H] –1.55 have [Eu/Fe] = 0.69 dex ( = 0.04 dex) and those with [Fe/H] –1.55 have [Eu/Fe] = 0.81 dex ( = 0.07 dex). Since the other elements examined here do not exhibit similarly strong correlations with [Fe/H], we do not have a clear explanation for the behavior of [Eu/Fe]. For example, a simple explanation such as improperly accounting for a blend of the Si I line at 6437.71 Å and the Eu II line at 6437.64 Å is unlikely because [Si/Fe] is not correlated with [Fe/H] nor [Eu/Fe]. In any case, we caution the reader that the observed star–to–star variation of 0.1 dex presented here for [Eu/Fe] may be an overestimate.
5 RESULTS AND DISCUSSION
5.1 Metallicity Distribution Function
As mentioned in Section 1, the analysis of two AGB/post–AGB stars by Jasniewicz et al. (2004), which found a cluster metallicity of [Fe/H] –1.65, represents the only detailed chemical composition measurement of individual stars in NGC 5986. However, previous and subsequent photometric analyses have found in agreement that the cluster has a mean metallicity of [Fe/H] –1.60 (Bica & Pastoriza 1983; Geisler et al. 1997; Ortolani et al. 2000; Dotter et al. 2010). In this work, we measured [Fe/H] for 25 RGB and AGB stars and derived a similar mean metallicity of [Fe/H] = –1.54 dex ( = 0.08 dex).
Interestingly, although NGC 5986 has a mean metallicity, present–day mass, and horizontal branch morphology that is similar to several iron–complex clusters, its comparatively small [Fe/H] dispersion likely precludes the cluster from being a member of the iron–complex class. For example, Figure 3 compares the [Fe/H] distributions of the monometallic cluster M 13, the iron–complex cluster NGC 6273, and NGC 5986. All three clusters exhibit extended blue horizontal branches, are relatively massive, and have comparable mean [Fe/H] values, but Figure 3 shows that NGC 5986 lacks the broad [Fe/H] spread that is a defining characteristic of iron–complex clusters. Instead, NGC 5986 appears to be a more typical monometallic cluster, similar to M 13.
5.2 Basic Chemical Composition Results
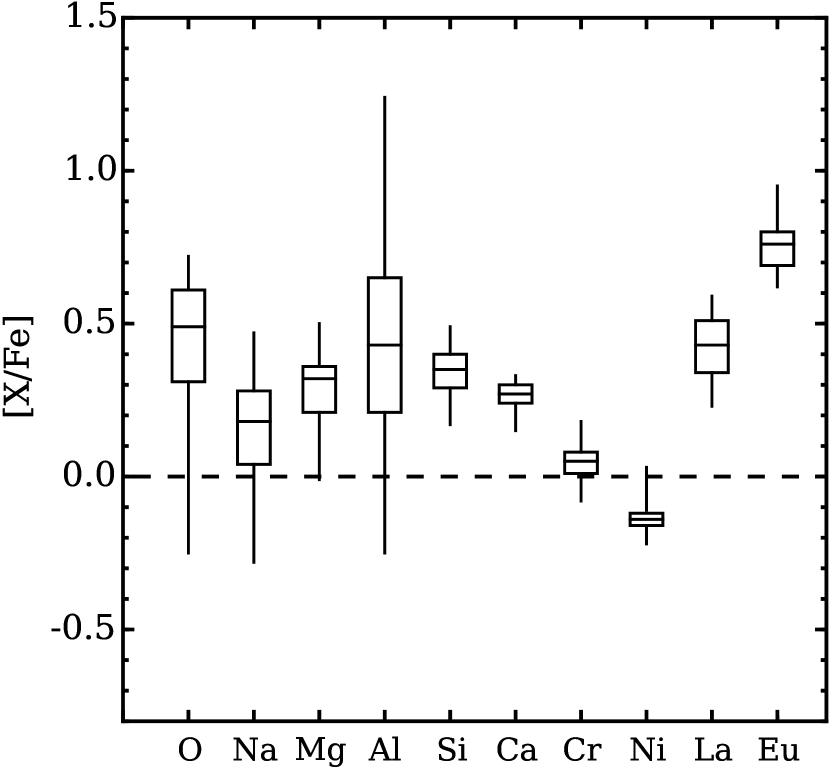
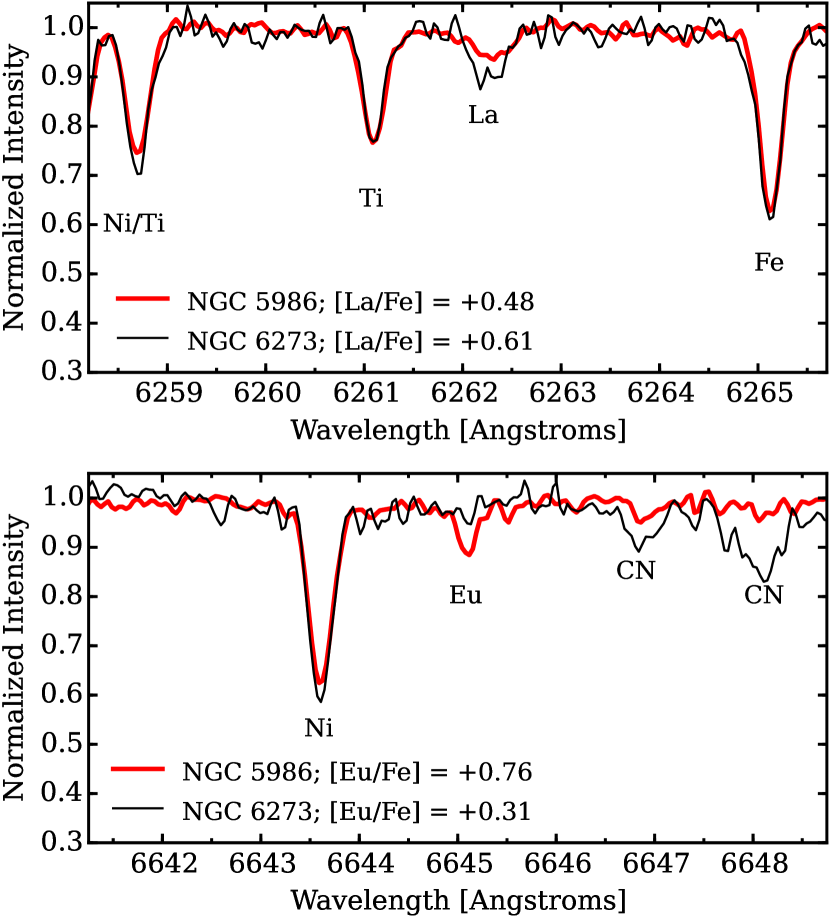
A summary of the chemical abundances found in NGC 5986 is provided as a box plot in Figure 4. Similar to other old globular clusters (e.g., see reviews by Kraft 1994 and Gratton et al. 2004), the light elements O, Na, Mg, and Al exhibit the largest star–to–star abundance variations (see also Section 5.3). Additionally, the heavy –elements are enhanced with [Si/Fe] = 0.34 dex ( = 0.08 dex) and [Ca/Fe] = 0.27 dex ( = 0.04 dex) while the Fe–peak elements Cr and Ni have approximately Solar ratios with [Cr/Fe] = 0.04 dex ( = 0.06 dex) and [Ni/Fe] = –0.12 dex ( = 0.06 dex). Interestingly, the two neutron–capture elements La and Eu are both enhanced with [La/Fe] = 0.42 dex ( = 0.11 dex) and [Eu/Fe] = 0.76 dex ( = 0.08 dex). We detect a mild correlation between [La/Fe] and [Eu/Fe], and the full [X/Fe] range exhibited by each element is 0.35 dex. Following Roederer (2011), we consider NGC 5986 to be a borderline case that may possess a small intrinsic heavy element dispersion999As discussed in Section 4.2, we detected a possible correlation between [Fe/H] and [Eu/Fe] that may be spurious and caution the reader that the cluster’s true [Eu/Fe] dispersion may be smaller than the 0.08 dex value cited here.. However, the available data seem to rule out that NGC 5986 is similar to more extreme cases, such as M 15, where the full range in [La/Fe] and [Eu/Fe] can span 0.6 dex (e.g., Sneden et al. 1997; Sobeck et al. 2011).
Although the present work represents the only large sample chemical abundance analysis of cluster RGB stars, we note that Jasniewicz et al. (2004) measured O, Na, Mg, Si, Ca, Cr, Ni, La, and Eu abundances for two highly evolved AGB/post–AGB stars. In general, both studies agree that NGC 5986 stars have [/Fe] 0.30 dex, approximately Solar [X/Fe] ratios for the Fe–peak elements, and enhanced [La/Fe] and [Eu/Fe] ratios. However, we find an average [Na/Fe] = 0.15 dex, which is significantly lower than the [Na/Fe] = 0.70–1.00 dex ratios measured by Jasniewicz et al. (2004). The heavy neutron–capture element abundance pattern exhibited by the potential post–AGB star NGC 5986 ID7 in Jasniewicz et al. (2004) follows the same distribution as the RGB/AGB stars measured here. The low [La/Eu] ratios found in both studies suggest that NGC 5986 did not experience significant s–process enrichment, and therefore the enhanced [Zr/Fe], [La/Fe], [Ce/Fe], [Sm/Fe], and [Eu/Fe] abundances of ID7 may not necessarily reflect additional processing and/or mixing via third dredge–up.
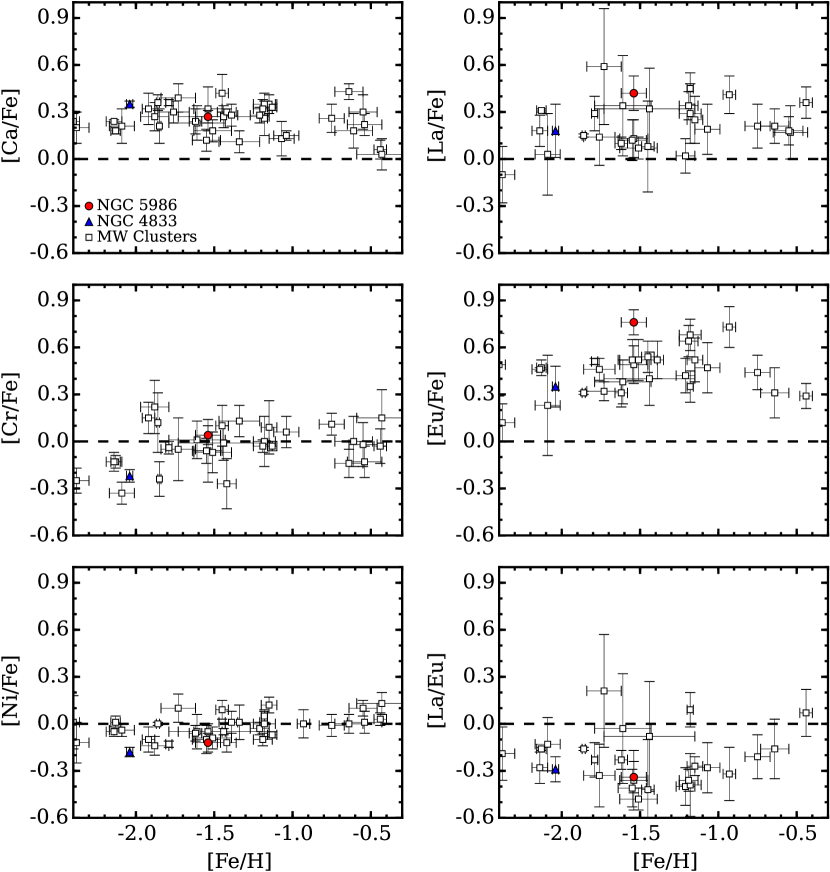
In Figure 5, we compare the abundance pattern of NGC 5986 against several Milky Way globular clusters spanning a wide range in [Fe/H], and find that NGC 5986 has a composition that is nearly identical to other similar metallicity clusters. In fact, only the cluster’s [La/Fe] and [Eu/Fe] abundances deviate from the typical Galactic trend with NGC 5986 stars exhibiting higher ratios; however, the cluster’s heavy element composition may bear some resemblance to that of M 107 (O’Connell et al. 2011). The combination of enhanced [La/Fe] and [Eu/Fe] found in NGC 5986 also nearly matches the pattern found by Cavallo et al. (2004) for the similar metallicity cluster M 80, but a recent analysis by Carretta et al. (2015) revised M 80’s mean [La/Fe] and [Eu/Fe] abundances downward by 0.3 dex.
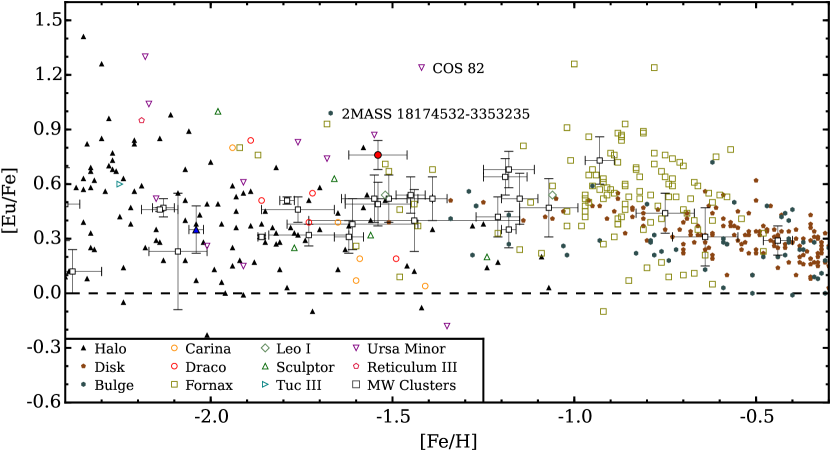
To place NGC 5986 into context, Figure 6 extends the [Eu/Fe] panel of Figure 5 to include a comparison of the cluster against individual stars in the Galactic halo, thin/thick disk, bulge, and several Local Group classical and ultra–faint dwarf galaxies. Although it is not unusual to find strongly Eu–enhanced stars at [Fe/H] –2 dex, such objects are almost exclusively found in dwarf galaxies exhibiting large [Eu/Fe] dispersions. In contrast, NGC 5986 exhibits a mean [Eu/Fe] abundance that is comparable to some of the most Eu–enhanced stars in galaxies such as Fornax, Carina, Ursa Minor, and Draco, but the cluster’s [Eu/Fe] dispersion is at least 1.5–2 times smaller. The data suggest NGC 5986 was enriched by a high–yield r–process event (or events) and that the enriched gas was able to be rapidly mixed within the cluster.
Interestingly, the high [La/Fe] abundances of stars in NGC 5986 are similar to those found in the more metal–rich populations of the iron–complex clusters Cen (e.g., Norris & Da Costa 1995; Smith et al. 2000; Johnson & Pilachowski 2010; Marino et al. 2011b), NGC 5286 (Marino et al. 2015), M 22 (Marino et al. 2009, 2011a), M 2 (Yong et al. 2014a), NGC 1851 (Carretta et al. 2011), and NGC 6273 (Johnson et al. 2015a, 2017). The mean metallicity of NGC 5986 is comparable to the typical [Fe/H] values exhibited by the Fe/s–process enhanced populations in several iron–complex clusters as well. For example, Figure 7 compares the spectrum of a star in NGC 5986 with the spectrum of an Fe/s–process enhanced star in NGC 6273 of similar temperature, metallicity, and gravity, and shows that both objects have comparable [Fe/H] and [La/Fe] abundances. However, Figure 7 also shows that the 6645 Å Eu II line in the NGC 5986 star is considerably stronger than in the NGC 6273 star. The cluster’s high [Eu/Fe] abundances and mean [La/Eu] = –0.34 dex ( = 0.10 dex) therefore follow the same r–process dominated pattern exhibited by most monometallic clusters and precludes NGC 5986 from being an iron–complex cluster.
Figure 5 also compares the , Fe–peak, and neutron–capture element abundances of NGC 5986 and NGC 4833. Although NGC 4833 is significantly more metal–poor than NGC 5986 at [Fe/H] –2.15 (Carretta et al. 2014; Roederer & Thompson 2015), Casetti–Dinescu et al. (2007) found the two clusters to exhibit similar orbital properties and suggested that the clusters may share a common origin. With the present data, it is difficult to assess whether NGC 5986 and NGC 4833 are both chemically and dynamically linked. For example, Figure 5 shows that the two clusters share similar mean [Ca/Fe], [Ni/Fe], and [La/Eu] abundances, and we can also note that both clusters may exhibit larger than average [Ca/Mg] dispersions (see also Section 5.3 here and Figure 15 of Carretta et al. 2014). In contrast, the clusters appear to have very different mean [Cr/Fe], [La/Fe], and [Eu/Fe] abundances. Therefore, NGC 5986 and NGC 4833 may exhibit larger cluster–to–cluster heavy element abundance variations than are observed among similar metallicity globular clusters associated with the Sagittarius system (e.g., Mottini et al. 2008; Sbordone et al. 2015). However, if NGC 5986 and NGC 4833 do originate from a common system, such as a dwarf galaxy, then the progenitor object may have followed a chemical enrichment path that differs from Sagittarius.
5.3 Light Element Abundance Variations
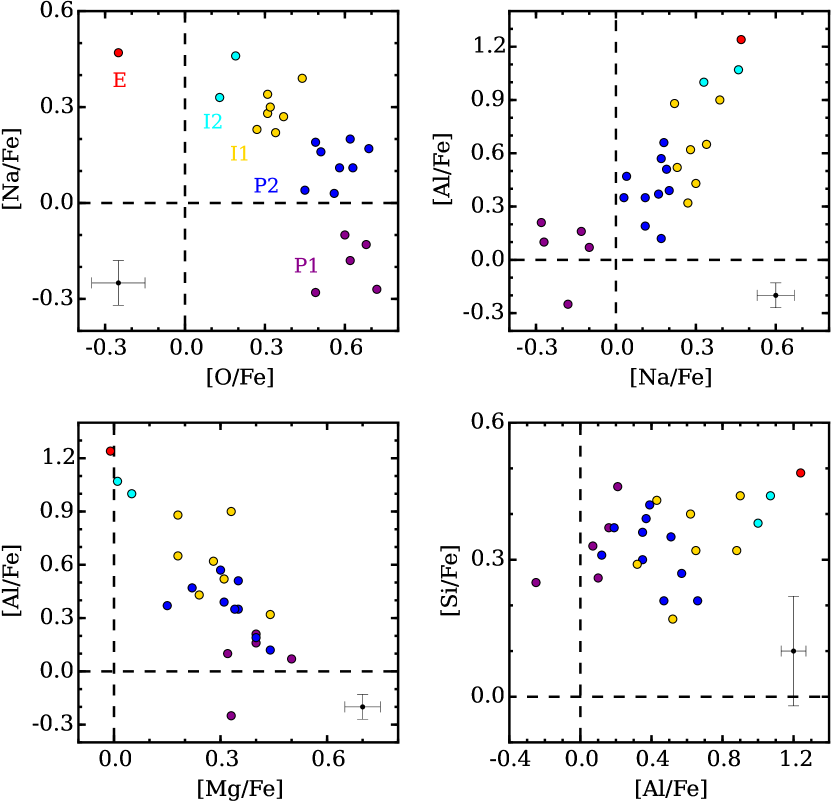
As mentioned in Section 5.2, the light elements O, Na, Mg, and Al exhibit significant star–to–star abundance variations with [X/Fe] ranging from 0.51 dex for [Mg/Fe] to 1.49 dex for [Al/Fe]. Additionally, Figure 8 shows that NGC 5986 exhibits a clear O–Na anti–correlation along with a strong Na–Al correlation. The O–Na and Na–Al relations are common features found in nearly all clusters with [Fe/H] –1, and the presence of these (anti–)correlations in stars at all evolutionary states (see Section 1) indicates that pollution, rather than in situ mixing, is the dominant mechanism driving the light element abundance variations. In this sense, the simultaneous signature of O–depletions with enhancements in Na and Al indicate that the gas from which the second generation (O/Mg–poor; Na/Al–rich) stars formed was processed at temperatures of at least 45 MK (e.g., Prantzos et al. 2007; their Figure 2). However, a variety of pollution sources, such as intermediate mass AGB stars (e.g., Ventura & D’Antona 2009; Doherty et al. 2014), rapidly rotating massive main–sequence stars (e.g., Decressin et al. 2007), massive interacting binary stars (de Mink et al. 2009), and supermassive stars (Denissenkov & Hartwick 2014), are capable of reaching these temperatures. Therefore, an examination of the interplay between Mg, Al, and Si, which are more sensitive to higher burning temperatures, can help shed light on which pollution mechanism(s) may have been active in NGC 5986 and other clusters.
The bottom panels of Figure 8 show that NGC 5986 exhibits a clear Mg–Al anti–correlation and Al–Si correlation. Unlike the more ubiquitous O–Na and Na–Al relations, the Mg–Al and Al–Si (anti–)correlations are not found in all clusters. Instead, these chemical properties seem to be common only among massive and/or metal–poor clusters with extended blue horizontal branches, such as: NGC 2808 (Carretta 2014, 2015), NGC 6752 (Yong et al. 2005; Carretta et al. 2012a), M 15 (Sneden et al. 1997; Carretta et al. 2009b); M 13 (Sneden et al. 2004; Cohen & Meléndez 2005), NGC 6273 (Johnson et al. 2015a, 2017), Cen (Norris & Da Costa 1995; Smith et al. 2000; Da Costa et al. 2013), M 54 (Carretta et al. 2010b), NGC 1851 (Carretta et al. 2012b), NGC 4833 (Carretta et al. 2014; Roederer & Thompson 2015), M 92 (Mészáros et al. 2015; Ventura et al. 2016), and NGC 6093 (Carretta et al. 2015). In NGC 5986 and similar clusters, the significant depletion of 24Mg requires temperatures 65–70 MK (e.g., Langer et al. 1997; Arnould et al. 1999; Prantzos et al. 2007). At these temperatures the 27Al(p,)28Si reaction rate exceeds that of the 27Al(p,)24Mg reaction (e.g., see Arnould et al. 1999; their Figure 8), and leakage from the Mg–Al cycle can produce small increases (0.1 dex) in [Si/Fe]. Therefore, despite significant uncertainties in several reaction rates (e.g., Izzard et al. 2007), the combined abundance patterns of O, Na, Mg, Al, and Si support the idea that the gas from which the second generation stars in NGC 5986 formed likely experienced temperatures 65–70 MK. Following D’Antona et al. (2016), we can conclude that only the AGB and/or supermassive star pollution scenarios mentioned above likely remain viable to explain the light element patterns of NGC 5986; however, these scenarios still face substantial challenges in explaining all of the observed abundance patterns (e.g., Renzini et al. 2015).
In clusters such as NGC 2419 (Cohen & Kirby 2012; Mucciarelli et al. 2012) and NGC 2808 (Carretta 2015; Mucciarelli et al. 2015c), the O, Na, Mg, Al, and Si abundance (anti–)correlations are accompanied by similar relations involving elements as heavy as K, Ca, and Sc. For these cases, Ventura et al. (2012) noted that the abundance patterns may be explained if proton–capture reactions operated in an environment where the burning temperatures exceeded 100 MK. Although we did not measure K and Sc abundances for NGC 5986, we note that Carretta et al. (2013b) and Carretta (2015) have shown that the [Ca/Mg] spread may be a reliable indicator for finding clusters that experienced extreme high temperature processing. For NGC 5986, we find that [Ca/Mg] ranges from –0.17 dex to 0.33 dex, which is larger than many clusters but less extreme than NGC 2419 and NGC 2808 (e.g., see Carretta 2015; their Figure 14). Therefore, we conclude that the gas from which the second generation stars in NGC 5986 formed did not experience significant processing at temperatures 100 MK and was instead limited to 70–100 MK.
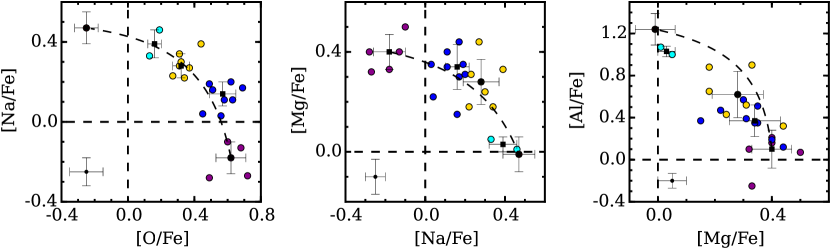
Regardless of the exact pollution source(s), multiple studies agree that dilution/mixing between the ejected material and pre–existing gas is likely required to explain the observed abundance patterns (e.g., D’Antona & Ventura 2007; Decressin et al. 2007; D’Ercole et al. 2008; Denissenkov & Hartwick 2014; D’Antona et al. 2016; but see also Bastian et al. 2015). In particular, the shapes of the various light element anti–correlations in many globular clusters closely resemble simple dilution curves. However, attempts to fit the observed data with simple dilution models have largely failed (Carretta et al. 2012a; Bastian et al. 2015; Carretta 2014; Villanova et al. 2017). In this light, Figure 9 shows the O–Na, Na–Mg, and Mg–Al anti–correlations for NGC 5986 along with dilution curves that represent the expected distributions from mixing first generation compositions with the most extreme second generation compositions. Although the O–Na and Na–Mg anti–correlations are nearly aligned with the expected distributions, neither presents an exact match. Compared to the dilution curves, the typical [Na/Fe] abundances of many intermediate composition stars are systematically too high for a given [O/Fe] or [Mg/Fe] value. Furthermore, the Mg–Al dilution curve is a poor fit to the data. Similar to the cases of NGC 6752 and NGC 2808 (Carretta et al. 2012a; Carretta 2015), we conclude that the light element distributions in NGC 5986 are not well–described by a simple dilution scenario and that more than one significant pollution source must have been present.
5.4 Discrete Populations
In addition to ruling out a simple dilution model, Figures 8–9 indicate that the light element abundances in NGC 5986 may separate into discrete groups rather than follow a continuous distribution. Using the O–Na panel of Figure 8 and following the nomenclature of Carretta (2015) for NGC 2808, we have identified five possible unique populations in NGC 5986 that are labeled as P1, P2, I1, I2, and E. In this scheme, the “primordial” P1 and P2 groups have higher [O/Fe] and [Mg/Fe] and lower [Na/Fe], [Al/Fe], and [Si/Fe] than the “intermediate” I1 and I2 groups while the “extreme” E population (1 star) exhibits the lowest [O/Fe] and [Mg/Fe] and highest [Na/Fe], [Al/Fe], and [Si/Fe] abundances. Assuming each of the identified groups is real, the P1, P2, I1, I2, and E populations constitute approximately 20, 40, 28, 8, and 4 of our sample, respectively. Interestingly, the combined 60 fraction of first generation composition stars is similar to NGC 2808 (Carretta 2015), which is another cluster known to host at least five populations. Both NGC 2808 and NGC 5986 seem to host anomalously large fractions of first generation stars.
Although the various populations are relatively well–separated in the O–Na panels of Figures 8–9, the composition boundaries distinguishing all five populations are less clear for other elements. Specifically, the Na–Al, Na–Mg, and Mg–Al plots provide strong evidence that at least three discrete populations exist (P1, P2 I1, and I2 E), but the similar abundance patterns between especially the P2 and I1 groups make additional separations more ambiguous. In order to more quantitatively assess the likelihood that at least 4–5, rather than 3, unique populations exist, we utilized the Welch’s t–test to examine differences in the mean light element [X/Fe], [O/Na], [Na/Mg], [Mg/Al], and [Al/Si] distributions of the P1, P2, I1, and I2 groups. The E population only constitutes one star and is omitted from this analysis; however, since this star has the lowest [O/Fe] and [Mg/Fe] and highest [Na/Fe], [Al/Fe], and [Si/Fe] abundances, we consider the E population to be separate from the I2 stars.
A summary of the Welch t–test results is provided in Table 6 and generally reinforces the original hypothesis that up to five populations may exist. If we adopt the common convention that a p–value 0.05 indicates sufficient evidence exists to reject the null hypothesis that two element/population pairs exhibit the same mean composition, then nearly all of the comparisons in Table 6 support 3 populations being present in NGC 5986. A comparison between the P2 and I1 groups indicates that the two populations may share similar mean [Mg/Fe] and [Si/Fe] abundances, but the p–values for [O/Fe], [Na/Fe], [Al/Fe], [O/Na], and [Na/Mg] are below 0.05. Even though the total sample size is only 25 stars, the P2 and I1 groups contain 10 and 7 stars, respectively, and are therefore less sensitive to sampling effects than the other populations. We conclude that the P2 and I1 groups are likely distinct populations.
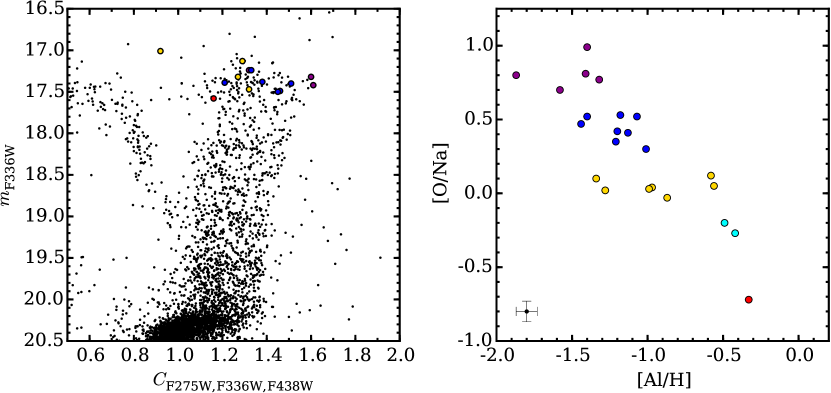
As noted in Section 1, HST UV–optical photometry is efficient at separating globular cluster stars with different light element abundances and provides an alternative method for examining a cluster’s light element composition. In Figure 10, we overlay the locations of the different populations identified here on the mF336W versus CF275W,F336W,F438W pseudo–color–magnitude diagram using data from Piotto et al. (2015) and Soto et al. (2017)101010The HST data are available for download at: http://groups.dfa.unipd.it/ESPG/treasury.php. Note that the CF275W,F336W,F438W pseudo–color index is defined as: (mF275W–mF336W)–(mF336W–mF438W).. Although distinct sequences are not easily separated in Figure 10 from the photometry, perhaps as a result of the moderately high cluster reddening (see Section 4.2), the different populations identified via spectroscopy tend to cluster in distinct regions. For example, the “primordial” stars tend to exhibit the reddest pseudo–colors while the “intermediate” and “extreme” groups are found at bluer pseudo–colors. Some population mixing is observed in Figure 10, but we suspect that this is largely driven by a combination of reddening and the mixing of RGB and AGB stars in the sample.
Further evidence supporting the existence of discrete populations in NGC 5986 is shown in the right panel of Figure 10, which plots [O/Na] versus [Al/H] (i.e., the elements exhibiting the largest abundance ranges). In general, each group spans a relatively small range in [O/Na] and [Al/H], and the median [O/Na] ratio monotonically decreases as a function of [Al/H]. Additionally, the typical separation in median [O/Na] between adjacent populations is 0.35 dex, which is about two times larger than the dispersion within each group (0.07 dex, on average). Similarly, the typical separation in median [Al/H] between adjacent groups is 0.3 dex, which is about 25 larger than the typical [Al/H] dispersion within each group (0.2 dex).
5.5 Comparisons with Similar Clusters
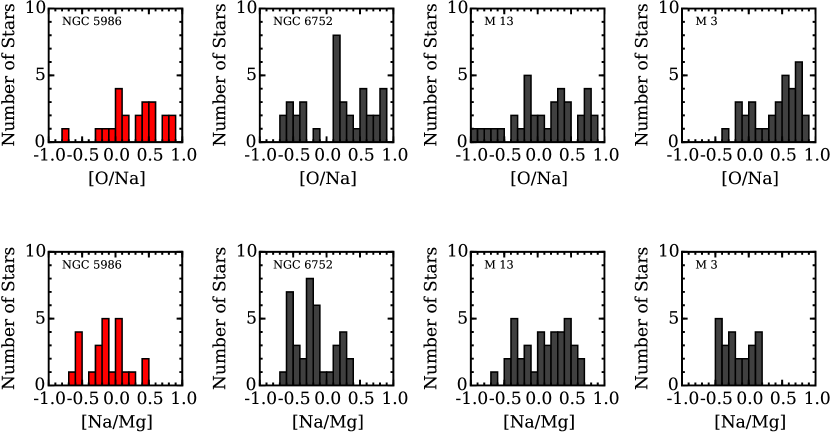
While nearly all monometallic clusters host 2–3 chemically distinct populations (e.g., Carretta et al. 2009a; Piotto et al. 2015; Milone et al. 2017), those with 3 are relatively rare. Among the monometallic clusters studied in the literature, NGC 2808 is the only convincing case of a cluster hosting at least five populations (Carretta 2015; Milone et al. 2015). The UV–optical color magnitude diagrams of NGC 5986 are not as complex as those of NGC 2808 (e.g., see Piotto et al. 2015; their Figures 6 and 10), perhaps because the abundance variations in NGC 5986 are not as extreme, but the data presented in Figures 8–10 support both clusters hosting a similar number of components. An examination of the pseudo–color–magnitude diagram compilations in Piotto et al. (2015) and Milone et al. (2017) suggests that NGC 5986 is actually very similar to the cluster M 13. Furthermore, the pseudo–color–magnitude diagram of NGC 5986 also appears to contain more photometric sequences than the case of NGC 6752, which is confirmed to have at least three distinct populations (Carretta et al. 2012a), and is significantly more complex than a typical cluster like M 3.
In Figure 11, we compare histograms of the [O/Na] and [Na/Mg] distributions for NGC 5986 and the similar metallicity clusters M 13, NGC 6752, and M 3. Figure 11 reinforces the conclusions from Section 5.4 that NGC 5986 hosts 4–5 populations, and also shows that the presence of multiple distinct populations can be easily detected in the three other clusters as well. Specifically, Figure 11 indicates that NGC 6752 has at least 3 populations, M 3 has 2–3 populations, and M 13 has 4–5 populations (see also Monelli et al. 2013).
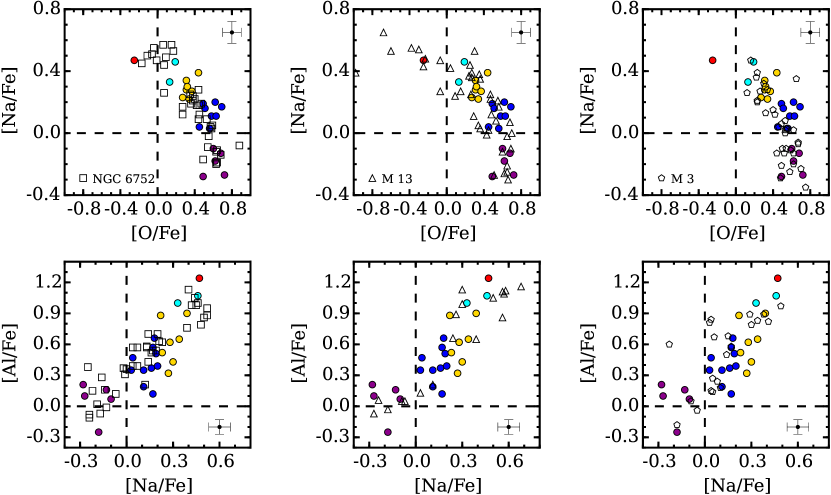
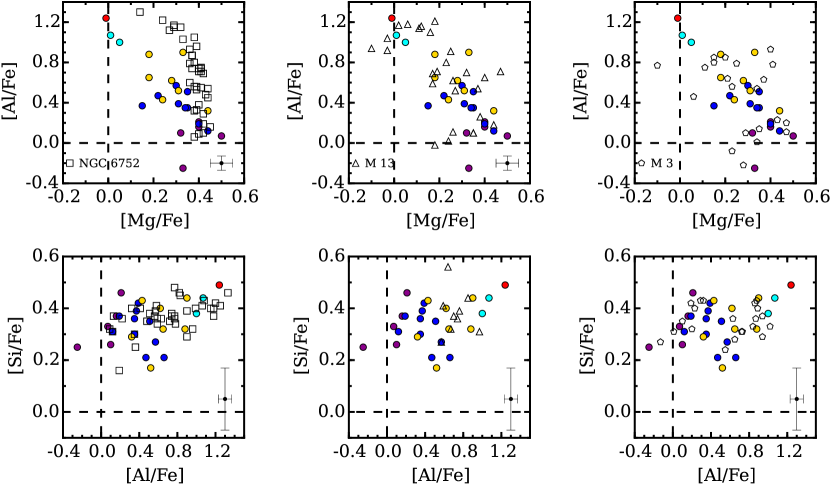
The similar enrichment histories of NGC 5986 and M 13 are further solidified in Figures 12–13 where we directly compare the O–Na, Na–Al, Mg–Al, and Si–Al distributions of all four clusters111111For Figures 11–13, we have applied systematic offsets to the literature [X/Fe] abundances so that the equivalent P1 populations of each cluster match the P1 composition of NGC 5986.. Although NGC 5986 and NGC 6752 share similar ranges in [O/Fe], [Na/Fe], [Al/Fe], and [Si/Fe], the full range in [Mg/Fe] is smaller for NGC 6752 and the two clusters exhibit different Mg–Al distributions. Similarly, the P1, P2, and I1 populations of NGC 5986 almost identically match the M 3 distribution, but M 3 does not possess stars matching the I2 and E chemical compositions. In contrast, NGC 5986 and M 13 exhibit nearly identical light element distributions, with the main difference being that the equivalent E population in M 13 may extend to somewhat lower values of [O/Fe] and higher values of [Na/Fe]. We conclude that NGC 5986 and M 13 likely shared similar chemical enrichment histories and were probably enriched by similar classes of polluters.
5.6 Spatial Mixing of First and Second Generation Stars
A commonly adopted globular cluster formation model posits that stars with compositions similar to the P1 and P2 groups in NGC 5986 are the first to form and that these stars are initially distributed at all cluster radii (e.g., D’Ercole et al. 2008). Subsequently, low velocity gas ejected from sources such as intermediate mass AGB stars forms a cooling flow that is funneled toward the cluster core where a second, more centrally concentrated, population forms. As a result, stars with compositions similar to the I1, I2, and E populations of NGC 5986 initially have radial distributions that are distinct from those of first generation stars. In this model, a cluster’s dynamical evolution favors the preferential loss of outer first generation stars, and remnants of the cluster’s initial population gradient may still be observable. However, some simulations indicate that first and second generation stars may become spatially mixed after 60 of the initial cluster mass has been lost (e.g., Vesperini et al. 2013; Miholics et al. 2015).
An examination of the radial distributions of first and second generation stars in monometallic Galactic globular clusters has produced conflicting results. For example, several earlier papers found that a large fraction of clusters tended to have centrally concentrated second generation populations (e.g., Carretta et al. 2009a, 2010c; Kravtsov et al. 2011; Lardo et al. 2011; Nataf et al. 2011; Johnson & Pilachowski 2012; Milone et al. 2012a; Richer et al. 2013; Cordero et al. 2014; Massari et al. 2016; Simioni et al. 2016). However, similar studies have also argued that many clusters either have no radial gradient (e.g., Iannicola et al. 2009; Lardo et al. 2011; Milone et al. 2013; Dalessando et al. 2014; Cordero et al. 2015; Nardiello et al. 2015; Vanderbeke et al. 2015) or that the first generation stars are actually the most centrally concentrated (e.g., Larsen et al. 2015; Vanderbeke et al. 2015; Lim et al. 2016). Although the measurements are typically straight–forward, biases can be introduced because clusters are at different stages in their dynamical evolution and various studies frequently sample different cluster regions.
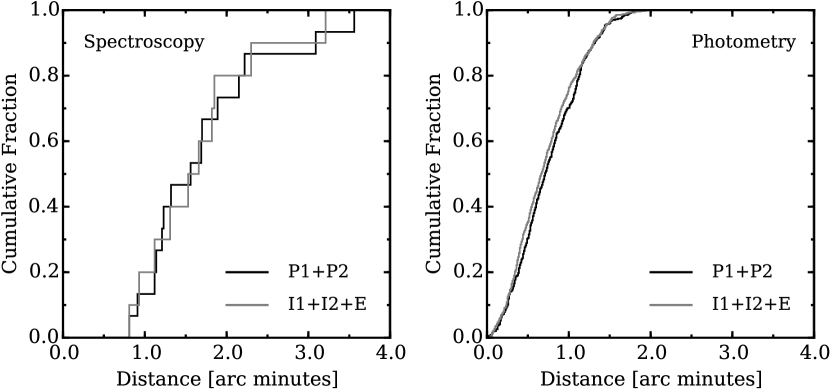
In Figure 14, we show the cumulative radial distributions of the first (P1 P2) and second (I1 I2 E) generation stars measured via spectroscopy and inferred from the HST photometry in Figure 10. The advantages of examining both data sets include a substantial increase in the sample size and an extension of the radial coverage from 0.8–3.6 half–mass radii121212We have adopted 0.98, the projected half–light radius listed in Harris (1996), as the cluster’s half–mass radius. We are assuming that the half–light and half–mass radii are approximately equal. to 0.01–3.6 half–mass radii. The additional coverage is especially important because models from Vesperini et al. (2013) indicate that the region between 1–2 half–mass radii may be where the local ratio of second–to–first generation stars is equivalent to the global ratio.
Interestingly, both the spectroscopic and photometric data in Figure 14 show that the first and second generation stars in NGC 5986 share similar radial distributions from the core out to more than 3.5 half–mass radii. Two–sided Kolmogorov–Smirnov tests of the spectroscopic and photometric sets provide p–values of 0.999 and 0.175, respectively, which indicate that the data do not provide enough evidence to reject the null hypothesis that the first and second generation stars were drawn from the same parent distribution. Therefore, we conclude that the various stellar populations in NGC 5986 are largely spatially mixed over a wide range in cluster radii. If we assume that the first and second generation stars were originally segregated but are now spatially mixed, it is possible that the cluster may have lost at least 60–80 of its original mass (Vesperini et al. 2013; Miholics et al. 2015), perhaps as a consequence of its highly eccentric inner Galaxy orbit (Casetti–Dinescu et al. 2007). However, we caution that the radial distributions may be more nuanced, and it may not necessarily be appropriate to analyze multiple groups (e.g., I1, I2, and E) as a single unit. For example, at least in M 13 Johnson & Pilachowski (2012) showed that only the most O–poor stars (E group) may be centrally concentrated, and Cordero et al. (2017) further noted that the E population exhibits faster rotation than the other sub–populations.
6 SUMMARY
This paper utilizes high resolution, high S/N data from the Magellan–M2FS instrument to obtain radial velocities and chemical abundances for a sample of 43 potential RGB and AGB stars near the Galactic globular cluster NGC 5986. A combination of velocity and [Fe/H] measurements identified 27/43 stars in our sample as likely cluster members, but we were only able to measure detailed abundances for 25/27 member stars. We found NGC 5986 to have a mean heliocentric radial velocity of 99.76 km s-1 ( = 7.44 km s-1) and a mean metallicity of [Fe/H] = –1.54 dex ( = 0.08 dex).
The cluster’s overall chemical composition characteristics are comparable to other similar metallicity clusters. For example, the heavier –elements are uniformly enhanced with [Si,Ca/Fe] = 0.30 dex ( = 0.08 dex) and the Fe–peak elements all exhibit nearly solar [X/Fe] ratios. Interestingly, the neutron–capture elements are moderately enhanced with [La/Fe] = 0.42 dex ( = 0.11 dex) and [Eu/Fe] = 0.76 dex ( = 0.08 dex), and NGC 5986 may be among the most Eu–rich clusters known in the Galaxy. The Eu enhancements are comparable to those found in similar metallicity stars in several Local Group dwarf galaxies, but NGC 5986 does not share the trait of exhibiting a large [Eu/Fe] dispersion. The cluster’s low [La/Eu] ratios combined with its small [Fe/H] and [La/Eu] dispersions preclude NGC 5986 from being a member of the iron–complex class, which is characterized by having large dispersions in [La/Eu] that are correlated with metallicity spreads.
We find that NGC 5986 exhibits all of the classical light element abundance relations, including strong anti–correlations between O–Na, Na–Mg, and Mg–Al and correlations between Na–Al and Al–Si. The combined presence of a Mg–Al anti–correlation and Al–Si correlation suggests that the gas from which the second generation stars formed must have experienced burning temperatures of at least 65–70 MK. However, the cluster does not exhibit very low [Mg/Fe] ratios nor a particularly large range in [Ca/Mg] that would indicate significant processing at temperatures exceeding 100 MK. The abundance anti–correlations are also not well–fit by a simple dilution model, which suggests that more than one class of polluters likely contributed to the cluster’s self–enrichment.
One of the most striking results is the discrete nature of the light element abundance patterns, and we find evidence that NGC 5986 may host at least 4–5 different populations with distinct compositions. Although the sample sizes within each sub–population are small, statistical tests support the idea that the commonly observed “primordial” and “intermediate” groups in NGC 5986 may each be further decomposed into populations with distinctly different light element compositions. Our analysis also identified at least one star that is very O/Mg–poor and Na/Al/Si–rich, which we designated as an “extreme” (E) population member. We find that the two primordial (P1 and P2) and intermediate (I1 and I2) groups are present in the proportions 20, 40, 28, and 8, respectively, while the single E population star constitutes the remaining 4 of our sample. If confirmed via photometry and/or larger sample spectroscopic analyses, NGC 5986 would join NGC 2808 as the only known monometallic clusters that host 3 distinct populations. However, we note that a comparison between NGC 5986 and M 13 revealed that the two clusters exhibit almost identical composition patterns, and in fact M 13 may also be composed of at least four different populations.
Interestingly, an examination of the radial distributions of first (P1 and P2) and second (I1, I2, and E) generation stars in NGC 5986 suggests that the populations are well–mixed within the cluster. This result is seemingly confirmed from both the spectroscopic sample analyzed here and a photometric sample obtained from the literature. If confirmed, the full spatial mixing of NGC 5986’s various populations may suggest either that the stars were never radially segregated or that the cluster may have lost 60–80 of its original mass.
References
- Allen et al. (2008) Allen, C., Moreno, E., & Pichardo, B. 2008, ApJ, 674, 237-246
- Alves et al. (2001) Alves, D. R., Bond, H. E., & Onken, C. 2001, AJ, 121, 318
- Aoki et al. (2007) Aoki, W., Honda, S., Sadakane, K., & Arimoto, N. 2007, PASJ, 59, L15
- Arnould et al. (1999) Arnould, M., Goriely, S., & Jorissen, A. 1999, A&A, 347, 572
- Barbuy et al. (2006) Barbuy, B., Zoccali, M., Ortolani, S., et al. 2006, A&A, 449, 349
- Barbuy et al. (2016) Barbuy, B., Cantelli, E., Vemado, A., et al. 2016, A&A, 591, A53
- Barklem et al. (2005) Barklem, P. S., Christlieb, N., Beers, T. C., et al. 2005, A&A, 439, 129
- Bastian et al. (2015) Bastian, N., Cabrera-Ziri, I., & Salaris, M. 2015, MNRAS, 449, 3333
- Bastian & Lardo (2015) Bastian, N., & Lardo, C. 2015, MNRAS, 453, 357
- Battistini & Bensby (2016) Battistini, C., & Bensby, T. 2016, A&A, 586, A49
- Bekki & Freeman (2003) Bekki, K., & Freeman, K. C. 2003, MNRAS, 346, L11
- Bica & Pastoriza (1983) Bica, E. L. D., & Pastoriza, M. G. 1983, Ap&SS, 91, 99
- Bragaglia et al. (2010a) Bragaglia, A., Carretta, E., Gratton, R. G., et al. 2010a, ApJ, 720, L41
- Bragaglia et al. (2010b) Bragaglia, A., Carretta, E., Gratton, R., et al. 2010b, A&A, 519, A60
- Briley et al. (1994) Briley, M. M., Hesser, J. E., Bell, R. A., Bolte, M., & Smith, G. H. 1994, AJ, 108, 2183
- Briley et al. (1996) Briley, M. M., Smith, V. V., Suntzeff, N. B., et al. 1996, Nature, 383, 604
- Carretta et al. (2004) Carretta, E., Gratton, R. G., Bragaglia, A., Bonifacio, P., & Pasquini, L. 2004, A&A, 416, 925
- Carretta et al. (2007) Carretta, E., Bragaglia, A., Gratton, R. G., et al. 2007, A&A, 464, 967
- Carretta et al. (2009a) Carretta, E., Bragaglia, A., Gratton, R. G., et al. 2009a, A&A, 505, 117
- Carretta et al. (2009b) Carretta, E., Bragaglia, A., Gratton, R., & Lucatello, S. 2009b, A&A, 505, 139
- Carretta et al. (2010a) Carretta, E., Bragaglia, A., Gratton, R. G., et al. 2010a, A&A, 516, A55
- Carretta et al. (2010b) Carretta, E., Bragaglia, A., Gratton, R. G., et al. 2010b, A&A, 520, A95
- Carretta et al. (2010c) Carretta, E., Bragaglia, A., D’Orazi, V., Lucatello, S., & Gratton, R. G. 2010c, A&A, 519, A71
- Carretta et al. (2011) Carretta, E., Lucatello, S., Gratton, R. G., Bragaglia, A., & D’Orazi, V. 2011, A&A, 533, A69
- Carretta et al. (2012a) Carretta, E., Bragaglia, A., Gratton, R. G., Lucatello, S., & D’Orazi, V. 2012a, ApJ, 750, L14
- Carretta et al. (2012b) Carretta, E., D’Orazi, V., Gratton, R. G., & Lucatello, S. 2012b, A&A, 543, A117
- Carretta et al. (2013a) Carretta, E., Bragaglia, A., Gratton, R. G., et al. 2013a, A&A, 557, A138
- Carretta et al. (2013b) Carretta, E., Gratton, R. G., Bragaglia, A., et al. 2013b, ApJ, 769, 40
- Carretta (2014) Carretta, E. 2014, ApJ, 795, L28
- Carretta et al. (2014) Carretta, E., Bragaglia, A., Gratton, R. G., et al. 2014, A&A, 564, A60
- Carretta (2015) Carretta, E. 2015, ApJ, 810, 148
- Carretta et al. (2015) Carretta, E., Bragaglia, A., Gratton, R. G., et al. 2015, A&A, 578, A116
- Casetti-Dinescu et al. (2007) Casetti-Dinescu, D. I., Girard, T. M., Herrera, D., et al. 2007, AJ, 134, 195
- Castelli & Kurucz (2004) Castelli, F., & Kurucz, R. L. 2004, arXiv:astro-ph/0405087
- Cavallo & Nagar (2000) Cavallo, R. M., & Nagar, N. M. 2000, AJ, 120, 1364
- Cavallo et al. (2004) Cavallo, R. M., Suntzeff, N. B., & Pilachowski, C. A. 2004, AJ, 127, 3411
- Cohen (1978) Cohen, J. G. 1978, ApJ, 223, 487
- Cohen & Meléndez (2005) Cohen, J. G., & Meléndez, J. 2005, AJ, 129, 303
- Cohen & Huang (2009) Cohen, J. G., & Huang, W. 2009, ApJ, 701, 1053
- Cohen & Huang (2010) Cohen, J. G., & Huang, W. 2010, ApJ, 719, 931
- Cohen & Kirby (2012) Cohen, J. G., & Kirby, E. N. 2012, ApJ, 760, 86
- Cordero et al. (2014) Cordero, M. J., Pilachowski, C. A., Johnson, C. I., et al. 2014, ApJ, 780, 94
- Cordero et al. (2015) Cordero, M. J., Pilachowski, C. A., Johnson, C. I., & Vesperini, E. 2015, ApJ, 800, 3
- Cordero et al. (2017) Cordero, M. J., Hénault-Brunet, V., Pilachowski, C. A., et al. 2017, MNRAS, 465, 3515
- D’Antona & Ventura (2007) D’Antona, F., & Ventura, P. 2007, MNRAS, 379, 1431
- D’Antona et al. (2016) D’Antona, F., Vesperini, E., D’Ercole, A., et al. 2016, MNRAS, 458, 2122
- D’Ercole et al. (2008) D’Ercole, A., Vesperini, E., D’Antona, F., McMillan, S. L. W., & Recchi, S. 2008, MNRAS, 391, 825
- D’Orazi et al. (2010) D’Orazi, V., Lucatello, S., Gratton, R., et al. 2010, ApJ, 713, L1
- Da Costa et al. (2013) Da Costa, G. S., Norris, J. E., & Yong, D. 2013, ApJ, 769, 8
- da Costa (2016) da Costa, G. S. 2016, The General Assembly of Galaxy Halos: Structure, Origin and Evolution, 317, 110
- Dalessandro et al. (2014) Dalessandro, E., Massari, D., Bellazzini, M., et al. 2014, ApJ, 791, L4
- Dalessandro et al. (2016) Dalessandro, E., Lapenna, E., Mucciarelli, A., et al. 2016, ApJ, 829, 77
- Decressin et al. (2007) Decressin, T., Meynet, G., Charbonnel, C., Prantzos, N., & Ekström, S. 2007, A&A, 464, 1029
- de Mink et al. (2009) de Mink, S. E., Pols, O. R., Langer, N., & Izzard, R. G. 2009, A&A, 507, L1
- Denisenkov & Denisenkova (1990) Denisenkov, P. A., & Denisenkova, S. N. 1990, Soviet Astronomy Letters, 16, 275
- Denissenkov & Hartwick (2014) Denissenkov, P. A., & Hartwick, F. D. A. 2014, MNRAS, 437, L21
- Dobrovolskas et al. (2014) Dobrovolskas, V., Kučinskas, A., Bonifacio, P., et al. 2014, A&A, 565, A121
- Doherty et al. (2014) Doherty, C. L., Gil-Pons, P., Lau, H. H. B., et al. 2014, MNRAS, 441, 582
- Dotter et al. (2010) Dotter, A., Sarajedini, A., Anderson, J., et al. 2010, ApJ, 708, 698
- Drake et al. (1992) Drake, J. J., Smith, V. V., & Suntzeff, N. B. 1992, ApJ, 395, L95
- Dupree et al. (2011) Dupree, A. K., Strader, J., & Smith, G. H. 2011, ApJ, 728, 155
- Dupree et al. (2016) Dupree, A. K., Avrett, E. H., & Kurucz, R. L. 2016, ApJ, 821, L7
- Feltzing et al. (2009) Feltzing, S., Primas, F., & Johnson, R. A. 2009, A&A, 493, 913
- Geisler et al. (1997) Geisler, D., Claria, J. J., & Minniti, D. 1997, PASP, 109, 799
- Georgiev et al. (2009) Georgiev, I. Y., Hilker, M., Puzia, T. H., Goudfrooij, P., & Baumgardt, H. 2009, MNRAS, 396, 1075
- Gratton (1987) Gratton, R. G. 1987, A&A, 179, 181
- Gratton & Ortolani (1989) Gratton, R. G., & Ortolani, S. 1989, A&A, 211, 41
- Gratton et al. (2001) Gratton, R. G., Bonifacio, P., Bragaglia, A., et al. 2001, A&A, 369, 87
- Gratton et al. (2004) Gratton, R., Sneden, C., & Carretta, E. 2004, ARA&A, 42, 385
- Gratton et al. (2006) Gratton, R. G., Lucatello, S., Bragaglia, A., et al. 2006, A&A, 455, 271
- Gratton et al. (2011) Gratton, R. G., Johnson, C. I., Lucatello, S., D’Orazi, V., & Pilachowski, C. 2011, A&A, 534, A72
- Gratton et al. (2012a) Gratton, R. G., Carretta, E., & Bragaglia, A. 2012a, A&A Rev., 20, 50
- Gratton et al. (2012b) Gratton, R. G., Lucatello, S., Carretta, E., et al. 2012b, A&A, 539, A19
- Hansen et al. (2017) Hansen, T. T., Simon, J. D., Marshall, J. L., et al. 2017, ApJ, 838, 44
- Harris (1996) Harris, W. E. 1996, AJ, 112, 1487
- Hatzes (1987) Hatzes, A. P. 1987, PASP, 99, 369
- Haynes et al. (2008) Haynes, S., Burks, G., Johnson, C. I., & Pilachowski, C. A. 2008, PASP, 120, 1097
- Hesser et al. (1986) Hesser, J. E., Shawl, S. J., & Meyer, J. E. 1986, PASP, 98, 403
- Hollyhead et al. (2017) Hollyhead, K., Kacharov, N., Lardo, C., et al. 2017, MNRAS, 465, L39
- Iannicola et al. (2009) Iannicola, G., Monelli, M., Bono, G., et al. 2009, ApJ, 696, L120
- Ivans et al. (1999) Ivans, I. I., Sneden, C., Kraft, R. P., et al. 1999, AJ, 118, 1273
- Ivans et al. (2001) Ivans, I. I., Kraft, R. P., Sneden, C., et al. 2001, AJ, 122, 1438
- Izzard et al. (2007) Izzard, R. G., Lugaro, M., Karakas, A. I., Iliadis, C., & van Raai, M. 2007, A&A, 466, 641
- Jasniewicz et al. (2004) Jasniewicz, G., de Laverny, P., Parthasarathy, M., Lèbre, A., & Thévenin, F. 2004, A&A, 423, 353
- Ji et al. (2016) Ji, A. P., Frebel, A., Simon, J. D., & Chiti, A. 2016, ApJ, 830, 93
- Johnson et al. (2005) Johnson, C. I., Kraft, R. P., Pilachowski, C. A., et al. 2005, PASP, 117, 1308
- Johnson & Pilachowski (2006) Johnson, C. I., & Pilachowski, C. A. 2006, AJ, 132, 2346
- Johnson & Pilachowski (2010) Johnson, C. I., & Pilachowski, C. A. 2010, ApJ, 722, 1373
- Johnson & Pilachowski (2012) Johnson, C. I., & Pilachowski, C. A. 2012, ApJ, 754, L38
- Johnson et al. (2012) Johnson, C. I., Rich, R. M., Kobayashi, C., & Fulbright, J. P. 2012, ApJ, 749, 175
- Johnson et al. (2013) Johnson, C. I., McWilliam, A., & Rich, R. M. 2013, ApJ, 775, L27
- Johnson et al. (2014) Johnson, C. I., Rich, R. M., Kobayashi, C., Kunder, A., & Koch, A. 2014, AJ, 148, 67
- Johnson et al. (2015a) Johnson, C. I., Rich, R. M., Pilachowski, C. A., et al. 2015a, AJ, 150, 63
- Johnson et al. (2015b) Johnson, C. I., McDonald, I., Pilachowski, C. A., et al. 2015b, AJ, 149, 71
- Johnson et al. (2016) Johnson, C. I., Caldwell, N., Rich, R. M., Pilachowski, C. A., & Hsyu, T. 2016, AJ, 152, 21
- Johnson et al. (2017) Johnson, C. I., Caldwell, N., Rich, R. M., et al. 2017, ApJ, 836, 168
- Kraft et al. (1993) Kraft, R. P., Sneden, C., Langer, G. E., & Shetrone, M. D. 1993, AJ, 106, 1490
- Kraft (1994) Kraft, R. P. 1994, PASP, 106, 553
- Kraft et al. (1997) Kraft, R. P., Sneden, C., Smith, G. H., et al. 1997, AJ, 113, 279
- Kraft & Ivans (2003) Kraft, R. P., & Ivans, I. I. 2003, PASP, 115, 143
- Kravtsov et al. (1997) Kravtsov, V. V., Pavlov, M. V., Samus’, N. N., et al. 1997, Astronomy Letters, 23, 391
- Kravtsov et al. (2011) Kravtsov, V., Alcaíno, G., Marconi, G., & Alvarado, F. 2011, A&A, 527, L9
- Kurtz & Mink (1998) Kurtz, M. J., & Mink, D. J. 1998, PASP, 110, 934
- Langer et al. (1993) Langer, G. E., Hoffman, R., & Sneden, C. 1993, PASP, 105, 301
- Langer et al. (1997) Langer, G. E., Hoffman, R. E., & Zaidins, C. S. 1997, PASP, 109, 244
- Lardo et al. (2011) Lardo, C., Bellazzini, M., Pancino, E., et al. 2011, A&A, 525, A114
- Lardo et al. (2016) Lardo, C., Mucciarelli, A., & Bastian, N. 2016, MNRAS, 457, 51
- Larsen et al. (2014) Larsen, S. S., Brodie, J. P., Grundahl, F., & Strader, J. 2014, ApJ, 797, 15
- Larsen et al. (2015) Larsen, S. S., Baumgardt, H., Bastian, N., et al. 2015, ApJ, 804, 71
- Lawler et al. (2001a) Lawler, J. E., Bonvallet, G., & Sneden, C. 2001a, ApJ, 556, 452
- Lawler et al. (2001b) Lawler, J. E., Wickliffe, M. E., den Hartog, E. A., & Sneden, C. 2001b, ApJ, 563, 1075
- Lee & Carney (2002) Lee, J.-W., & Carney, B. W. 2002, AJ, 124, 1511
- Lee et al. (2007) Lee, Y.-W., Gim, H. B., & Casetti-Dinescu, D. I. 2007, ApJ, 661, L49
- Lee (2016) Lee, J.-W. 2016, ApJS, 226, 16
- Lemasle et al. (2014) Lemasle, B., de Boer, T. J. L., Hill, V., et al. 2014, A&A, 572, A88
- Letarte et al. (2010) Letarte, B., Hill, V., Tolstoy, E., et al. 2010, A&A, 523, A17
- Lim et al. (2016) Lim, D., Lee, Y.-W., Pasquato, M., Han, S.-I., & Roh, D.-G. 2016, ApJ, 832, 99
- Marino et al. (2009) Marino, A. F., Milone, A. P., Piotto, G., et al. 2009, A&A, 505, 1099
- Marino et al. (2011a) Marino, A. F., Sneden, C., Kraft, R. P., et al. 2011a, A&A, 532, A8
- Marino et al. (2011b) Marino, A. F., Milone, A. P., Piotto, G., et al. 2011b, ApJ, 731, 64
- Marino et al. (2015) Marino, A. F., Milone, A. P., Karakas, A. I., et al. 2015, MNRAS, 450, 815
- Massari et al. (2016) Massari, D., Lapenna, E., Bragaglia, A., et al. 2016, MNRAS, 458, 4162
- Mateo et al. (2012) Mateo, M., Bailey, J. I., Crane, J., et al. 2012, Proc. SPIE, 8446, 84464Y
- McWilliam et al. (2010) McWilliam, A., Fulbright, J., & Rich, R. M. 2010, Chemical Abundances in the Universe: Connecting First Stars to Planets, 265, 279
- Mészáros et al. (2015) Mészáros, S., Martell, S. L., Shetrone, M., et al. 2015, AJ, 149, 153
- Miholics et al. (2015) Miholics, M., Webb, J. J., & Sills, A. 2015, MNRAS, 454, 2166
- Milone et al. (2012a) Milone, A. P., Piotto, G., Bedin, L. R., et al. 2012a, ApJ, 744, 58
- Milone et al. (2012b) Milone, A. P., Marino, A. F., Piotto, G., et al. 2012b, ApJ, 745, 27
- Milone et al. (2013) Milone, A. P., Marino, A. F., Piotto, G., et al. 2013, ApJ, 767, 120
- Milone (2015) Milone, A. P. 2015, MNRAS, 446, 1672
- Milone et al. (2015a) Milone, A. P., Marino, A. F., Piotto, G., et al. 2015a, MNRAS, 447, 927
- Milone et al. (2015b) Milone, A. P., Marino, A. F., Piotto, G., et al. 2015b, ApJ, 808, 51
- Milone et al. (2017) Milone, A. P., Piotto, G., Renzini, A., et al. 2017, MNRAS, 464, 3636
- Momany et al. (2004) Momany, Y., Bedin, L. R., Cassisi, S., et al. 2004, A&A, 420, 605
- Monelli et al. (2013) Monelli, M., Milone, A. P., Stetson, P. B., et al. 2013, MNRAS, 431, 2126
- Moni Bidin et al. (2009) Moni Bidin, C., Moehler, S., Piotto, G., Momany, Y., & Recio-Blanco, A. 2009, A&A, 498, 737
- Moreno et al. (2014) Moreno, E., Pichardo, B., & Velázquez, H. 2014, ApJ, 793, 110
- Mottini et al. (2008) Mottini, M., Wallerstein, G., & McWilliam, A. 2008, AJ, 136, 614
- Mucciarelli et al. (2009) Mucciarelli, A., Origlia, L., Ferraro, F. R., & Pancino, E. 2009, ApJ, 695, L134
- Mucciarelli et al. (2012) Mucciarelli, A., Bellazzini, M., Ibata, R., et al. 2012, MNRAS, 426, 2889
- Mucciarelli et al. (2015a) Mucciarelli, A., Lapenna, E., Massari, D., Ferraro, F. R., & Lanzoni, B. 2015a, ApJ, 801, 69
- Mucciarelli et al. (2015b) Mucciarelli, A., Lapenna, E., Massari, D., et al. 2015b, ApJ, 809, 128
- Mucciarelli et al. (2015c) Mucciarelli, A., Bellazzini, M., Merle, T., et al. 2015c, ApJ, 801, 68
- Nardiello et al. (2015) Nardiello, D., Milone, A. P., Piotto, G., et al. 2015, A&A, 573, A70
- Nataf et al. (2011) Nataf, D. M., Gould, A., Pinsonneault, M. H., & Stetson, P. B. 2011, ApJ, 736, 94
- Niederhofer et al. (2017) Niederhofer, F., Bastian, N., Kozhurina-Platais, V., et al. 2017, MNRAS, 465, 4159
- Norris et al. (1981) Norris, J., Cottrell, P. L., Freeman, K. C., & Da Costa, G. S. 1981, ApJ, 244, 205
- Norris & Pilachowski (1985) Norris, J., & Pilachowski, C. A. 1985, ApJ, 299, 295
- Norris & Da Costa (1995) Norris, J. E., & Da Costa, G. S. 1995, ApJ, 447, 680
- Norris (2004) Norris, J. E. 2004, ApJ, 612, L25
- O’Connell et al. (2011) O’Connell, J. E., Johnson, C. I., Pilachowski, C. A., & Burks, G. 2011, PASP, 123, 1139
- Ortolani et al. (2000) Ortolani, S., Momany, Y., Barbuy, B., Bica, E., & Catelan, M. 2000, A&A, 362, 953
- Pasquini et al. (2011) Pasquini, L., Mauas, P., Käufl, H. U., & Cacciari, C. 2011, A&A, 531, A35
- Peterson (1980) Peterson, R. C. 1980, ApJ, 237, L87
- Pilachowski et al. (1996) Pilachowski, C. A., Sneden, C., Kraft, R. P., & Langer, G. E. 1996, AJ, 112, 545
- Piotto et al. (2005) Piotto, G., Villanova, S., Bedin, L. R., et al. 2005, ApJ, 621, 777
- Piotto et al. (2007) Piotto, G., Bedin, L. R., Anderson, J., et al. 2007, ApJ, 661, L53
- Piotto et al. (2012) Piotto, G., Milone, A. P., Anderson, J., et al. 2012, ApJ, 760, 39
- Piotto et al. (2015) Piotto, G., Milone, A. P., Bedin, L. R., et al. 2015, AJ, 149, 91
- Prantzos et al. (2007) Prantzos, N., Charbonnel, C., & Iliadis, C. 2007, A&A, 470, 179
- Rakos & Schombert (2005) Rakos, K., & Schombert, J. 2005, PASP, 117, 245
- Ramírez & Cohen (2002) Ramírez, S. V., & Cohen, J. G. 2002, AJ, 123, 3277
- Recio-Blanco et al. (2005) Recio-Blanco, A., Piotto, G., de Angeli, F., et al. 2005, A&A, 432, 851
- Renzini (2008) Renzini, A. 2008, MNRAS, 391, 354
- Renzini et al. (2015) Renzini, A., D’Antona, F., Cassisi, S., et al. 2015, MNRAS, 454, 4197
- Richer et al. (2013) Richer, H. B., Heyl, J., Anderson, J., et al. 2013, ApJ, 771, L15
- Roederer (2011) Roederer, I. U. 2011, ApJ, 732, L17
- Roederer et al. (2014) Roederer, I. U., Preston, G. W., Thompson, I. B., et al. 2014, AJ, 147, 136
- Roederer & Thompson (2015) Roederer, I. U., & Thompson, I. B. 2015, MNRAS, 449, 3889
- Roederer et al. (2016) Roederer, I. U., Mateo, M., Bailey, J. I., et al. 2016, MNRAS, 455, 2417
- Rosenberg et al. (2000) Rosenberg, A., Piotto, G., Saviane, I., & Aparicio, A. 2000, A&AS, 144, 5
- Rutledge et al. (1997) Rutledge, G. A., Hesser, J. E., Stetson, P. B., et al. 1997, PASP, 109, 883
- Sbordone et al. (2015) Sbordone, L., Monaco, L., Moni Bidin, C., et al. 2015, A&A, 579, A104
- Schiavon et al. (2013) Schiavon, R. P., Caldwell, N., Conroy, C., et al. 2013, ApJ, 776, L7
- Shetrone & Keane (2000) Shetrone, M. D., & Keane, M. J. 2000, AJ, 119, 840
- Shetrone et al. (2001) Shetrone, M. D., Côté, P., & Sargent, W. L. W. 2001, ApJ, 548, 592
- Shetrone et al. (2003) Shetrone, M., Venn, K. A., Tolstoy, E., et al. 2003, AJ, 125, 684
- Simioni et al. (2016) Simioni, M., Milone, A. P., Bedin, L. R., et al. 2016, MNRAS, 463, 449
- Skrutskie et al. (2006) Skrutskie, M. F., Cutri, R. M., Stiening, R., et al. 2006, AJ, 131, 1163
- Smith et al. (2000) Smith, V. V., Suntzeff, N. B., Cunha, K., et al. 2000, AJ, 119, 1239
- Sneden (1973) Sneden, C. 1973, ApJ, 184, 839
- Sneden et al. (1997) Sneden, C., Kraft, R. P., Shetrone, M. D., et al. 1997, AJ, 114, 1964
- Sneden et al. (2000) Sneden, C., Pilachowski, C. A., & Kraft, R. P. 2000, AJ, 120, 1351
- Sneden et al. (2004) Sneden, C., Kraft, R. P., Guhathakurta, P., Peterson, R. C., & Fulbright, J. P. 2004, AJ, 127, 2162
- Sneden et al. (2014) Sneden, C., Lucatello, S., Ram, R. S., Brooke, J. S. A., & Bernath, P. 2014, ApJS, 214, 26
- Sobeck et al. (2011) Sobeck, J. S., Kraft, R. P., Sneden, C., et al. 2011, AJ, 141, 175
- Soto et al. (2017) Soto, M., Bellini, A., Anderson, J., et al. 2017, AJ, 153, 19
- Valcarce & Catelan (2011) Valcarce, A. A. R., & Catelan, M. 2011, A&A, 533, A120
- Van der Swaelmen et al. (2016) Van der Swaelmen, M., Barbuy, B., Hill, V., et al. 2016, A&A, 586, A1
- Vanderbeke et al. (2015) Vanderbeke, J., De Propris, R., De Rijcke, S., et al. 2015, MNRAS, 451, 275
- Ventura & D’Antona (2009) Ventura, P., & D’Antona, F. 2009, A&A, 499, 835
- Ventura et al. (2012) Ventura, P., D’Antona, F., Di Criscienzo, M., et al. 2012, ApJ, 761, L30
- Ventura et al. (2016) Ventura, P., García-Hernández, D. A., Dell’Agli, F., et al. 2016, ApJ, 831, L17
- Vesperini et al. (2013) Vesperini, E., McMillan, S. L. W., D’Antona, F., & D’Ercole, A. 2013, MNRAS, 429, 1913
- Villanova et al. (2012) Villanova, S., Geisler, D., Piotto, G., & Gratton, R. G. 2012, ApJ, 748, 62
- Villanova et al. (2017) Villanova, S., Moni Bidin, C., Mauro, F., Munoz, C., & Monaco, L. 2017, MNRAS, 464, 2730
- Yong et al. (2005) Yong, D., Grundahl, F., Nissen, P. E., Jensen, H. R., & Lambert, D. L. 2005, A&A, 438, 875
- Yong & Grundahl (2008) Yong, D., & Grundahl, F. 2008, ApJ, 672, L29
- Yong et al. (2014a) Yong, D., Roederer, I. U., Grundahl, F., et al. 2014a, MNRAS, 441, 3396
- Yong et al. (2014b) Yong, D., Alves Brito, A., Da Costa, G. S., et al. 2014b, MNRAS, 439, 2638
- Zinn (1980) Zinn, R. 1980, ApJS, 42, 19
- Zinn & West (1984) Zinn, R., & West, M. J. 1984, ApJS, 55, 45


| Star Name | Alt. IDaaIdentifiers are from Alves et al. (2001). | RA | DEC | B | V | J | H | KS | RVhelio. | RVhelio. Error | Evol. State |
|---|---|---|---|---|---|---|---|---|---|---|---|
| (2MASS) | (degrees) | (degrees) | (mag.) | (mag.) | (mag.) | (mag.) | (mag.) | (km s-1) | (km s-1) | ||
| Cluster Members | |||||||||||
| 154555103746063 | 153 | 236.479603 | 37.768421 | 16.396 | 15.095 | 12.406 | 11.750 | 11.597 | 104.99 | 0.42 | RGB |
| 154555243746528 | 55 | 236.480173 | 37.781353 | 15.646 | 14.155 | 11.277 | 10.568 | 10.371 | 107.77 | 0.21 | AGB |
| 154555313748266 | 85 | 236.480472 | 37.807415 | 15.816 | 14.481 | 11.812 | 11.145 | 11.008 | 95.30 | 0.33 | AGB |
| 154556823747414 | 83 | 236.486777 | 37.794834 | 15.967 | 14.471 | 11.555 | 10.837 | 10.655 | 100.24 | 0.24 | RGB |
| 154557283748245 | 90 | 236.488681 | 37.806828 | 16.018 | 14.560 | 11.686 | 10.940 | 10.776 | 111.04 | 0.28 | RGB |
| 154557433745416 | 80 | 236.489299 | 37.761562 | 15.871 | 14.450 | 11.635 | 10.909 | 10.698 | 102.67 | 0.21 | RGB |
| 154557683746466 | 111 | 236.490334 | 37.779633 | 16.147 | 14.786 | 12.035 | 11.347 | 11.196 | 93.90 | 0.23 | RGB |
| 154558433747538 | 81 | 236.493468 | 37.798294 | 15.927 | 14.452 | 11.575 | 10.844 | 10.655 | 92.88 | 0.19 | RGB |
| 154558863747091 | 127 | 236.495254 | 37.785885 | 16.161 | 14.944 | 12.367 | 11.742 | 11.534 | 102.25 | 0.35 | AGB |
| 154559263746383 | 77 | 236.496932 | 37.777321 | 15.884 | 14.414 | 11.475 | 10.780 | 10.584 | 90.17 | 0.24 | RGB |
| 154600243748232 | 25 | 236.501022 | 37.806450 | 15.167 | 13.679 | 10.888 | 10.214 | 10.022 | 101.60 | 0.22 | PostAGB? |
| 154600303746057 | 78 | 236.501274 | 37.768265 | 15.854 | 14.419 | 11.562 | 10.884 | 10.679 | 83.96 | 0.24 | RGB |
| 154600783745426 | 86 | 236.503273 | 37.761837 | 15.663 | 14.496 | 11.714 | 11.055 | 10.869 | 103.40 | 0.24 | PostAGB? |
| 154602533746035 | 132 | 236.510547 | 37.767647 | 16.151 | 14.968 | 12.477 | 11.886 | 11.737 | 84.93 | 0.33 | AGB |
| 154603033745286 | 45 | 236.512634 | 37.757965 | 15.553 | 14.029 | 11.112 | 10.418 | 10.231 | 110.23 | 0.19 | AGB |
| 154603173747598 | 126 | 236.513216 | 37.799950 | 16.269 | 14.943 | 12.326 | 11.676 | 11.501 | 93.68 | 0.33 | RGB |
| 154603323748249 | 99 | 236.513847 | 37.806942 | 16.073 | 14.676 | 11.921 | 11.184 | 11.040 | 96.90 | 0.21 | RGB |
| 154604763749186 | 112 | 236.519865 | 37.821861 | 16.144 | 14.787 | 12.038 | 11.365 | 11.188 | 101.56 | 0.24 | RGB |
| 154606903750184 | 152 | 236.528773 | 37.838455 | 16.434 | 15.082 | 12.480 | 11.700 | 11.538 | 98.94 | 0.36 | RGB |
| 154607513746542 | 60 | 236.531298 | 37.781746 | 15.674 | 14.221 | 11.387 | 10.683 | 10.458 | 113.51 | 0.24 | AGB |
| 154608953749046 | 57 | 236.537307 | 37.817947 | 15.748 | 14.178 | 11.174 | 10.418 | 10.247 | 101.88 | 0.26 | RGB |
| 154609573747333 | 102 | 236.539912 | 37.792603 | 15.951 | 14.698 | 12.108 | 11.477 | 11.366 | 97.21 | 0.43 | AGB |
| 154610223749558 | 116 | 236.542585 | 37.832172 | 16.222 | 14.852 | 12.066 | 11.381 | 11.221 | 94.54 | 0.28 | RGB |
| 154610253746168 | 123 | 236.542741 | 37.771343 | 16.225 | 14.924 | 12.318 | 11.635 | 11.506 | 107.23 | 0.25 | RGB |
| 154612223747118 | 140 | 236.550938 | 37.786636 | 16.270 | 15.001 | 12.396 | 11.717 | 11.562 | 108.25 | 0.34 | RGB |
| 154613033746009 | 129 | 236.554316 | 37.766926 | 16.278 | 14.958 | 12.264 | 11.627 | 11.448 | 97.89 | 0.25 | RGB |
| 154616303744468 | 65 | 236.567931 | 37.746349 | 15.849 | 14.290 | 11.238 | 10.460 | 10.337 | 96.71 | 0.21 | RGB |
| Non–Members | |||||||||||
| 154528863748562 | 270 | 236.370278 | 37.815613 | 17.352 | 15.660 | 12.433 | 11.811 | 11.598 | 28.98 | 1.25 | |
| 154532793743579 | 176 | 236.386664 | 37.732777 | 17.054 | 15.214 | 11.784 | 10.945 | 10.717 | 1.95 | 0.39 | |
| 154539143752110 | 135 | 236.413115 | 37.869740 | 16.561 | 14.972 | 12.285 | 11.683 | 11.548 | 8.96 | 0.58 | |
| 154540233741589 | 87 | 236.417660 | 37.699699 | 15.916 | 14.497 | 11.822 | 11.114 | 10.978 | 10.28 | 0.39 | |
| 154551643747031 | 158 | 236.465173 | 37.784206 | 16.779 | 15.109 | 12.301 | 11.696 | 11.491 | 105.81 | 1.06 | |
| 154600393747517 | 110 | 236.501659 | 37.797695 | 15.988 | 14.784 | 12.330 | 11.742 | 11.568 | 46.47 | 0.24 | |
| 154601843749195 | 151 | 236.507702 | 37.822098 | 16.375 | 15.081 | 12.397 | 11.756 | 11.558 | 38.94 | 0.44 | |
| 154602063745372 | 69 | 236.508607 | 37.760357 | 15.728 | 14.319 | 11.579 | 10.853 | 10.713 | 146.82 | 0.43 | |
| 154605823748002 | 121 | 236.524272 | 37.800072 | 16.098 | 14.907 | 12.389 | 11.792 | 11.647 | 46.02 | 0.54 | |
| 154606123749563 | 100 | 236.525510 | 37.832314 | 16.159 | 14.684 | 11.714 | 11.058 | 10.861 | 36.50 | 0.54 | |
| 154619933743446 | 139 | 236.583058 | 37.729076 | 16.248 | 14.994 | 12.452 | 11.824 | 11.721 | 28.73 | 0.31 | |
| 154621473744159 | 194 | 236.589484 | 37.737766 | 16.735 | 15.282 | 12.403 | 11.641 | 11.509 | 8.47 | 0.29 | |
| 154622213741066 | 71 | 236.592569 | 37.685184 | 16.030 | 14.363 | 11.231 | 10.471 | 10.277 | 2.99 | 0.49 | |
| 154627263744267 | 228 | 236.613608 | 37.740757 | 17.119 | 15.482 | 12.293 | 11.462 | 11.231 | 36.84 | 0.47 | |
| 154634083749556 | 30 | 236.642030 | 37.832115 | 15.200 | 13.724 | 11.012 | 10.330 | 10.169 | 77.36 | 0.40 | |
| 154640773744246 | 236.669894 | 37.740177 | 12.120 | 11.561 | 11.376 | 72.71 | 0.38 | ||||
| Star Name | Teff | log(g) | [Fe/H] | mic. |
|---|---|---|---|---|
| (2MASS) | (K) | (cgs) | (dex) | (km s-1) |
| 154555103746063 | 4475 | 1.15 | 1.59 | 1.70 |
| 154555243746528 | 4275 | 0.60 | 1.60 | 1.90 |
| 154555313748266 | ||||
| 154556823747414 | 4300 | 0.80 | 1.57 | 1.80 |
| 154557283748245 | 4300 | 0.80 | 1.49 | 1.65 |
| 154557433745416 | 4375 | 1.10 | 1.46 | 1.80 |
| 154557683746466 | 4375 | 0.90 | 1.65 | 1.80 |
| 154558433747538 | 4375 | 1.25 | 1.52 | 1.95 |
| 154558863747091 | 4600 | 1.25 | 1.58 | 1.65 |
| 154559263746383 | 4350 | 1.15 | 1.42 | 1.75 |
| 154600243748232 | 4300 | 0.45 | 1.66 | 1.80 |
| 154600303746057 | 4325 | 1.00 | 1.52 | 1.80 |
| 154600783745426 | 4325 | 0.90 | 1.57 | 1.50 |
| 154602533746035 | 4500 | 0.95 | 1.71 | 1.55 |
| 154603033745286 | 4250 | 0.50 | 1.62 | 1.95 |
| 154603173747598 | 4600 | 1.45 | 1.46 | 1.60 |
| 154603323748249 | 4350 | 1.05 | 1.63 | 1.85 |
| 154604763749186 | 4450 | 1.25 | 1.50 | 1.65 |
| 154606903750184 | 4400 | 0.95 | 1.61 | 1.65 |
| 154607513746542 | 4325 | 1.05 | 1.52 | 1.85 |
| 154608953749046 | 4225 | 0.65 | 1.53 | 1.95 |
| 154609573747333 | ||||
| 154610223749558 | 4550 | 1.50 | 1.45 | 1.85 |
| 154610253746168 | 4550 | 1.50 | 1.45 | 1.60 |
| 154612223747118 | 4550 | 1.60 | 1.49 | 1.70 |
| 154613033746009 | 4550 | 1.50 | 1.49 | 1.80 |
| 154616303744468 | 4250 | 0.80 | 1.53 | 2.00 |
| Star Name | [O I/Fe] | [O I/Fe] | [Na I/Fe] | [Na I/Fe] | [Mg I/Fe] | [Mg I/Fe] | [Al I/Fe] | [Al I/Fe] | [Si I/Fe] | [Si I/Fe] | [Ca I/Fe] | [Ca I/Fe] |
|---|---|---|---|---|---|---|---|---|---|---|---|---|
| (2MASS) | (dex) | (dex) | (dex) | (dex) | (dex) | (dex) | (dex) | (dex) | (dex) | (dex) | (dex) | (dex) |
| 154555103746063 | 0.62 | 0.10 | 0.20 | 0.09 | 0.31 | 0.05 | 0.39 | 0.07 | 0.42 | 0.13 | 0.31 | 0.07 |
| 154555243746528 | 0.45 | 0.10 | 0.04 | 0.12 | 0.22 | 0.04 | 0.47 | 0.11 | 0.21 | 0.11 | 0.26 | 0.07 |
| 154555313748266 | ||||||||||||
| 154556823747414 | 0.25 | 0.10 | 0.47 | 0.06 | 0.01 | 0.07 | 1.24 | 0.06 | 0.49 | 0.11 | 0.32 | 0.05 |
| 154557283748245 | 0.27 | 0.10 | 0.23 | 0.04 | 0.31 | 0.07 | 0.52 | 0.13 | 0.17 | 0.15 | 0.24 | 0.06 |
| 154557433745416 | 0.34 | 0.10 | 0.22 | 0.14 | 0.18 | 0.06 | 0.88 | 0.07 | 0.32 | 0.11 | 0.31 | 0.06 |
| 154557683746466 | 0.60 | 0.10 | 0.10 | 0.08 | 0.50 | 0.03 | 0.07 | 0.06 | 0.33 | 0.12 | 0.33 | 0.06 |
| 154558433747538 | 0.69 | 0.10 | 0.17 | 0.03 | 0.44 | 0.05 | 0.12 | 0.07 | 0.31 | 0.11 | 0.28 | 0.05 |
| 154558863747091 | 0.51 | 0.10 | 0.16 | 0.06 | 0.15 | 0.05 | 0.37 | 0.07 | 0.39 | 0.12 | 0.24 | 0.06 |
| 154559263746383 | 0.63 | 0.10 | 0.11 | 0.08 | 0.34 | 0.05 | 0.35 | 0.07 | 0.30 | 0.12 | 0.30 | 0.05 |
| 154600243748232 | 0.37 | 0.10 | 0.27 | 0.04 | 0.44 | 0.05 | 0.32 | 0.07 | 0.29 | 0.11 | 0.28 | 0.07 |
| 154600303746057 | 0.49 | 0.10 | 0.19 | 0.03 | 0.35 | 0.05 | 0.51 | 0.07 | 0.35 | 0.18 | 0.25 | 0.05 |
| 154600783745426 | 0.68 | 0.10 | 0.13 | 0.19 | 0.40 | 0.03 | 0.16 | 0.07 | 0.37 | 0.11 | 0.26 | 0.06 |
| 154602533746035 | 0.32 | 0.10 | 0.30 | 0.08 | 0.24 | 0.05 | 0.43 | 0.10 | 0.43 | 0.12 | 0.15 | 0.06 |
| 154603033745286 | 0.62 | 0.10 | 0.18 | 0.06 | 0.33 | 0.04 | 0.25 | 0.05 | 0.25 | 0.11 | 0.29 | 0.06 |
| 154603173747598 | 0.44 | 0.10 | 0.39 | 0.11 | 0.33 | 0.05 | 0.90 | 0.05 | 0.44 | 0.11 | 0.22 | 0.06 |
| 154603323748249 | 0.58 | 0.10 | 0.11 | 0.07 | 0.40 | 0.03 | 0.19 | 0.07 | 0.37 | 0.11 | 0.30 | 0.06 |
| 154604763749186 | 0.72 | 0.10 | 0.27 | 0.09 | 0.32 | 0.05 | 0.10 | 0.07 | 0.26 | 0.12 | 0.19 | 0.06 |
| 154606903750184 | 0.31 | 0.10 | 0.28 | 0.03 | 0.28 | 0.05 | 0.62 | 0.05 | 0.40 | 0.11 | 0.29 | 0.06 |
| 154607513746542 | 0.31 | 0.10 | 0.34 | 0.08 | 0.18 | 0.05 | 0.65 | 0.07 | 0.32 | 0.12 | 0.27 | 0.06 |
| 154608953749046 | 0.49 | 0.10 | 0.28 | 0.08 | 0.40 | 0.05 | 0.21 | 0.07 | 0.46 | 0.12 | 0.33 | 0.06 |
| 154609573747333 | ||||||||||||
| 154610223749558 | 0.17 | 0.03 | 0.30 | 0.05 | 0.57 | 0.07 | 0.27 | 0.11 | 0.21 | 0.05 | ||
| 154610253746168 | 0.18 | 0.03 | 0.66 | 0.04 | 0.21 | 0.11 | 0.22 | 0.06 | ||||
| 154612223747118 | 0.13 | 0.10 | 0.33 | 0.03 | 0.05 | 0.05 | 1.00 | 0.10 | 0.38 | 0.12 | 0.26 | 0.06 |
| 154613033746009 | 0.19 | 0.10 | 0.46 | 0.08 | 0.01 | 0.05 | 1.07 | 0.07 | 0.44 | 0.12 | 0.26 | 0.06 |
| 154616303744468 | 0.56 | 0.10 | 0.03 | 0.08 | 0.35 | 0.05 | 0.35 | 0.05 | 0.36 | 0.11 | 0.30 | 0.06 |
| Star Name | [Cr I/Fe] | [Cr I/Fe] | [Fe I/H] | [Fe I/H] | [Fe II/H] | [Fe II/H] | [Ni I/Fe] | [Ni I/Fe] | [La II/Fe] | [La II/Fe] | [Eu II/Fe] | [Eu II/Fe] |
|---|---|---|---|---|---|---|---|---|---|---|---|---|
| (2MASS) | (dex) | (dex) | (dex) | (dex) | (dex) | (dex) | (dex) | (dex) | (dex) | (dex) | (dex) | (dex) |
| 154555103746063 | 0.05 | 0.09 | 1.59 | 0.10 | 1.58 | 0.12 | 0.14 | 0.07 | 0.52 | 0.10 | 0.68 | 0.10 |
| 154555243746528 | 0.08 | 0.07 | 1.60 | 0.10 | 1.60 | 0.12 | 0.12 | 0.06 | 0.34 | 0.10 | 0.62 | 0.10 |
| 154555313748266 | ||||||||||||
| 154556823747414 | 0.07 | 0.05 | 1.57 | 0.10 | 1.57 | 0.13 | 0.16 | 0.06 | 0.38 | 0.10 | 0.67 | 0.10 |
| 154557283748245 | 0.08 | 0.06 | 1.49 | 0.10 | 1.48 | 0.11 | 0.14 | 0.06 | 0.24 | 0.10 | 0.76 | 0.11 |
| 154557433745416 | 0.06 | 0.06 | 1.46 | 0.10 | 1.46 | 0.13 | 0.14 | 0.06 | 0.51 | 0.10 | 0.89 | 0.11 |
| 154557683746466 | 0.10 | 0.06 | 1.65 | 0.10 | 1.65 | 0.12 | 0.02 | 0.06 | 0.23 | 0.10 | 0.70 | 0.15 |
| 154558433747538 | 0.02 | 0.05 | 1.52 | 0.10 | 1.51 | 0.12 | 0.06 | 0.05 | 0.53 | 0.10 | 0.95 | 0.12 |
| 154558863747091 | 1.58 | 0.10 | 1.58 | 0.11 | 0.17 | 0.07 | 0.23 | 0.11 | 0.79 | 0.10 | ||
| 154559263746383 | 0.02 | 0.05 | 1.42 | 0.10 | 1.42 | 0.13 | 0.07 | 0.07 | 0.46 | 0.10 | 0.79 | 0.10 |
| 154600243748232 | 1.67 | 0.10 | 1.64 | 0.12 | 0.20 | 0.05 | 0.36 | 0.11 | 0.69 | 0.10 | ||
| 154600303746057 | 0.07 | 0.05 | 1.51 | 0.10 | 1.52 | 0.11 | 0.18 | 0.05 | 0.53 | 0.10 | 0.79 | 0.10 |
| 154600783745426 | 0.05 | 0.06 | 1.58 | 0.10 | 1.56 | 0.13 | 0.14 | 0.05 | 0.35 | 0.15 | 0.69 | 0.10 |
| 154602533746035 | 0.14 | 0.06 | 1.72 | 0.10 | 1.69 | 0.12 | 0.13 | 0.06 | 0.53 | 0.11 | 0.68 | 0.10 |
| 154603033745286 | 0.03 | 0.06 | 1.61 | 0.10 | 1.62 | 0.12 | 0.16 | 0.06 | 0.32 | 0.11 | 0.66 | 0.10 |
| 154603173747598 | 0.02 | 0.06 | 1.46 | 0.10 | 1.46 | 0.13 | 0.03 | 0.15 | 0.34 | 0.15 | 0.82 | 0.10 |
| 154603323748249 | 0.08 | 0.06 | 1.63 | 0.10 | 1.62 | 0.11 | 0.17 | 0.07 | 0.49 | 0.10 | 0.74 | 0.10 |
| 154604763749186 | 0.06 | 0.06 | 1.50 | 0.10 | 1.50 | 0.12 | 0.12 | 0.06 | 0.48 | 0.14 | 0.76 | 0.11 |
| 154606903750184 | 0.04 | 0.06 | 1.61 | 0.10 | 1.60 | 0.11 | 0.15 | 0.10 | 0.29 | 0.11 | 0.71 | 0.10 |
| 154607513746542 | 0.02 | 0.06 | 1.51 | 0.10 | 1.52 | 0.12 | 0.14 | 0.05 | 0.43 | 0.10 | 0.81 | 0.10 |
| 154608953749046 | 0.00 | 0.06 | 1.53 | 0.10 | 1.53 | 0.13 | 0.10 | 0.07 | 0.35 | 0.10 | 0.75 | 0.10 |
| 154609573747333 | ||||||||||||
| 154610223749558 | 0.11 | 0.05 | 1.45 | 1.45 | 0.11 | 0.12 | 0.06 | 0.59 | 0.10 | 0.95 | 0.14 | |
| 154610253746168 | 0.07 | 0.06 | 1.44 | 1.45 | 0.13 | 0.22 | 0.06 | 0.48 | 0.12 | 0.80 | 0.10 | |
| 154612223747118 | 0.18 | 0.06 | 1.48 | 0.10 | 1.49 | 0.13 | 0.13 | 0.07 | 0.49 | 0.11 | 0.80 | 0.18 |
| 154613033746009 | 0.05 | 0.06 | 1.49 | 0.10 | 1.49 | 0.12 | 0.03 | 0.07 | 0.59 | 0.10 | 0.79 | 0.12 |
| 154616303744468 | 0.09 | 0.06 | 1.53 | 0.10 | 1.53 | 0.12 | 0.11 | 0.05 | 0.42 | 0.10 | 0.77 | 0.10 |
| Cluster | Source |
|---|---|
| HP-1 | Barbuy et al. (2006) |
| HP-1 | Barbuy et al. (2016) |
| M 10 | Haynes et al. (2008) |
| M 107 | O’Connell et al. (2011) |
| M 12 | Johnson & Pilachowski (2006) |
| M 13 | Sneden et al. (2004) |
| M 13 | Cohen & Meléndez (2005) |
| M 15 | Sneden et al. (1997) |
| M 2 | Yong et al. (2014a) |
| M 22 | Marino et al. (2011a) |
| M 3 | Sneden et al. (2004) |
| M 3 | Cohen & Meléndez (2005) |
| M 4 | Ivans et al. (1999) |
| M 5 | Ivans et al. (2001) |
| M 62 | Yong et al. (2014b) |
| M 71 | Ramírez & Cohen(2002) |
| NGC 6342 | Johnson et al. (2016b) |
| NGC 6366 | Johnson et al. (2016b) |
| NGC 104 | Carretta et al. (2004) |
| NGC 104 | Cordero et al. (2014) |
| NGC 1851 | Yong & Grundahl (2008) |
| NGC 1851 | Carretta et al. (2011) |
| NGC 1851 | Gratton et al. (2012b) |
| NGC 1904 | Gratton & Ortolani (1989) |
| NGC 2419 | Cohen & Kirby (2012) |
| NGC 2808 | Carretta (2015) |
| NGC 288 | Shetrone & Keane (2000) |
| NGC 3201 | Gratton & Ortolani (1989) |
| NGC 362 | Shetrone & Keane (2000) |
| NGC 362 | Carretta et al. (2013a) |
| NGC 4590 | Gratton & Ortolani (1989) |
| NGC 4833 | Carretta et al. (2014) |
| NGC 4833 | Roederer & Thompson (2015) |
| NGC 5286 | Marino et al. (2015) |
| NGC 5824 | Roederer et al. (2016) |
| NGC 5897 | Gratton (1987) |
| NGC 6093 | Carretta et al. (2015) |
| NGC 6273 | Johnson et al. (2015a) |
| NGC 6273 | Johnson et al. (2017) |
| NGC 6287 | Lee & Carney (2002) |
| NGC 6293 | Lee & Carney (2002) |
| NGC 6352 | Feltzing et al. (2009) |
| NGC 6362 | Gratton (1987) |
| NGC 6388 | Carretta et al. (2007) |
| NGC 6397 | Gratton & Ortolani (1989) |
| NGC 6441 | Gratton et al. (2006) |
| NGC 6541 | Lee & Carney (2002) |
| NGC 6752 | Yong et al. (2005) |
| Populations | [O/Fe] | [Na/Fe] | [Mg/Fe] | [Al/Fe] | [Si/Fe] | [O/Na] | [Na/Mg] | [Mg/Al] | [Al/Si] |
|---|---|---|---|---|---|---|---|---|---|
| t (P1P2) | 1.15 | 7.98 | 1.65 | 3.54 | 0.33 | 6.60 | 8.51 | 3.71 | 4.04 |
| d.o.f. | 8 | 6 | 10 | 7 | 7 | 7 | 12 | 10 | 12 |
| p | 2.8310-1 | 1.5210-4 | 1.2910-1 | 8.5610-3 | 7.4810-1 | 2.8110-4 | 2.5610-6 | 3.9610-3 | 1.5710-3 |
| t (P1I1) | 6.42 | 11.27 | 2.32 | 4.86 | 0.09 | 14.85 | 11.40 | 5.20 | 5.70 |
| d.o.f. | 6 | 7 | 10 | 10 | 9 | 5 | 10 | 10 | 10 |
| p | 5.9310-4 | 9.4010-6 | 4.3110-2 | 7.3310-4 | 9.3310-1 | 1.6910-5 | 5.5110-7 | 4.2210-4 | 2.1010-4 |
| t (P1I2) | 9.35 | 7.89 | 9.49 | 11.11 | 1.56 | 17.65 | 10.51 | 14.38 | 15.77 |
| d.o.f. | 4 | 2 | 5 | 5 | 4 | 4 | 1 | 4 | 4 |
| p | 5.4510-4 | 2.5410-2 | 2.6810-4 | 1.1010-4 | 1.9210-1 | 2.9510-5 | 3.5310-2 | 7.4410-5 | 8.5310-5 |
| t (P2I1) | 6.53 | 5.17 | 0.83 | 2.26 | 0.46 | 11.03 | 3.62 | 2.30 | 1.95 |
| d.o.f. | 12 | 13 | 13 | 11 | 11 | 12 | 13 | 11 | 13 |
| p | 2.4410-5 | 1.7110-4 | 4.2210-1 | 4.6110-2 | 6.5410-1 | 1.7610-7 | 3.2310-3 | 4.2210-2 | 7.2910-2 |
| t (P2I2) | 9.84 | 3.82 | 8.09 | 10.18 | 2.41 | 14.62 | 6.05 | 10.77 | 8.21 |
| d.o.f. | 3 | 1 | 6 | 7 | 2 | 3 | 1 | 5 | 9 |
| p | 1.6510-3 | 1.3210-1 | 1.4710-4 | 2.6910-5 | 1.1610-1 | 9.7910-4 | 6.0210-2 | 1.0010-4 | 1.6810-5 |
| t (I1I2) | 4.86 | 1.53 | 6.24 | 4.68 | 1.53 | 7.09 | 3.77 | 5.65 | 4.36 |
| d.o.f. | 2 | 1 | 6 | 7 | 4 | 2 | 2 | 7 | 6 |
| p | 3.6210-2 | 3.3210-1 | 6.0810-4 | 2.2610-3 | 1.9510-1 | 3.1410-2 | 9.4310-2 | 9.0110-4 | 4.6710-3 |
Note. — The “E” population is excluded because it consists of only one star.