iPTF17cw: An engine-driven supernova candidate discovered independent of a gamma-ray trigger
Abstract
We present the discovery, classification, and radio-to-X-ray follow-up observations of iPTF17cw, a broad-lined (BL) type Ic supernova (SN) discovered by the intermediate Palomar Transient Factory (iPTF). Although unrelated to the gravitational wave trigger, this SN was discovered as a happy by-product of the extensive observational campaign dedicated to the follow-up of Advanced LIGO event GW170104. The spectroscopic properties and inferred peak bolometric luminosity of iPTF17cw are most similar to the gamma-ray burst (GRB) associated SN 1998bw, while the shape of the -band light curve is most similar to that of the relativistic SN 2009bb. Karl G. Jansky Very Large Array (VLA) observations of the iPTF17cw field reveal a radio counterpart times less luminous than SN 1998bw, and with peak radio luminosity comparable to that of SN 2006aj/GRB 060218 and SN 2010bh/GRB 100316D. Our radio observations of iPTF17cw imply a relativistically expanding outflow. However, further late-time observations with the VLA in its most extended configuration are needed to confirm fading of iPTF radio counterpart at all frequencies. X-ray observations carried out with Chandra reveal the presence of an X-ray counterpart with luminosity similar to that of SN 2010bh/GRB 100316D. Searching the Fermi catalog for possible -rays reveals that GRB 161228B is spatially and temporally compatible with iPTF17cw. The similarity to SN 1998bw and SN 2009bb, the radio and X-ray detections, and the potential association with GRB 161228B, all point to iPTF17cw being a new candidate member of the rare sample of optically-discovered engine-driven BL-Ic SNe associated with relativistic ejecta.
Subject headings:
supernovae: individual (iPTF17cw) — gamma-ray burst: individual (GRB 161228B) — gravitational waves1. Introduction
Almost 20 years after the discovery of an association between the radio-loud, broad-lined (BL) supernova (SN) of type Ic SN 1998bw, and the low-luminosity, long GRB 980425 (Galama et al., 1998; Kulkarni et al., 1998), we still have only a handful of GRB-associated (or engine-driven) SNe with radio light curves (Berger et al., 2003b; Soderberg et al., 2004; Frail et al., 2005; Soderberg et al., 2006b; Margutti et al., 2013; Perley et al., 2014; Singer et al., 2015). While the link between long GRBs and BL-Ic SNe is well established (Woosley & Bloom, 2006), it remains unclear what makes some BL-Ic SNe launch ultra-relativistic jets (GRBs). Radio observations are key to shed light on this open question since radio probes the fastest moving ejecta and is unaffected by beaming effects that preclude detection of X-rays and -rays from off-axis GRBs that may drive some BL-Ic SNe.
The discovery of explosions such as SN 2009bb (Soderberg et al., 2010), a relativistic BL-Ic SN without a detected GRB, has also opened the intriguing question of whether there exists a population of events with properties in between that of “ordinary” BL-Ic SNe and GRBs (ultra-relativistic jets). Radio, by being effective at probing also mildly relativistic explosions, can be used as a tool to search for these events “in the gap” (see also Ofek et al., 2007; Milisavljevic et al., 2015).
Over the last decade, the above considerations have motivated extensive searches for radio emission from type Ib/c SNe (e.g., Berger et al., 2003a; Soderberg et al., 2006a; Bietenholz et al., 2014), which have constrained the fraction of Ib/c SNe associated with GRBs to . Most of these studies, however, have long been limited by the very small number of BL-Ic SNe available to the community (Berger et al., 2003a; Chomiuk & Soderberg, 2010; Soderberg et al., 2010; Soderberg & Chomiuk, 2011; Drake et al., 2013; Kamble & Soderberg, 2013; Salas et al., 2013; Chakraborti et al., 2015; Milisavljevic et al., 2015). BL-Ic SNe are the only type of SNe observationally linked to GRBs (Woosley & Bloom, 2006), but not all BL-Ic SNe are engine-driven and in fact the number of BL-Ic SNe with relativistic ejecta discovered independently of a -ray trigger remains extremely small.
Recently, we have begun to make progress toward carrying out a systematic study of BL-Ic SNe in the radio (Corsi et al., 2011, 2014, 2016), thanks to the much-increased rate of BL-Ic discoveries enabled by the Palomar Transient Factory (PTF and its successor, the iPTF; Law et al., 2009; Rau et al., 2009). Over the course of 5 years, we have greatly enlarged the sample of BL-Ic SNe (discovered independently of a GRB trigger) with radio follow-up, and constrained the fraction of BL-Ic SNe as relativistic as (and observationally similar to) SN 1998bw to of the BL-Ic population (99.865% confidence; Corsi et al., 2016). This upper-limit is starting to approach the lower-limit of for the fraction of engine-driven BL-Ic SNe set by earlier studies by comparing BL-Ic SNe and GRB rates (Podsiadlowski et al., 2004).
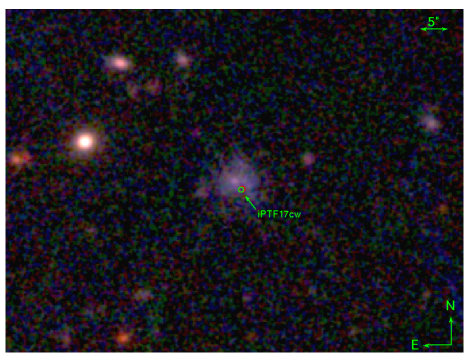
Assuming that relativistic BL-Ic SNe are of order of the total, one would expect to have a high probability of discovering at least one relativistic BL-Ic SN in a sample of BL-Ic SNe with good radio follow-up. The available sample of BL-Ic SNe with radio observations has now reached this size (Corsi et al., 2016), and here we present our first discovery for a candidate relativistic BL-Ic SN, dubbed iPTF17cw. This event was discovered by the iPTF during an extensive follow-up campaign of the Advanced LIGO event GW170104 (LIGO Scientific Collaboration & Virgo Collaboration, 2017a, b; Kasliwal et al., 2017; Kupfer et al., 2017; Corsi et al., 2017; Evans et al., 2017; LIGO Scientific Collaboration & Virgo Collaboration, 2017c). Because of the binary-black hole nature of GW170104 (Abbott et al., 2017), and given that iPTF17cw falls just outside of the localization area of GW170104 (Fig. 1), we rule out any association between iPTF17cw and GW170104.
In what follows, we describe our dataset (Section 2), analyze our multi-wavelength observations (Section 3), and show that iPTF17cw adds one more candidate to the sample of BL-Ic SNe from which we have ever detected radio emission (indicative of relativistic expansion) independent of a -ray trigger. iPTF17cw also adds one more event to the more general class of relativistic optical transients discovered independently of a high-energy trigger (Cenko et al., 2013, 2015). An after-the-fact search for -rays reveals that iPTF17cw may be associated with GRB 161228B. In our conclusion (Section 4), we stress how further late-time radio observations of the iPTF17cw field are needed to securely confirm the relativistic nature of iPTF17cw.

2. Panchromatic observations
2.1. SN optical photometry
We discovered iPTF17cw on 2017 January 7 UT in an -band image taken with the 7.8 deg2 wide camera on the Palomar Samuel Oschin 48-inch Schmidt Telescope (P48), which is routinely used by the intermediate Palomar Transient Factory (Cao et al., 2016; Law et al., 2009; Masci et al., 2017). iPTF17cw is located at and (J2000; Fig. 2), at an angular separation of from the nominal position of SDSS J090338.47+430551.6 (York et al., 2000).
At the time of discovery, iPTF17cw was visible at a magnitude of mag. The SN was not visible in a previous -band image of the field obtained on 2016 December 6 with the P48. Subsequent observations were performed with the Palomar 60-inch Telescope (P60; Cenko et al., 2006) in bands. Photometry was performed relative to the SDSS magnitudes of stars in the field, using our custom pipelines (Ofek et al., 2012; Fremling et al., 2016).
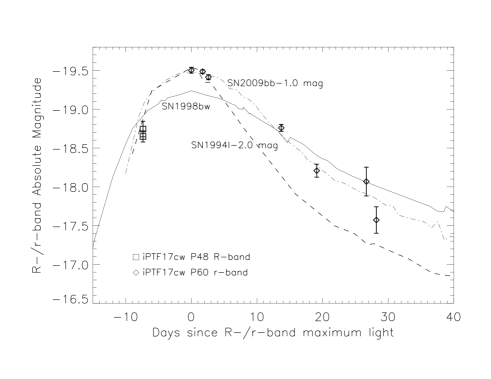
In Figure 3 we show the P48 -band and P60 -band light curves of iPTF17cw. In Table LABEL:phot_tab we report the multi-color photometry of iPTF17cw.

2.2. Spectral classification
A summary of our spectroscopic observations of iPTF17cw is reported in Table LABEL:tab:optspec.
We observed iPTF17cw with the Double Spectrograph (DBSP; Oke & Gunn, 1982) on the Palomar 5.1 m Hale telescope for 600 s beginning at 13:20 UT on 2017 January 7 (MJD 57760.555; Fig. 4, blue). The blue channel used the 600 lines/mm grating giving an effective wavelength coverage of 3085 Å to 5840 Å. The red channel used the 316 lines/mm grating, which covers the range 5200 Å to 10900 Å. The D55 dichroic was used to divide light into the two channels (50% transmission at 5500 Å). The observations used a 1 ″slit mask oriented close to the parallactic angle (Filippenko, 1982). The DBSP data were processed and optimally extracted using a custom pipeline implemented in IRAF111IRAF is distributed by the National Optical Astronomy Observatory, which is operated by the Association of Universities for Research in Astronomy (AURA) under a cooperative agreement with the National Science Foundation., python, and IDL. Background light was fit for and removed from the 2-D frames using the IDL routine bspline_itterfit.pro following the procedure described by Kelson (2003). An initial wavelength solution was found using calibration lamp observations. This solution was then adjusted based on night sky lines to account for flexture in the instrument. The flux scale was determined using observations of the standard star Feige 34 taken on the same night.
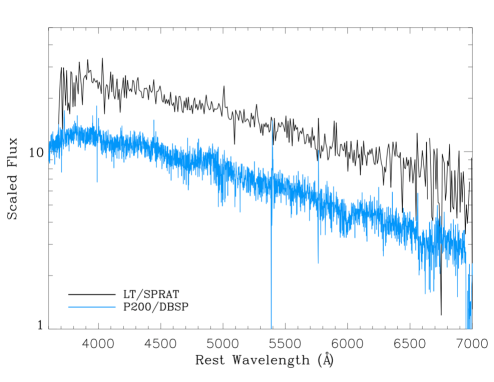
Narrow emission lines are detected at 4073 Å, 5471 Å, and 7171 Å. Identifying these as O II 3726,3728, O III 5007, and H from the host galaxy, we determine a redshift of . Aside from these narrow features, the spectra show subtle, broad features superposed on a continuum that peaks around 3800 Å in the rest frame (Fig. 4, left, blue line). Using the spectral template fitting code, superfit (Howell et al., 2006), we find that the spectrum is reasonably well matched to the BL-Ic SN 1998bw around maximum light (Fig. 4, right; see also Iwamoto et al., 1998).
An additional spectrum of iPTF17cw was obtained by combining three spectra collected around a similar epoch (2017 January 9 UT) using the SPRAT spectrograph (Piascik et al., 2014) on the 2 m robotic Liverpool Telescope. SPRAT is a long slit spectrograph with a wavelength range from 4000-8000 Å and a resolving power of at the centre of this range. These data were reduced, wavelength and flux calibrated using the automated Liverpool Telescope spectroscopic pipeline, and the combined spectrum was obtained using STARLINK/FIGARO software (Currie et al., 2014). The SPRAT spectrum of iPTF17cw is consistent with the above described P200 spectrum collected at a similar epoch (see Figure 5).
| Date | Phase | Instrument | Wavelength range | Exp. Time |
|---|---|---|---|---|
| (MJD) | (d) | (Å) | (s) | |
| 57760.555 | P200/DBSP | 3085-10900 | 600 | |
| 55762.249 | LT/SPRAT | 4000-8000 | ||
| 57785.358 | DCT/DeVeny | 3500-8000 | 600 | |
| 57811.454 | Keck I/LRIS | 3150-9400 | 1800 / 1700 |
We continued monitoring of iPTF17cw with the DeVeny spectrograph mounted on the 4.3 m Discovery Channel Telescope (DCT) in Happy Jack, Arizona. We obtained a series of 4 600 s exposures beginning at 8:36 UT on 1 February 2017 (MJD 57785.358). We employed the 300 lines mm-1 grating with a 1.5 Å slit, resulting in a spectral resolution of Å and wavelength coverage from –8000 Å. All spectra were obtained at the parallactic angle (Filippenko, 1982) and reduced in the IRAF environment using standard routines. Spectra were extracted optimally (Horne, 1986), and we performed wavelength calibration first relative to HgNeArCd arc lamps and then tweaked based on night sky lines. Extracted spectra were divided through by a smoothed flux standard to remove narrowband ( Å) instrumental effects (Bessell, 1999). Finally, telluric atmospheric absorption features were removed using the continuum from spectrophotometric standards (Wade & Horne, 1988). The resulting spectrum is shown in Figure 4 (green).
A last spectrum of iPTF17cw was taken with Keck I/LRIS instrument (Oke et al., 1995) at 10:53:39 UT on 2017 February 27 (MJD 57811.454). The instrument was configured in long slit mode, with slit and 400/3400+400/8500 grism+grating combination (dispersion of 1.09 and 1.16 Å/pixel, respectively). The total exposure time was 1800 s in the blue channel and 1700 s in the red. The resolution of the spectrum, as measured from the O I 5577 Å line is of 9.6 Å ( km/s). The data were reduced using a custom developed pipeline in IDL, LPIPE. The standard stars Feige34 and Feige67 were used for flux calibration and correction for telluric lines. This spectrum is show in Figure 4 (red).
2.3. Radio follow-up
Radio observations of the iPTF17cw field were carried out with the Karl G. Jansky Very Large Array222The National Radio Astronomy Observatory is a facility of the National Science Foundation operated under cooperative agreement by Associated Universities, Inc. (VLA) in its A, AnD, and D configurations, under our target of opportunity program333VLA/16B-043; PI: A. Corsi.. Our first observation was carried out in C-band (nominal central frequency of GHz) on 2017 January 13 (approximately 6 d since discovery). VLA follow-up observations were continued for up to about three months since optical discovery. We used J0920+4441 as our phase calibrator, 3C48 or 3C286 as flux / bandpass calibrators. VLA data were reduced and calibrated using using the VLA automated calibration pipeline which runs in the Common Astronomy Software Applications package (CASA; McMullin et al., 2007). When necessary, additional flags were applied after visual inspection of the data. Images of the observed field were formed using the CLEAN algorithm (Högbom, 1974), which we ran in interactive mode. The results of our VLA follow-up campaign of iPTF17cw are reported in Table LABEL:radioTab. Flux measurement errors are calculated as the quadratic sum of the map rms, plus a 5% fractional error on the measured flux which accounts for inaccuracies of the flux density calibration.
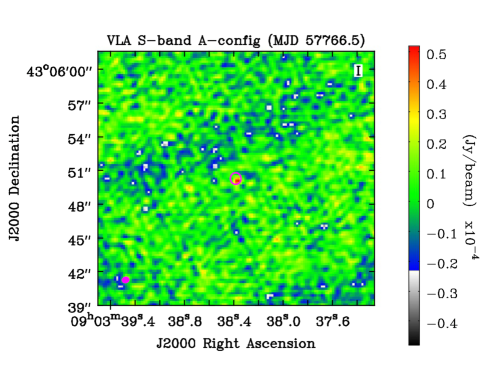
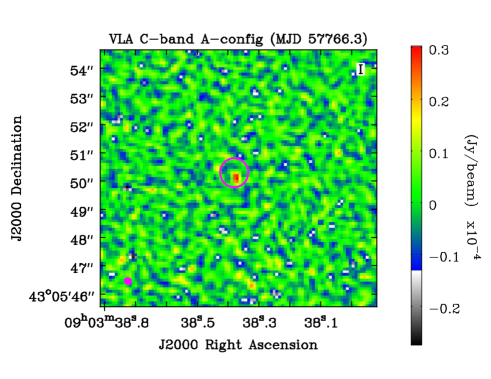
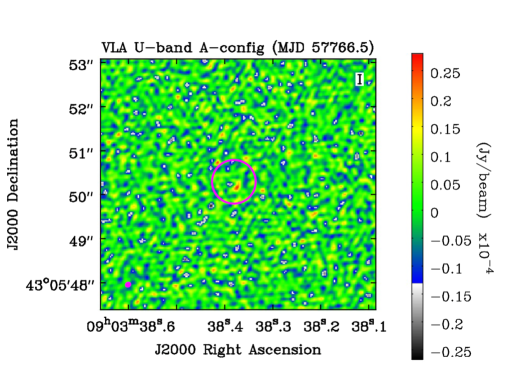

A faint radio source was detected at a location compatible with the optical position of iPTF17cw, at a level during our first observation at GHz. The source appears to be point-like with the VLA in its A configuration (nominal FWHP at 6 GHz of ″), thus a contribution from star formation in the underlying host galaxy is unlikely. The positional offset with respect to the reddish central concentration of the iPTF17cw host galaxy (Fig. 2) also makes a contribution from a low-level AGN unlikely. In Figure 6 we show the VLA images of the iPTF17cw radio counterpart collected during our first multi-band observation of this source.
Over the first three C-band epochs, which cover a time interval of days, the source radio flux at GHz shows marginal evidence ( level) for variability suggesting a decay of the radio flux with time ( with when is set equal to the trigger time of GRB 161228B; see Section 2.5), perhaps followed by what appears to be a flattening or re-brightening of the 6 GHz emission (Fig. 7, top). Due to the change of the VLA configuration and to the presence of a bright QSO in the field, our latest VLA image of the iPTF17cw field at 6 GHz is substantially degraded (the image is dynamic range limited) and resulted in a non detection.
The candidate radio counterpart to iPTF17cw was also detected at the level at 2.8 GHz and 14 GHz. The observations at such frequencies do not show evidence for substantial variability over the first two months of observations, but our last observation at 14 GHz shows that the radio counterpart to iPTF17cw has faded below our detection level.
2.4. X-ray observations
The Swift satellite (Gehrels et al., 2005) observed the location of iPTF17cw on two epochs, beginning at 13:48 UT on 13 January 2017, and 00:35 UT on 18 January 2017. These observations were obtained as part of our approved target of opportunity program444Swift Cycle 12 GI; PI: A. Corsi. We analyzed the data obtained by the on-board X-Ray Telescope (XRT; Burrows et al., 2005) during these two epochs (1.4 and 7.5 ks of exposure time, respectively) using the procedures outlined in Evans et al. (2009). No X-ray emission was detected at the location of iPTF17cw. We place upper limits on the 0.3–10 keV count rate of and count s-1 in these two epochs. For a power-law spectrum with a photon index of and a Galactic HI column density of cm-2 (Dickey & Lockman, 1990), these correspond to (3) limits on the 0.3–10 keV (unabsorbed) X-ray flux of and erg cm-2 s-1, respectively.
We also observed the location of iPTF17cw with the Advanced CCD Imaging Spectrometer (ACIS) on the Chandra X-ray Observatory555Program ID: #17508570; PI: Corsi beginning at 9:22 UT on 8 February 2017. The source location was positioned on the S3 chip and the detector data was telemetered in “faint” mode. An effective exposure time of 9.86 ks was obtained on source. We detect a total of 5 photons within 1″ (radius) of the position of iPTF17cw. While not sufficient for any spectral analysis, we can claim a detection at the confidence level (expected number of background counts: 0.89).
The position of the iPTF17cw X-ray counterpart as seen by Chandra is and (J2000), with an estimated (90% confidence) error radius of (dominated by Chandra pointing errors). This position is compatible with both the optical position of iPTF17cw, and the position of its radio counterpart (see Fig. 2).
Properly accounting for the on-axis point-spread function we measure a 0.5–7.0 keV count rate of count s-1 (90% confidence interval). Adopting a power-law spectral model with photon index and cm-2 (Dickey & Lockman, 1990), this corresponds to an unabsorbed X-ray flux in this bandpass of erg cm-2 s-1, or an X-ray luminosity of erg s-1 (Fig. 7, bottom).
2.5. Search for -rays
We searched the Fermi and Swift catalogs for potential GRBs detected within a month prior to the iPTF discovery of iPTF17cw, and with position compatible with that of iPTF17cw. We found a match with GRB 161228B (Fig. 8), which was observed by Fermi/GBM as trigger #504623745666https://gcn.gsfc.nasa.gov/other/504623745.fermi on 28 December 2016, at 13:15:41.85 UT (MJD 57750.552). This GRB was also detected by POLAR and Integral (Marcinkowski et al., 2016).
GRB 161228B, as observed by Fermi/GBM, appears to be approximately 30 s in duration. Utilizing the position of iPTF17cw for the GBM detector responses, we performed a time-integrated spectral analysis starting at about 1 s before the GBM trigger time and extending to 30 s after trigger time. The data are well fit by a Band function (defined as in Gruber et al., 2014) with the following parameter values: keV; low-energy power-law index, ; and high-energy power-law index, . The derived fluence from this spectral fit in the typical GBM reporting band of 10-1000 keV is erg cm-2. Additionally, we analyzed the brightest 1 s interval of data for this GRB to estimate the peak flux. The high-energy power-law index of the Band function could not be adequately constrained for this interval, however, a power-law with an exponential cutoff could be reasonably constrained with parameter values of keV and power-law index, . The 1 s peak flux is then estimated to be erg s-1 cm-2.
3. Multi-wavelength analysis
3.1. Photometric properties
To compare the intrinsic peak luminosity of iPTF17cw with that of other GRB-associated SNe, we use our photometry from P60 and the prescriptions of Lyman et al. (2014) for transforming optical light curves of stripped-envelope core-collapse SNe to full bolometric light curves. We define the full bolometric correction in -band as (Lyman et al., 2014):
| (1) |
where
| (2) |
In the above relation, mag and erg s-1.
Following Lyman et al. (2014), we express as a function of or colors. For stripped-envelope core-collapse SNe, the best-fit relations between colors and bolometric corrections give:
| (3) | |||
| (4) |
To derive iPTF17cw color, we correct our photometry for Galactic extinction toward the position of iPTF17cw ( mag which, assuming an extinction to reddening ratio , implies mag, mag, mag; Schlafly & Finkbeiner, 2011). This yields -band extinction-corrected magnitudes of iPTF17cw at the time of -band peak of mag, mag, and mag, respectively (see Table LABEL:phot_tab). Using these into Equations (3)-(4), we get two values of the bolometric correction at peak that averaged out yield mag. We stress that this is a tentative estimate of the bolometric correction based on the results of Lyman et al. (2014) from best-fit relations between colors and bolometric corrections for a population of stripped-envelope core-collapse SNe.
From Equation (1) we derive which implies erg s-1. This is comparable to the bolometric luminosity of the engine-driven SN 1998bw, for which erg s-1 (see Table 3 in Clocchiatti et al., 2011). Applying k-corrections and host extinction corrections based on colors, we get that iPTF17cw is, in term of optical brightness, among the top of the iPTF BL-Ic SN sample (Taddia et al., 2017).
From the bolometric peak luminosity we can estimate the amount of 56Ni in the explosion, via the relation (e.g., Arnett, 1982; Lyman et al., 2016):
| (5) |
which yields for iPTF17cw, comparable to the literature values range of for SN 1998bw, and somewhat higher than estimated for SN 2009bb (see Table 5 in Lyman et al., 2016).
As evident from Figure 3, the -band light curve shape of iPTF17cw is more similar to that of SN 2009bb (Pignata et al., 2011) than to that of SN 1998bw. The light curve shape is related to the characteristic timescale scale (e.g., Arnett, 1982; Lyman et al., 2016):
| (6) |
where is the ejecta mass, is the kinetic energy, and where we have assumed on opacity of cm2 g-1. For SN 2009bb, d (Lyman et al., 2016), and given the similarity with the light curve of iPTF17cw, we derive for the last:
| (7) |
3.2. Spectroscopic properties
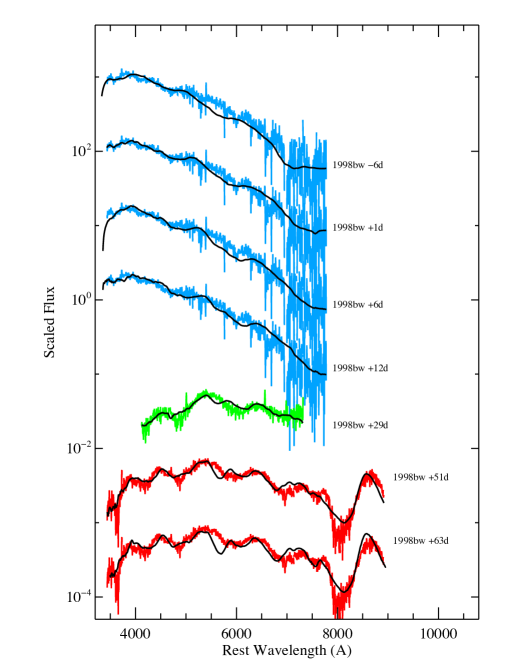
In Figure 4 (right) we show the DBSP spectrum of iPTF17cw (see Section 2.2) collected on MJD 57760.555 (at a phase of d since - and -band maximum light), compared to SN 1998bw spectra at several phases since maximum light. The SN 1998bw spectra shown in this Figure have been “de-reddened” significantly to match the iPTF17cw spectrum and to account for the much bluer continuum of iPTF17cw at early times. The iPTF17cw DBSP spectrum was corrected for host galaxy contribution (a host galaxy light template was estimated using Superfit and then subtracted to the iPTF17cw spectrum). A comparison of the spectra shown in the left and right panels of Figure 4 gives an idea of the effects of these corrections.
In Figure 4 (right) we also show the DCT and Keck/LRIS spectra of iPTF17cw taken on MJD 57785.358 ( d after - and -band maximum light; see Section 2.2) and on MJD 57811.454 ( d after - and -band maximum light; see Section 2.2), respectively, compared to SN 1998bw. Also in this case we have subtracted host galaxy light from the iPTF17cw spectrum. The amount of de-reddening used to match the SN 1998bw spectra to that of iPTF17cw is significantly less than what needed for the earlier comparison described above, thus indicating that iPTF17cw had colors more similar to SN 1998bw at this later phase.
Based on the above comparisons, we can reasonably estimate the iPTF17cw photospheric velocity around maximum light to be similar to that of SN 1998bw, km s-1 (see Lyman et al., 2016, and references therein). We note that if we assume that the minimum observed around 6600 Å in the DCT spectrum is due to the Si 6355 Å line, the estimated velocity is of km s-1 at since maximum light.
We thus set (see e.g. Eq. 2 in Lyman et al., 2016):
| (8) |
which implies:
| (9) |
Combining the above Equation with equation (7), we get for iPTF17cw:
| (10) | |||
| (11) |
These values are comparable to and erg found for SN 2009bb (see Table 5 in Lyman et al., 2016), while SN 1998bw had a larger ejecta mass and kinetic energy ( and erg).
3.3. Association with GRB 161228B
The results from the spectral fits of GRB 161228B described in Section 2.5 imply that GRB1̇61228B is a “typical” GRB in terms of Band function parameters of GBM-detected long GRBs, with values of , peak flux, and fluence in the th percentile (Gruber et al., 2014). If we assume that GRB 161228B and iPTF17cw are indeed associated, as suggested by the compatibility of localizations and trigger/discovery time (see Section 2.5), we can use the redshift of iPTF17cw to calculate the k-corrected energy release and peak luminosity of GRB 161228B over the 1 keV-10 MeV band. The derived isotropic-equivalent energy release in -rays, , is erg and the peak luminosity, , is erg s-1. These values are at least one order of magnitude lower than the average observed and values of long GRBs. In fact, we estimate that these values are within the 1st percentile of long GRBs observed by GBM (Gruber et al., 2014). Although we find that the energy and luminosity are not as low as for GRB 980425, our results for GRB 161228B are consistent with the observations of other type SN-associated GRBs such as GRB 031203 (Soderberg et al., 2004) and GRB 120422A (Melandri et al., 2012). We stress, in particular, the similarity with GRB 031203, which also appeared to be an event with spectrum similar to cosmological GRBs, but with a much lower isotropic energy release (Sazonov et al., 2004).
We estimate the probability of a chance coincidence between GRB 161228B and iPTF17cw by calculating the rate of Fermi GRBs falling in a random patch of sky (as large as the region of GRB 161228B localization; see Fig. 8). This rate is per month, after taking into account the combined statistical and systematic localization uncertainties. Thus, a chance coincidence between iPTF17cw and GRB 161228B within a month time window has a probability of .
In order to further test the compatibility of GRB 161228B explosion time with that of iPTF17cw, we fit the -band light curve of SN 1998bw to the (k-corrected) -band light curve of iPTF17cw (for more details, see Taddia et al., 2017). In the fitting process, we allow the light curve of SN 1998bw to be stretched in time and shifted in magnitude, until we minimize the residuals of the difference between the stretched SN 1998bw light curve and the light curve of iPTF17cw. This fitting procedure is similar to that outlined in Cano (2013) and takes advantage of the known explosion epoch of SN 1998bw. We obtain a good fit at an explosion epoch corresponding to MJD 57752, which is not incompatible with the trigger time of GRB 161228B.
We conclude that the association between iPTF17cw and GRB161228B is plausible. In what follows, we thus set the explosion time of iPTF17cw to be the trigger time of GRB 161228B (MJD 57750.552).
3.4. Properties of the fastest (radio-emitting) ejecta
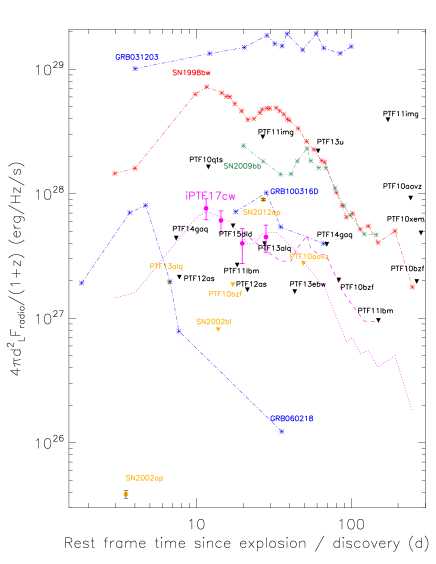
The temporal evolution of the candidate radio counterpart to iPTF17cw is shown in Figure 7 and Figure 9. In these Figures, we set the time of explosion to the trigger time of GRB 161228B. As evident from Figure 7, the 6 GHz luminosity of iPTF17cw is smaller than GRB 980425/SN 1998bw, and smaller than the relativistic SN 2009bb. The GHz radio luminosity of iPTF17cw is orders of magnitudes below the typical radio emission from cosmological GRBs (e.g., Chandra et al., 2012), but it is not incompatible with the radio emission observed from low-luminosity GRBs such as GRB 060218/SN 2006j and GRB 100316D/SN 2010bh. The radio spectral energy distribution suggests an optically thin spectrum around MJD 57766 ( d since GRB 161228B). However, the measurements errors are large. Using the VLA multi-band observations collected around MJD 57766, we estimate a 2.8-14 GHz spectral index () of around this epoch.
In Figure 9 we show the 2.8 GHz to 14 GHz radio light curves of iPTF17cw compared to the radio light curves of SN 1998bw at similar frequencies (solid lines), all scaled by a factor of in intrinsic luminosity to match the lower intrinsic luminosity of iPTF17cw (see Fig. 7). Given the large distance to iPTF17cw, our radio measurements are affected by large errors. Thus, in what follows, we do not attempt a detailed modeling of iPTF17cw radio emission, but rather provide orders-of-magnitude estimates of the key properties of its radio emitting ejecta, based on comparisons with other radio SNe.
The 6 GHz radio emission of iPTF17cw is qualitatively compatible with the double-peaked light curve of SN 1998bw, within the large measurement errors. However, a slower-evolving or later-peaking second radio peak, perhaps more similar to the one observed for SN 2009bb at 5 GHz (dash-dotted lines), would be needed to account for the flat temporal behavior of the iPTF17cw counterpart at 14 GHz. For what concerns the emission at 2.8 GHz, we note that SN 1998bw emission was suppressed by synchrotron self-absorption (SSA) at the lower frequencies until d since explosion (magenta solid line in Fig. 9). Indeed, if we extrapolate the (scaled) 5 GHz light curve of SN 1998bw to our other frequencies of interest (2.8 GHz and 14 GHz) using an optically thin spectral index of (dashed lines in Fig. 9), we see that this extrapolation agrees well with the actual (scaled) light curves of SN 1998bw at 14 GHz (blue solid line), while at 2.8 GHz the agreement is good only at d (magenta dashed and solid lines). iPTF17cw radio emission, on the other hand, appears to be optically thin at all frequencies GHz already at d since explosion. In fact, the 2.8 GHz emission of iPTF17cw is compatible with the optically-thin extrapolation to 2.8 GHz of the (scaled) 5 GHz light curve of SN 1998bw (magenta dashed line in Fig. 9). This, together with the fact that iPTF17cw emission appears to decrease with time at 6.2 GHz over the first three epochs, suggests that the SSA peak frequency is GHz at d since explosion (GRB 161228B), and thus Jy (or erg s-1 Hz-1 at the distance of iPTF17cw).
The above constraints on the SSA peak frequency and flux enable us to estimate the size of the radio emitting material at d since explosions. Using Eq. (11) of Chevalier (1998):
| (12) |
where is the ratio of relativistic electron energy density to magnetic energy density, is the flux at the time of SSA peak, is the SSA frequency, and where we have parametrized with the thickness of the radiating electron shell and we assumed for the power-law index of the electron energy distribution. Setting in the above Equation Jy and GHz, we get cm at 16 d since explosion, which implies that the velocity of the radio ejecta is 777A more precise calculation for iPTF17cw radio ejecta speed is obtained by considering the transverse shock speed constraint , which implies or ., similarly to what found for SN 2009bb (Soderberg et al., 2010).
The magnetic field can be expressed as (see Eq. (12) in Chevalier, 1998):
| (13) |
where we have set . The above gives G at d, for , Jy, and GHz.
Hereafter, we continue our discussion of the properties of the radio-emitting region of iPTFcw using a simple radiation model that neglects the dynamics (evolution of the radius , magnetic field , and minimum Lorentz factor of the accelerated electrons with time), and relativistic effects related to the high ejecta velocity. Based on the analysis of SN 1998bw by Li & Chevalier (1999), we expect the corrections caused by dynamical and relativistic effects to be relatively modest, so that our estimates below are likely within a factor of of the values that would be derived via a more detailed modeling.
For a SN shock expanding in a circumstellar medium (CSM) of density:
| (14) |
assuming that a fraction of the energy density goes into magnetic fields, one can write (see Equation (8) in Chevalier & Fransson, 2006):
| (15) |
From the above we get , or , for and using the values of the shock radius and shock speed found previously. The total energy coupled to the fastest (radio emitting) ejecta around d can be expressed as:
| (16) |
which yields erg for and using the value of the magnetic field found above. This energy is of the total kinetic energy of the ejecta estimated via optical photometry (see Equation 11).
The values of energy and CSM density found for iPTF17cw can be compared with and erg estimated for SN 1998bw by (Li & Chevalier, 1999), with and erg estimated for SN 2009bb (Soderberg et al., 2010), and with with and erg estimated for GRB 100316D (Margutti et al., 2013).
We finally note that because of the potential association with GRB 161228B, the early-time evolution of the radio (and X-ray counterparts) to iPTF17cw may be better described by that of a relativistic outflow originally aspherical. In this scenario, the relativistic ejecta are detached from the freely expanding SN outflow, decelerate, spread sideways, and become spherical on a timescale of order (Waxman, 2004). The last is smaller than the timescale of the earliest of our 2.8 GHz observations of iPTF17cw for . So our discussion (which assumes a spherical blastwave) is self-consistent for .
3.5. Radio interpretation caveats
Because of the relatively large distance to iPTF17cw ( Mpc), our most significant radio detections of this SN are at the level. Thus, our radio measurements are affected by large errors, and so are the constraints on the spectral and temporal properties of the radio emission. Although iPTF17cw 14 GHz counterpart has faded below detection level over the course of our follow-up, further VLA observations (in A configuration, so as to reach better sensitivity and angular resolution) are needed to confirm fading at the lower frequencies. We were not able to carry out these observations due to the fact that the VLA moved to its most compact configuration (D config) over the course of our follow-up campaign. Because our conclusion that iPTF17cw is a relativistic event relies heavily on our first measurement at 2.8 GHz, hereafter we consider several factors that could contaminate the 2.8 GHz flux.
In order to estimate what might be the contribution of background star formation to the measured 2.8 GHz flux of iPTF17cw, pre-supernova photometry of the host galaxy was downloaded from the Sloan Digital Sky Survey (SDSS; Alam et al. 2015), the Galaxy Evolution Explorer (GALEX; Martin et al. 2005), and the Wide-field Infrared Survey Explorer (WISE; Cutri et al. 2013); we also obtained images of the field from Pan-STARRS (Chambers et al., 2016) and performed aperture photometry of the host galaxy. We then performed a simple SED fit using the Bruzual & Charlot (2003) stellar-population synthesis models and custom IDL software previously described in Perley et al. (2013). We infer a total stellar mass of () and a star-formation rate (averaged over the past 50 Myr) of M⊙ yr-1, with no significant dust extinction. We note that these properties are quite similar to the LMC and to other GRB hosts at low redshift (e.g., Perley et al., 2016, and references therein). The host galaxy of iPTF17cw also shows a reddish concentration at its center, which could be a bulge or weak AGN. This level of star formation implies a total 1.4 GHz spectral luminosity of order (Murphy et al., 2011):
| (17) |
for the host galaxy of iPTFcw. Spectral indices of star-forming galaxies between 1.4 and 4.8 GHz are estimated to be in the range to (Seymour et al., 2008). Thus, we estimate the total radio emission from the host to be erg s-1 Hz-1 at 2.8 GHz. Our first 2.8 GHz observation of iPTF17cw implies a radio luminosity of erg -1 Hz-1 concentrated in a compact region of FWHP size ″, much smaller than the -band size of the host galaxy (see Fig. 2). We thus consider a high level of contamination to the iPTF17cw radio counterpart from star formation in the host unlikely. Contamination from a compact radio source, i.e. an AGN, seems unlikely considering the fact that the optical, radio, and X-ray counterparts to iPTF17cw appear to be coincident and significantly offset from the host nucleus. Confirming fading of the radio counterpart of iPTF17cw at 2.8 GHz in future observations will strengthen this conclusion.
We also explore possible effects related to interstellar scattering and scintillation (ISS). At the galactic coordinates of iPTF17cw ( and ) the ISS transition frequency between the strong and weak scattering regimes is GHz, and the Fresnel angle at the transition frequency is as (Goodman, 1997; Walker, 2001). This is implies that our lowest frequency observations are in the strong scattering regime. The modulation index in the refractive strong scattering reads:
| (18) | |||
| (19) |
where and is the source size. From the above, we see that the largest modulation index at 2.8 GHz is for a source of size as.
To estimate whether ISS could conspire to invalidate our assumption of optically thin emission at 2.8 GHz at 16 d since explosion, we calculate the modulation index that would be needed to enhance potentially optically thick emission at 2.8 GHz to a level comparable to the one observed at day 16 (so that the GHz emission would appear optically thin, while being optically thick in reality):
| (20) |
where Jy at day 16 (see Chevalier, 1998, for the 1.5 correction factor applied here); is the measured flux at 2.8 GHz on day 16, and is its measurement error. We get , which is larger than the largest possible modulation index at 2.8 GHz .
We thus conclude that iPTF17cw is a plausible relativistic SN candidate. However, we stress once again that re-observing the iPTF17cw field when the VLA will be back in its most extended configuration (March 2018), and confirming that the iPTF17cw radio counterpart has indeed faded below detection threshold at all frequencies (not only at 14 GHz, which we have already verified), will greatly help enhance the confidence in this interpretation.
3.6. X-ray emission modeling
Our Chandra detection of iPTF17cw around day 40 since GRB 161228B implies an X-ray luminosity of erg s-1, which is within the range observed at a similar epoch for the low-luminosity GRBs 980425 and 031203, most similar to the X-ray luminosity of GRB 100316D (Fig. 7, bottom), larger than the X-ray luminosity of SN 2009bb at a similar epoch (Soderberg et al., 2010), and above the X-ray luminosity upper-limit of erg s-1 set by Chandra observations of SN 2012ap (Margutti et al., 2014). Because the radio luminosity of iPTF17cw is smaller than that of GRB 980425 and GRB 031203 (see Fig. 7), the comparable X-ray luminosity implies an flatter spectral index between the radio and X-ray bands. This is not unseen and links iPTF17cw to the low-luminosity GRBs 060218 and 100316D for which an unusually flat radio-to-X-ray spectral index was also observed (see Margutti et al., 2013, for a discussion).
From the ratio of the radio-to-X-ray (monochromatic) fluxes measured at the time of the Chandra observation ( erg cm-2 s-1 keV-1), we derive , which is compatible with the spectral index measured in the radio band, within the large errors (see Section 3.4). (We note that the extrapolation of the measured radio flux to the optical band with a similar spectral index yields an optical flux well below the one measured from iPTF17cw optical SN light curve.) The fact that the X-ray emission lies on the extrapolation from the radio band suggests a common origin of the radio and X-rays, likely non-thermal synchrotron emission from the shocked CSM, which is usually invoked in GRB afterglows and in several radio and X-ray emitting core-collapse SNe (Chevalier & Fransson, 2006). We note, however, that because of the large errors that affect our radio spectral index measurement, and because of the lack of a spectral index measurement in the X-rays, we cannot exclude that, similarly to GRB 100316D, the X-ray emission from iPTF17cw may be related to a different emission component (such as inverse Compton or prolonged central engine activity).
Within the synchrotron scenario, we can constrain the synchrotron cooling frequency to be keV for iPTF17cw, due to the apparent lack of a spectral steepening between the radio and X-rays. Using Equation (11) of Chevalier & Fransson (2006) (where we correct the normalization constant, erroneously reported there as GHz to Hz):
| (21) |
From the above it is evident that keV would require an unusually low value of . The lack of a spectral steepening at high frequencies is common to several other SN including the radio-loud BL-Ic PTF11qcj (Corsi et al., 2014), SN 2009bb, and SN 1998bw, and may be explained by invoking a cosmic-ray dominated SN shock (Ellison et al., 2000; Chevalier & Fransson, 2006).
We consider in what follows other possible sources of X-rays generally invoked in the study of stripped-envelope core-collapse SNe (Chevalier & Fransson, 2006), such as thermal emission associated with the shock-heated ejecta, and inverse Compton (IC) up-scattering of optical photons by radio-emitting electrons.
As discussed in Corsi et al. (2014), within the thermal emission hypothesis, X-rays are produced while the forward shock plows into the CSM and /or by the reverse shock heating the ejecta. Thus, the X-ray luminosity depends on the density of the emitting material, which cools by free-free emission. Because the X-ray luminosity is directly proportional to the square of the mass-loss rate (see e.g. Eq. (16) in Corsi et al., 2014), for an event like iPTF17cw () we don’t expect free-free emission to be the dominant contributor to the iPTF17cw X-ray counterpart detected by Chandra.
The IC mechanism is expected to be most important on timescales comparable to the optical SN maximum, since the ratio of flux measured in the radio and X-ray bands is given by:
| (22) |
where is the energy density in up-scattered photons, which can be estimated as (Björnsson & Fransson, 2004; Soderberg et al., 2006a):
| (23) |
For iPTF17cw, even setting to its peak value of erg s-1 (at d since GRB 161228B), and using v (see Section 3.4), we estimate erg cm-3. From our radio observations, we also derive erg cm-2 s-1. Setting G based on what we derived in Section 3.4 and assuming a typical evolution of the magnetic field (Chevalier, 1998), we derive the conservative upper-limit:
| (24) |
which is a factor of below the X-ray flux measured by Chandra at d since GRB 161228B.
We thus conclude that a synchrotron origin from a cosmic-ray dominated shock is a more likely scenario for the radio and X-ray emission of iPTF17cw. However (as discussed above) we cannot exclude other mechanisms for the origin of the X-ray emission, such as long-lasting activity of the explosion central engine (e.g., a black hole plus torus system, or a magnetar progenitor; Margutti et al., 2013). Modeling of iPTF17cw emission within these more complex scenarios is (given our limited dataset) beyond the scope of this paper.
4. Summary and conclusion
We have presented the discovery, classification, and radio-to-X-ray follow-up observations of iPTF17cw, a BL-Ic SN discovered by the iPTF while carrying out an extensive follow-up campaign of the (unrelated) Advanced LIGO event GW170104. iPTF17cw spectroscopic and photometric properties show similarities with the engine-driven SN 1998bw and the relativistic SN 2009bb. We estimate a Nickel mass similar to that of SN 1998bw, while the total energy of the ejecta and ejecta mass are more similar to that of SN 2009bb.
Our radio data suggest that iPTF17cw is a new member of the rare sample of relativistic SNe discovered independently of a -ray trigger. Given the temporal and spatial compatibility of iPTF17cw with GRB 161228B, we also consider iPTF17cw a potential new member of the limited sample of GRB-associated (engine-driven) BL-Ic SNe. We caution, however, that our radio observations are affected by large errors (given the large distance to iPTF17cw). Thus, further late-time VLA follow-up observations with high resolution are warranted to confirm the relativistic nature of iPTF17cw.
Radio-to-X-ray follow-up observations of iPTF17cw enabled us to estimate the properties of the fastest moving ejecta and of the CSM. The radio luminosity of iPTF17cw is times smaller that SN 1998bw, but comparable to that of GRB 100316D. The fraction of energy coupled to the fastest emitting material is times smaller than in SN 1998bw, while the CSM density around iPTF17cw is similar to that found around other relativistic BL-Ic SNe such as SN 2009bb, and consistent with values inferred for long GRBs. The relatively bright X-ray emission is compatible with the extrapolation from the radio band within a synchrotron emission scenario, and the implied X-ray luminosity is most similar to that of GRB 100316D.
Thanks to the much increased rate of iPTF discoveries of BL-Ic SNe, we have just now begun to observationally constrain the fraction of BL-Ic SNe that may be powered by central engines. Considering the size of the sample of BL-Ic SNe with radio observations we have collected so far, the discovery of iPTF17cw independently of a -ray trigger fits our expectations for (Corsi et al., 2016; Podsiadlowski et al., 2004). This result also demonstrates that our discovery rate of engine-driven BL-Ic is likely to be substantially boosted by the advent of the Zwicky Transient Facility (ZTF; Smith et al., 2014; Bellm, 2016). In the ZTF era, we expect to collect in one year a sample of BL-Ic SNe with radio observations as large as the one we collected with the iPTF in five years, and the discovery of events like iPTF17cw will be greatly facilitated.
References
- Abbott et al. (2017) Abbott, B., Abbott, R., Abbott, T., et al. 2017, Phys. Rev. Lett., 118, 221101
- Alam et al. (2015) Alam, S., Albareti, F. D., Allende Prieto, C., et al. 2015, ApJS, 219, 12
- Arnett (1982) Arnett, W. D. 1982, ApJ, 253, 785
- Bellm (2016) Bellm, E. C. 2016, Publications of the Astronomical Society of the Pacific, 128, 084501. http://stacks.iop.org/1538-3873/128/i=966/a=084501
- Berger et al. (2003a) Berger, E., Kulkarni, S. R., Frail, D. A., & Soderberg, A. M. 2003a, Astrophys. J., 599, 408
- Berger et al. (2003b) Berger, E., Kulkarni, S. R., Pooley, G., et al. 2003b, Nature, 426, 154
- Bessell (1999) Bessell, M. S. 1999, PASP, 111, 1426
- Bietenholz et al. (2014) Bietenholz, M. F., De Colle, F., Granot, J., Bartel, N., & Soderberg, A. M. 2014, MNRAS, 440, 821
- Björnsson & Fransson (2004) Björnsson, C.-I., & Fransson, C. 2004, ApJ, 605, 823
- Bruzual & Charlot (2003) Bruzual, G., & Charlot, S. 2003, MNRAS, 344, 1000
- Burrows et al. (2005) Burrows, D. N., Hill, J. E., Nousek, J. A., et al. 2005, Space Sci. Rev., 120, 165
- Campana et al. (2006) Campana, S., Mangano, V., Blustin, A. J., et al. 2006, Nature, 442, 1008
- Cano (2013) Cano, Z. 2013, MNRAS, 434, 1098
- Cao et al. (2016) Cao, Y., Nugent, P. E., & Kasliwal, M. M. 2016, PASP, 128, 114502
- Cenko et al. (2006) Cenko, S. B., Fox, D. B., Moon, D., et al. 2006, Publications of the Astronomical Society of the Pacific, 118, 1396. http://stacks.iop.org/1538-3873/118/i=848/a=1396
- Cenko et al. (2013) Cenko, S. B., Kulkarni, S. R., Horesh, A., et al. 2013, ApJ, 769, 130
- Cenko et al. (2015) Cenko, S. B., Urban, A. L., Perley, D. A., et al. 2015, ApJ, 803, L24
- Chakraborti et al. (2015) Chakraborti, S., Soderberg, A., Chomiuk, L., et al. 2015, ApJ, 805, 187
- Chambers et al. (2016) Chambers, K. C., Magnier, E. A., Metcalfe, N., et al. 2016, ArXiv e-prints, arXiv:1612.05560
- Chandra et al. (2012) Chandra, P., Chevalier, R. A., Chugai, N., et al. 2012, Astrophys. J., 755, 110
- Chevalier (1998) Chevalier, R. A. 1998, Astrophys. J., 499, 810
- Chevalier & Fransson (2006) Chevalier, R. A., & Fransson, C. 2006, Astrophys. J., 651, 381
- Chomiuk & Soderberg (2010) Chomiuk, L., & Soderberg, A. 2010, The Astronomer’s Telegram, 2483, 1
- Clocchiatti et al. (2011) Clocchiatti, A., Suntzeff, N. B., Covarrubias, R., & Candia, P. 2011, AJ, 141, 163
- Corsi et al. (2017) Corsi, A., Kasliwal, M., Cenko, S., Frail, D., et al. 2017, LIGO-Virgo GRB Coordinate Network Circular, 20428
- Corsi et al. (2011) Corsi, A., Ofek, E. O., Frail, D. A., et al. 2011, ApJ, 741, 76
- Corsi et al. (2014) Corsi, A., Ofek, E. O., Gal-Yam, A., et al. 2014, ApJ, 782, 42
- Corsi et al. (2016) Corsi, A., Gal-Yam, A., Kulkarni, S. R., et al. 2016, ApJ, 830, 42
- Currie et al. (2014) Currie, M. J., Berry, D. S., Jenness, T., et al. 2014, in Astronomical Society of the Pacific Conference Series, Vol. 485, Astronomical Data Analysis Software and Systems XXIII, ed. N. Manset & P. Forshay, 391
- Cutri et al. (2013) Cutri, R. M., Wright, E. L., Conrow, T., et al. 2013, VizieR Online Data Catalog, 2328
- Dickey & Lockman (1990) Dickey, J. M., & Lockman, F. J. 1990, ARA&A, 28, 215
- Drake et al. (2013) Drake, A. J., Djorgovski, S. G., Mahabal, A. A., et al. 2013, The Astronomer’s Telegram, 4984, 1
- Ellison et al. (2000) Ellison, D. C., Berezhko, E. G., & Baring, M. G. 2000, Astrophys. J., 540, 292
- Evans et al. (2017) Evans, P., Corsi, A., Kennea, J., et al. 2017, LIGO-Virgo GRB Coordinate Network Circular, 20473
- Evans et al. (2009) Evans, P. A., Beardmore, A. P., Page, K. L., et al. 2009, MNRAS, 397, 1177
- Filippenko (1982) Filippenko, A. V. 1982, PASP, 94, 715
- Frail et al. (2005) Frail, D. A., Soderberg, A. M., Kulkarni, S. R., et al. 2005, ApJ, 619, 994
- Fremling et al. (2016) Fremling, C., Sollerman, J., Taddia, F., et al. 2016, A&A, 593, A68
- Galama et al. (1998) Galama, T. J., Vreeswijk, P. M., van Paradijs, J., et al. 1998, Nature, 395, 670
- Gehrels et al. (2005) Gehrels, N., Chincarini, G., Giommi, P., et al. 2005, ApJ, 621, 558
- Goodman (1997) Goodman, J. 1997, NewA, 2, 449
- Gruber et al. (2014) Gruber, D., Goldstein, A., Weller von Ahlefeld, V., et al. 2014, ApJS, 211, 12
- Högbom (1974) Högbom, J. A. 1974, A&AS, 15, 417
- Horne (1986) Horne, K. 1986, PASP, 98, 609
- Howell et al. (2006) Howell, D. A., Sullivan, M., Nugent, P. E., et al. 2006, Nature, 443, 308
- Iwamoto et al. (1998) Iwamoto, K., Mazzali, P. A., Nomoto, K., et al. 1998, Nature, 395, 672
- Kaiser et al. (2010) Kaiser, N., Burgett, W., Chambers, K., et al. 2010, in Proc. SPIE, Vol. 7733, Ground-based and Airborne Telescopes III, 77330E
- Kamble & Soderberg (2013) Kamble, A., & Soderberg, A. 2013, The Astronomer’s Telegram, 4997, 1
- Kasliwal et al. (2017) Kasliwal, M., Singer, L., Karamehmetoglu, E., et al. 2017, LIGO-Virgo GRB Coordinate Network Circular, 20398
- Kelson (2003) Kelson, D. D. 2003, PASP, 115, 688
- Kouveliotou et al. (2004) Kouveliotou, C., Woosley, S. E., Patel, S. K., et al. 2004, ApJ, 608, 872
- Kulkarni et al. (1998) Kulkarni, S. R., Frail, D. A., Wieringa, M. H., et al. 1998, Nature, 395, 663
- Kupfer et al. (2017) Kupfer, T., Quimby, R., Adams, S., Vedantham, H., & Kasliwal, M. 2017, LIGO-Virgo GRB Coordinate Network Circular, 20419
- Law et al. (2009) Law, N. M., Kulkarni, S. R., Dekany, R. G., et al. 2009, PASP, 121, 1395
- Li & Chevalier (1999) Li, Z.-Y., & Chevalier, R. A. 1999, ApJ, 526, 716
- LIGO Scientific Collaboration & Virgo Collaboration (2017a) LIGO Scientific Collaboration, & Virgo Collaboration. 2017a, LIGO-Virgo GRB Coordinate Network Circular, 20364
- LIGO Scientific Collaboration & Virgo Collaboration (2017b) —. 2017b, LIGO-Virgo Circular, 20385
- LIGO Scientific Collaboration & Virgo Collaboration (2017c) —. 2017c, LIGO-Virgo GRB Coordinate Network Circular, 21056
- Lyman et al. (2014) Lyman, J. D., Bersier, D., & James, P. A. 2014, MNRAS, 437, 3848
- Lyman et al. (2016) Lyman, J. D., Bersier, D., James, P. A., et al. 2016, MNRAS, 457, 328
- Marcinkowski et al. (2016) Marcinkowski, R., Xiao, H., & Hajdas, W. 2016, GRB coordinate network, 20348
- Margutti et al. (2013) Margutti, R., Soderberg, A. M., Wieringa, M. H., et al. 2013, The Astrophysical Journal, 778, 18. http://stacks.iop.org/0004-637X/778/i=1/a=18
- Margutti et al. (2014) Margutti, R., Milisavljevic, D., Soderberg, A. M., et al. 2014, ApJ, 797, 107
- Martin et al. (2005) Martin, D. C., Fanson, J., Schiminovich, D., et al. 2005, ApJ, 619, L1
- Masci et al. (2017) Masci, F. J., Laher, R. R., Rebbapragada, U. D., et al. 2017, PASP, 129, 014002
- McMullin et al. (2007) McMullin, J. P., Waters, B., Schiebel, D., Young, W., & Golap, K. 2007, in Astronomical Society of the Pacific Conference Series, Vol. 376, Astronomical Data Analysis Software and Systems XVI, ed. R. A. Shaw, F. Hill, & D. J. Bell, 127
- Melandri et al. (2012) Melandri, A., Pian, E., Ferrero, P., et al. 2012, A&A, 547, A82
- Milisavljevic et al. (2015) Milisavljevic, D., Margutti, R., Parrent, J. T., et al. 2015, ApJ, 799, 51
- Murphy et al. (2011) Murphy, E. J., Condon, J. J., Schinnerer, E., et al. 2011, The Astrophysical Journal, 737, 67. http://stacks.iop.org/0004-637X/737/i=2/a=67
- Ofek et al. (2007) Ofek, E. O., Cenko, S. B., Gal-Yam, A., et al. 2007, ApJ, 662, 1129
- Ofek et al. (2012) Ofek, E. O., Laher, R., Law, N., et al. 2012, PASP, 124, 62
- Oke & Gunn (1982) Oke, J. B., & Gunn, J. E. 1982, PASP, 94, 586
- Oke et al. (1995) Oke, J. B., Cohen, J. G., Carr, M., et al. 1995, PASP, 107, 375
- Perley et al. (2013) Perley, D. A., Levan, A. J., Tanvir, N. R., et al. 2013, ApJ, 778, 128
- Perley et al. (2014) Perley, D. A., Cenko, S. B., Corsi, A., et al. 2014, ApJ, 781, 37
- Perley et al. (2016) Perley, D. A., Tanvir, N. R., Hjorth, J., et al. 2016, ApJ, 817, 8
- Piascik et al. (2014) Piascik, A. S., Steele, I. A., Bates, S. D., et al. 2014, in Proc. SPIE, Vol. 9147, Ground-based and Airborne Instrumentation for Astronomy V, 91478H
- Pignata et al. (2011) Pignata, G., Stritzinger, M., Soderberg, A., et al. 2011, ApJ, 728, 14
- Podsiadlowski et al. (2004) Podsiadlowski, P., Mazzali, P. A., Nomoto, K., Lazzati, D., & Cappellaro, E. 2004, ApJ, 607, L17
- Rau et al. (2009) Rau, A., Kulkarni, S. R., Law, N. M., et al. 2009, Pub. of the Astron. Soc. of the Pacific, 121, 1334
- Richmond et al. (1996) Richmond, M. W., van Dyk, S. D., Ho, W., et al. 1996, AJ, 111, 327
- Salas et al. (2013) Salas, P., Bauer, F. E., Stockdale, C., & Prieto, J. L. 2013, Mon. Not. Roy. Astr. Soc., 428, 1207
- Sazonov et al. (2004) Sazonov, S. Y., Lutovinov, A. A., & Sunyaev, R. A. 2004, Nature, 430, 646
- Schlafly & Finkbeiner (2011) Schlafly, E. F., & Finkbeiner, D. P. 2011, The Astrophysical Journal, 737, 103. http://stacks.iop.org/0004-637X/737/i=2/a=103
- Seymour et al. (2008) Seymour, N., Dwelly, T., Moss, D., et al. 2008, MNRAS, 386, 1695
- Singer et al. (2015) Singer, L. P., Kasliwal, M. M., Cenko, S. B., et al. 2015, ApJ, 806, 52
- Smith et al. (2014) Smith, R. M., Dekany, R. G., Bebek, C., et al. 2014, in Proc. SPIE, Vol. 9147, Ground-based and Airborne Instrumentation for Astronomy V, 914779
- Soderberg & Chomiuk (2011) Soderberg, A., & Chomiuk, L. 2011, The Astronomer’s Telegram, 3101, 1
- Soderberg et al. (2006a) Soderberg, A. M., Nakar, E., Berger, E., & Kulkarni, S. R. 2006a, Astrophys. J., 638, 930
- Soderberg et al. (2004) Soderberg, A. M., Kulkarni, S. R., Berger, E., et al. 2004, Nature, 430, 648
- Soderberg et al. (2006b) Soderberg, A. M., Kulkarni, S. R., Nakar, E., et al. 2006b, Nature, 442, 1014
- Soderberg et al. (2010) Soderberg, A. M., Chakraborti, S., Pignata, G., et al. 2010, Nature, 463, 513
- Taddia et al. (2017) Taddia, F., et al. 2017, in prep.
- Wade & Horne (1988) Wade, R. A., & Horne, K. 1988, ApJ, 324, 411
- Walker (2001) Walker, M. A. 2001, MNRAS, 321, 176
- Watson et al. (2004) Watson, D., Hjorth, J., Levan, A., et al. 2004, The Astrophysical Journal Letters, 605, L101. http://stacks.iop.org/1538-4357/605/i=2/a=L101
- Waxman (2004) Waxman, E. 2004, ApJ, 602, 886
- Woosley & Bloom (2006) Woosley, S. E., & Bloom, J. S. 2006, Ann. Rev. Astron. Astrophys., 44, 507
- Yaron & Gal-Yam (2012) Yaron, O., & Gal-Yam, A. 2012, PASP, 124, 668
- York et al. (2000) York, D. G., Adelman, J., Anderson, Jr., J. E., et al. 2000, AJ, 120, 1579
| Date | Telescope | Band | Magnitude |
|---|---|---|---|
| (MJD) | [AB] | ||
| 57760.291 | P48 | ||
| 57760.319 | P48 | ||
| 57768.305 | P60 | ||
| 57770.194 | P60 | ||
| 57771.149 | P60 | ||
| 57780.219 | P60 | ||
| 57783.277 | P60 | ||
| 57787.103 | P60 | ||
| 57789.186 | P60 | ||
| 57793.187 | P60 | ||
| 57768.301 | P60 | ||
| 57770.191 | P60 | ||
| 57771.146 | P60 | ||
| 57783.273 | P60 | ||
| 57784.124 | P60 | ||
| 57789.183 | P60 | ||
| 57793.184 | P60 | ||
| 57794.123 | P60 | ||
| 57797.444 | P60 | ||
| 57799.108 | P60 | ||
| 57768.303 | P60 | ||
| 57770.193 | P60 | ||
| 57771.147 | P60 | ||
| 57780.217 | P60 | ||
| 57783.275 | P60 | ||
| 57789.185 | P60 | ||
| 57793.185 | P60 | ||
| 57794.125 | P60 | ||
| 57797.446 | P60 | ||
| 57799.110 | P60 |
| MJD | Epoch | Instr.:config | Freq. | Flux Density |
|---|---|---|---|---|
| (d) | (GHz) | (Jy/beam) | ||
| 57763.140 | 12.6 | VLA:A | 6.2 | |
| 57766.260 | 15.7 | VLA:A | 6.3 | |
| 57766.464 | 15.9 | VLA:A | 2.8 | |
| ” | ” | ” | 14 | |
| 57772.115 | 21.6 | VLA:A | 6.2 | |
| 57775.451 | 24.9 | VLA:A | 2.8 | |
| ” | ” | ” | 14 | |
| 57781.217 | 30.7 | VLA:AnD | 6.2 | |
| 57792.182 | 41.6 | VLA:AnD | 2.8 | |
| ” | ” | ” | 6.2 | |
| 57816.103 | 65.6 | VLA:D | 14 | |
| 57855.470 | 105 | VLA:D | 14 |
| Date | Epoch | Instrument | Band | Exp. Time | Count Rate | Flux (unabs) |
|---|---|---|---|---|---|---|
| (MJD) | (d) | (keV) | (ks) | (s-1) | (erg cm-2 s-1) | |
| 57766.757 | 16.2 | Swift-XRT | 0.3-10 | 1.4 | ||
| 57771.524 | 21.0 | Swift-XRT | 0.3-10 | 7.5 | ||
| 57792.390 | 41.8 | Chandra-ACIS | 0.5-7 | 9.86 |