11email: fkamali@mpifr-bonn.mpg.de; 11email: fateme.kamali28@gmail.com 22institutetext: Astron. Dept., King Abdulaziz University, P.O. Box 80203, Jeddah 21589, Saudi Arabia
33institutetext: National Radio Astronomy Observatory, 520 Edgemont Road, Charlottesville, VA 22903, USA
44institutetext: Joint ALMA Office, Alonso de Córdova 3107, Vitacura, Santiago, Chile
55institutetext: Department of Astrophysical Sciences, Princeton University, Princeton, NJ 08544, USA
66institutetext: Harvard-Smithsonian Center for Astrophysics, 60 Garden Street, Cambridge, MA 02138, USA
77institutetext: Department of Physics, National Sun Yat-Sen University, No.70, Lianhai Road, Gushan Dist., Kaohsiung City 804, Taiwan (R.O.C.)
88institutetext: Institut für Theoretische Physik und Astrophysik, Universität Würzburg, Campus Hubland Nord, Emil-Fischer-Str. 31, 97074 Würzburg, Germany
99institutetext: Dr. Remeis-Observatory, Erlangen Centre for Astroparticle, Physics, University of Erlangen-Nuremberg, Sternwartstr. 7, 96049 Bamberg, Germany
Radio continuum of galaxies with H2O
megamaser disks:
33 GHz VLA data
Abstract
Context. Galaxies with H2O megamaser disks are active galaxies in whose edge-on accretion disks 22 GHz H2O maser emission has been detected. Because their geometry is known, they provide a unique view into the properties of active galactic nuclei.
Aims. The goal of this work is to investigate the nuclear environment of galaxies with H2O maser disks and to relate the maser and host galaxy properties to those of the radio continuum emission of the galaxy.
Methods. The 33 GHz (9 mm) radio continuum properties of 24 galaxies with reported 22 GHz H2O maser emission from their disks are studied in the context of the multiwavelength view of these sources. The 29–37 GHz Ka-band observations are made with the Jansky Very Large Array in B, CnB, or BnA configurations, achieving a resolution of 0.2 - 0.5 arcseconds. Hard X-ray data from the Swift/BAT survey and 22 m infrared data from WISE, 22 GHz H2O maser data and 1.4 GHz data from NVSS and FIRST surveys are also included in the analysis.
Results. Eighty-seven percent (21 out of 24) galaxies in our sample show 33 GHz radio continuum emission at levels of 4.5 – 240 . Five sources show extended emission (deconvolved source size larger than 2.5 times the major axis of the beam), including one source with two main components and one with three main components. The remaining detected 16 sources (and also some of the above-mentioned targets) exhibit compact cores within the sensitivity limits. Little evidence is found for extended jets (300 pc) in most sources. Either they do not exist, or our chosen frequency of 33 GHz is too high for a detection of these supposedly steep spectrum features. In only one source among those with known maser disk orientation, NGC 4388, did we find an extended jet-like feature that appears to be oriented perpendicular to the H2O megamaser disk. NGC 2273 is another candidate whose radio continuum source might be elongated perpendicular to the maser disk. Smaller 100–300 pc sized jets might also be present, as is suggested by the beam-deconvolved morphology of our sources. Whenever possible, central positions with accuracies of 20-280 mas are provided. A correlation analysis shows that the 33 GHz luminosity weakly correlates with the infrared luminosity. The 33 GHz luminosity is anticorrelated with the circular velocity of the galaxy. The black hole masses show stronger correlations with H2O maser luminosity than with 1.4 GHz, 33 GHz, or hard X-ray luminosities. Furthermore, the inner radii of the disks show stronger correlations with 1.4 GHz, 33 GHz, and hard X-ray luminosities than their outer radii, suggesting that the outer radii may be affected by disk warping, star formation, or peculiar density distributions.
Key Words.:
Galaxies: active – Galaxies: ISM – Galaxies: jets – Galaxies: nuclei - Galaxies: Seyfert – Radio continuum: galaxies1 Introduction
In 1969, the 22 GHz ( 1.4 cm) H2O maser line that is emitted from the water vapor 616-523 rotational transition was detected for the first time in the Milky Way (Cheung et al. 1969). Since then, this interesting phenomenon has been investigated in a variety of relevant astrophysical environments, also including sources far outside the Milky Way (e.g., Impellizzeri et al. 2008).
One highlight was the discovery of high-velocity H2O maser emission in the nucleus of NGC 4258, offset by 1000 km s-1 from their host galaxy in systemic velocity (e.g., Nakai et al. 1993; Miyoshi et al. 1995; Herrnstein et al. 1999). This led to the discovery of so-called disk masers, which trace subparsec edge-on Keplerian disks that surround supermassive black holes (SMBHs). Later on, the Keplerian motion was used to determine the SMBH masses and direct angular diameter distances. The distance measurement to NGC 4258 is not only independent of the traditional distance ladder, but is also among the most accurate in extragalactic space (Herrnstein et al. 1999; Humphreys et al. 2013). The importance of such direct geometrical extragalactic distance measurements provided the motivation to carry out surveys for finding more H2O maser disks (e.g., Braatz et al. 2004).
The high accuracy of distances obtained from this method can reduce uncertainties in the Hubble constant. With this idea in mind, the Megamaser Cosmology Project (MCP) was initiated, with the purpose of measuring the Hubble constant with 3% accuracy. In the framework of the MCP, thousands of galaxies have been searched for H2O megamaser111Extragalactic masers are about a million times more luminous than many Galactic masers, hence they are called megamasers. emission. To date, about 160 galaxies with H2O megamaser emission are known, 39 of which are disk-maser candidates222See the MCP webpage: https://safe.nrao.edu/wiki/bin/view/Main/MegamaserCosmologyProject (32 “clean” disk masers, where “clean” means that the maser emission arises from an edge-on Keplerian disk that dominates other emission from nuclear jets or outflows, see Pesce et al. 2015). While the number of disk masers is low, (1 % of local Seyfert 2s and low ionization nuclear emission region (LINER) galaxies, see, e.g., Van den Bosch et al. 2016, and references therein), their unique geometrical properties, such as an edge-on disk with a putative jet in the plane of the sky, provide motivation to investigate the host galaxies of these H2O megamaser disks in more detail in order to better understand their nuclear environment. Investigating the radio continuum of these galaxies can reveal emission from inside the maser disks as well as jets or outflows in the vicinity of the central black hole. By definition, these galaxies are particularly suited for studying the accretion disk–jet paradigm under extremely well-defined boundary conditions, including the knowledge of distance, inclination of the accretion disk, and mass of the SMBH.
Here, we present radio continuum data observed at a frequency range centered at 33 GHz (9 mm wavelength) from 24 such disk-maser sources, obtained with the Karl Jansky Very Large Array (VLA)333The Karl Jansky Very Large Array (VLA) is a facility of the National Radio Astronomy Observatory (NRAO), which is operated by the associated universities, Inc., under a cooperative agreement with the National Science Foundation (NSF).. The purpose of our investigations is to compare the geometry and luminosity of the parsec-scale maser disk with nuclear radio continuum properties, as well as to probe these galaxies for large-scale (kpc scale) radio jets. Resolving structure at kpc scale requires an angular resolution of 0.2-0.5 arcseconds at the distances of our sources. To achieve this resolution, we chose the Ka band of the higher frequency bands, which uses frequencies not too far from the 22 GHz H2O maser line (to obtain a realistic idea of the radio continuum distribution and intensity near the frequency of the H2O maser). At the same time, this band minimizes the atmospheric attenuation (which may be stronger at 22 GHz).
2 Sample
A total of 39 H2O disk-maser candidates were identified, mostly by the MCP, until February 2016. We initially selected 30 H2O disk-maser candidates from those that were known in August 2013. Of this sample, 24 galaxies (see Table 1) were observed, with declination (Dec) –30 ∘ and right ascension (R.A.) from 0h to 17h. Four H2O disk-maser candidates with Dec –30 ∘ are not suitable for observation with the VLA. Two more northern galaxies, NGC 4258 and NGC 1068, have been well studied in the past (e.g., Herrnstein et al. 1998; Gallimore et al. 2001) and were therefore also not included in our sample.
Three of the 24 observed galaxies have been monitored with the goal of measuring the Hubble constant (UGC 3789: Braatz et al. 2010, Reid et al. 2013; IC 2560: Wagner et al., in prep.; Mrk 1419: Impellizzeri et al., in prep.), and 13 maser disks were used to measure the SMBH mass (, see Kuo et al. 2011; Braatz et al. 2015a; Gao et al. 2017). As mentioned before, the distances measured by the MCP are among the most accurate measurements, but they are only available for three sources in our sample. Therefore we adopted the distances from the NASAIPAC Extragalactic Database (NED)444https://ned.ipac.caltech.edu/ , which are sufficiently accurate for our purposes. The NED distances were obtained using H0=70.0 km s-1 Mpc-1, =0.27, and =0.73 as cosmological parameters. H2O maser luminosities from the literature were also rescaled to H0=70.0 km s-1 Mpc-1 to be consistent with other luminosities in this work.
| Galaxy | R.A. | Dec. | Bandpass | Amplitude and | R.A. | R.A. | Dec. | Dec. |
|---|---|---|---|---|---|---|---|---|
| 2000 | calibrator | phase calibrator | 2000 | 2000 | ||||
| (arcsec) | (arcsec) | |||||||
| ESO558-G009 | 07:04:21.02 | –21:35:19.2 | 3C147 | J0731-2341 | 07:04:21.01 | 0.06 | -21:35:19.03 | 0.05 |
| IC 0485/ UGC 4156 | 08:00:19.77 | +26:42:05.2 | 3C147 | J0748+2400 | … | … | … | … |
| IC 2560 | 10:16:18.72 | –33:33:49.7 | 3C286 | J1018-3144 | 10:16:18.71 | 0.16 | -33:33:49.60 | 0.16 |
| J0126-0417 | 01:26:01.66 | –04:17:56.2 | 3C48 | J0115-0127 | 01:26:01.64 | 0.04 | -04:17:56.23 | 0.04 |
| J0350-0127 | 03:50:00.35 | –01:27:57.7 | 3C147 | J0339-0146 | 03:50:00.35 | 0.15 | -01:27:57.40 | 0.15 |
| J0437+2456 | 04:37:03.69 | +24:56:06.9 | 3C147 | J0426+2327 | … | … | … | … |
| J0437+6637 | 04:37:08.26 | +66:37:42.3 | 3C147 | J0449+6332 | 04:37:08.28 | 0.12 | +66:37:42.10 | 0.12 |
| J0836+3327 | 08:36:22.80 | +33:27:38.7 | 3C286 | J0827+3525 | … | … | … | … |
| J1658+3923 | 16:58:15.50 | +39:23:29.3 | 3C48 | J1653+3945 | 16:58:15.54 | 0.22 | +39:23:29.27 | 0.20 |
| Mrk 0001/NGC 0449 | 01:16:07.25 | +33:05:22.4 | 3C48 | J0112+3208 | 01:16:07.20 | 0.02 | +33:05:21.75 | 0.02 |
| Mrk 0078 | 07:42:41.73 | +65:10:37.5 | 3C286 | J0805+6144 | 07:42:41.73 | 0.03 | +65:10:37.39 | 0.03 |
| Mrk 1029 | 02:17:03.57 | +05:17:31.4 | 3C48 | J0224+0659 | 02:17:03.57 | 0.18 | +05:17:31.15 | 0.18 |
| Mrk 1210/Phoenix | 08:04:05.86 | +05:06:49.8 | 3C147 | J0811+0146 | 08:04:05.86 | 0.03 | +05:06:49.83 | 0.03 |
| Mrk 1419/NGC 2960 | 09:40:36.38 | +03:34:37.2 | 3C147 | J0948+0022 | 09:40:36.38 | 0.14 | +03:34:37.36 | 0.13 |
| NGC 0591/Mrk 1157 | 01:33:31.27 | +35:40:05.7 | 3C48 | J0148+3854 | 01:33:31.23 | 0.10 | +35:40:05.79 | 0.11 |
| NGC 1194 | 03:03:49.11 | –01:06:13.5 | 3C48 | J0312+0133 | 03:03:49.11 | 0.03 | -01:06:13.48 | 0.03 |
| NGC 2273 | 06:50:08.66 | +60:50:44.9 | 3C147 | J0650+6001 | 06:50:08.69 | 0.28 | +60:50:45.10 | 0.27 |
| NGC 2979 | 09:43:08.65 | –10:22:59.7 | 3C286 | J0943-0819 | 09:43:08.64 | 0.04 | -10:23:00.02 | 0.04 |
| NGC 3393 | 10:48:23.46 | –25:09:43.4 | 3C286 | J1037-2934 | 10:48:23.46 | 0.03 | -25:09:43.44 | 0.03 |
| NGC 4388 | 12:25:46.75 | +12:39:43.5 | 3C286 | J1218+1105 | 12:25:46.78 | 0.02 | +12:39:43.77 | 0.02 |
| NGC 5495 | 14:12:23.35 | –27:06:28.9 | 3C286 | J1409-2657 | 14:12:23.35 | 0.05 | -27:06:29.14 | 0.06 |
| NGC 5728 | 14:42:23.90 | –17:15:11.1 | 3C286 | J1439-1659 | 14:42:23.89 | 1.00 | -17:15:10.76 | 1.00 |
| UGC 3193 | 04:52:52.58 | +03:03:25.9 | 3C147 | J0503+0203 | 04:52:52.56 | 0.11 | +03:03:25.52 | 0.29 |
| UGC 3789 | 07:19:30.92 | +59:21:18.4 | 3C147 | J0728+5701 | 07:19:30.95 | 0.08 | +59:21:18.37 | 0.08 |
Notes. Column 1: name of galaxy. Column 2: 2000 NED right ascension. Column 3: 2000 NED declination. Column 4: bandpass calibrator. Column 5: amplitude and phase calibrators (these are the same for each object). Column 6 and 7: 2000 right ascension determined from our radio maps and their uncertainties. Column 8 and 9: 2000 declination determined from our radio maps and their uncertainties.
3 Data and data reduction
3.1 33 GHz observations and data reduction
Our sample of disk-maser galaxies was observed by the VLA in Ka band (26.5-40.0 GHz) in B, CnB, or BnA configurations using a phase-referencing mode (proposal code: VLA/13B-340). Synthesized full-width at half-maximum (FWHM) beam sizes ranged from 0.19 to 0.50 arcseconds. We used a total bandwidth of 8 GHz (42 GHz, from 29 GHz to 37 GHz), full polarization, and 3-bit sampling. The sources were grouped into 12 sets of pairs for observation, with a total time of one hour per pair and an integration time of 10 minutes on source per target. Table 1 indicates the 2000 coordinates, amplitude, phase, and bandpass calibrators. The data were calibrated with the NRAO VLA calibration pipeline, using standard procedures of the Common Astronomy Software Applications (CASA)555http://casa.nrao.edu/ package (see McMullin et al. 2007). These standard procedures include radio frequency interference flagging, deterministic flagging (e.g., online flags, end channels), opacity and antenna corrections, and bandpass, amplitude and phase calibrations. The majority of our sources was not bright enough for self-calibration (1 mJy, see Table 2). However, for Mrk 1210, phase and amplitude self-calibration could be performed, which resulted in an improvement of the quality of its radio map. For imaging, the CLEAN algorithm with natural weighting was used. The latter is chosen to maximize the chance of detecting weak compact or slightly extended sources and is hence optimal for detection projects.
3.2 Complementary data
For further analysis and investigation we obtained from the literature 1.4 GHz radio data from the NVSS666NRAO VLA Sky Survey, http://www.cv.nrao.edu/nvss/ (Condon et al. 1998), 1.4 GHz data from the FIRST777Faint Images of the Radio Sky at Twenty-cm, http://sundog.stsci.edu/ survey (Becker et al. 1995), and hard X-ray data from the Swift/BAT satellite in a range of 20-100 keV (Litzinger et al., in prep.), as well as 22 m (W4) infrared WISE888Wide-Field Infrared Survey Explorer (WISE). See http://wise.ssl.berkeley.edu/ data (Wright et al. 2010). Seventeen of the 24 galaxies in our sample were detected with the NVSS, 8 with FIRST, 13 with Swift/BAT, and all 24 with WISE. From radio and X-ray data, the luminosities were calculated using , where stands for flux and for distance. The infrared luminosities were calculated using , where is the bolometric luminosity of the Sun, is the absolute magnitude of the Sun in WISE W4 band, and is the absolute magnitude of our sources in this band.
| Galaxy | Distance | 33 GHz flux | rms | NVSS flux | FIRST flux | IR magnitude | hard X-ray flux | log L | Type of |
|---|---|---|---|---|---|---|---|---|---|
| (Mpc) | (mJy) | (Jy/beam) | (mJy) | (mJy) | () | (L⊙) | activity | ||
| ESO558-G009 | 112.2 7.9 | 0.80 0.04 | 18.6 | 12.80.6 | … | 8.793 | ¡0.34 | 2.9 | |
| IC 0485 | 122.0 8.5 | … | 18.9 | … | 3.01 | 9.406 | 1.75 | 3.1 | |
| IC 2560 | 46.4 3.3 | 2.00 0.10 | 17.3 | 32.01.7 | … | 9.294 | 0.41 | 2.1 | Sy2 |
| J0126-0417 | 76.2 5.4 | 0.13 0.01 | 9.9 | … | … | 8.930 | ¡0.34 | 2.1 | |
| J0350-0127 | 174.2 12.2 | 0.14 0.02 | 12.0 | … | … | 8.529 | 0.45 | 3.7 | |
| J0437+2456 | 68.1 4.8 | … | 17.7 | … | … | 9.024 | ¡0.41 | 2.3 | |
| J0437+6637 | 52.9 3.7 | 0.11 0.02 | 16.8 | 3.80.6 | … | 8.934 | 0.290.14 | 1.4 | |
| J0836+3327 | 214.6 15.0 | … | 30.9 | … | 1.95 | 9.1450.459 | ¡0.33 | 3.6 | Sy2 |
| J1658+3923 | 146.8 10.3 | 0.18 0.04 | 13.4 | … | 3.64 | 9.513 | ¡0.30 | 2.9 | Sy2 |
| Mrk 0001 | 64.2 4.5 | 3.96 0.12 | 10.8 | 75.9 2.3 | … | 9.105 | ¡0.32 | 1.9 | Sy2 |
| Mrk 0078 | 159.9 11.2 | 1.75 0.11 | 13.7 | 36.91.2 | … | 8.975 | 0.63 0.18 | 1.6 | Sy2 |
| Mrk 1029 | 126.0 8.8 | 1.18 0.14 | 17.7 | 11.90.6 | 8.12 | 8.799 | ¡0.35 | 2.8 | |
| Mrk 1210 | 61.3 4.3 | 9.58 0.08 | 17.9 | 114.93.5 | … | 8.523 | 3.580.20 | 2.0 | Sy2, Sy1 |
| Mrk 1419 | 75.3 5.3 | 0.36 0.06 | 16.0 | 7.4 0.5 | 5.13 | 8.790 | ¡0.34 | 2.7 | LINER |
| NGC 0591 | 61.1 4.3 | 1.52 0.07 | 13.6 | 33.31.1 | … | 8.566 | 0.37 | 1.5 | Sy2 |
| NGC 1194 | 55.4 3.9 | 1.08 0.04 | 13.0 | … | 1.49 | 8.807 | 2.210.18 | 2.8 | Sy 1.9 |
| NGC 2273 | 26.8 1.9 | 2.69 0.29 | 26.3 | 63.42.4 | … | 9.7340.511 | 0.67 0.16 | 0.9 | Sy2 |
| NGC 2979 | 43.8 3.1 | 0.36 0.04 | 14.0 | 15.71.0 | … | 9.158 | ¡0.36 | 2.2 | Sy2 |
| NGC 3393 | 58.6 4.1 | 5.30 0.36 | 18.5 | 81.53.3 | … | 8.846 | 1.560.19 | 2.7 | Sy2 |
| NGC 4388 | 40.8 2.9 | 8.57 0.43 | 17.9 | 120.44.7 | 45.02 | 8.814 | 15.81 | 1.2 | Sy2 |
| NGC 5495 | 99.8 7.0 | 0.13 0.02 | 15.4 | 12.5 1.3 | … | 9.301 | ¡0.40 | 2.4 | Sy2 |
| NGC 5728 | 43.3 3.1 | 2.27 0.06 | 28.1 | 70.82.9 | … | 9.126 | 5.200.20 | 2.0 | Sy2 |
| UGC 3193 | 63.2 4.4 | 3.95 0.27 | 14.4 | 17.70.7 | … | 8.942 | ¡0.39 | 2.5 | |
| UGC 3789 | 47.4 3.3 | 0.21 0.02 | 14.9 | 17.6 1.0 | 14.43 | 8.3260.142 | 0.26 | 2.7 | Sy2 |
Notes. Column 1: name of galaxy. Column 2: Hubble flow distances (relative to the 3 K CMB), assuming H0=70 km s-1 Mpc-1 (see Sect. 2). Column 3: 33 GHz integrated flux densities with uncertainties. The errors given in those cases are formal values and do not show the real level of uncertainty. Column 4: root mean square noise level of the clean image. Column 5: NVSS integrated flux. Column 6: FIRST integrated flux. Column 7: IR (WISE, W 4) magnitude. In our analysis, a 10% uncertainty on the magnitude is assumed for those cases where the uncertainty is not given in the literature. Column 8: Swift/BAT hard X-ray fluxes (20-100 keV) with uncertainties (Litzinger et al., in prep). Column 9: logarithm of water maser luminosity (isotropy assumed) (Zhang et al. 2012, modified for H0=70 km s-1 Mpc-1). In our analysis, 10% uncertainty on the luminosity is assumed. Column 10: types of nuclear activity after NED; U stands for unidentified.
4 Results
4.1 Sample
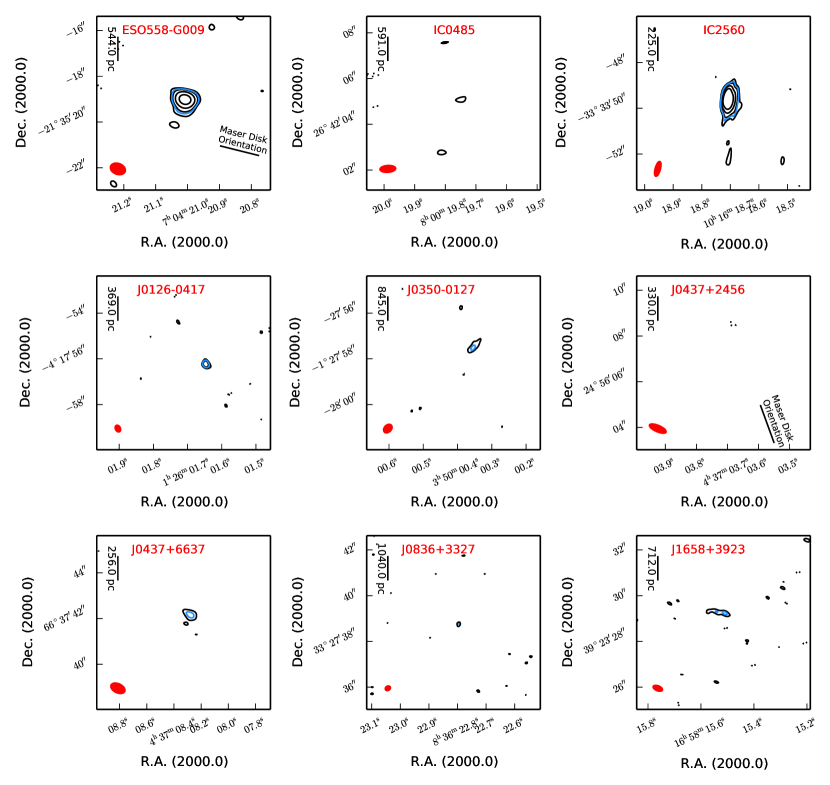
In this section we present the 33 GHz radio maps for all observed sources, centered at their NED positions, as well as a table of derived source properties. Important in this context is that our linear resolution in pc for a 0.2 beam size is close to the distance of the galaxies measured in units of Mpc, that is, (linear resolution / pc) . Therefore, our beam typically covers 100 pc, but with large deviations to either side. This implies that even the central beam contains not only a galaxy’s very center, but also the surrounding environment, which may contain star-forming regions and supernova remnants that also contribute to activity and radio continuum emission.
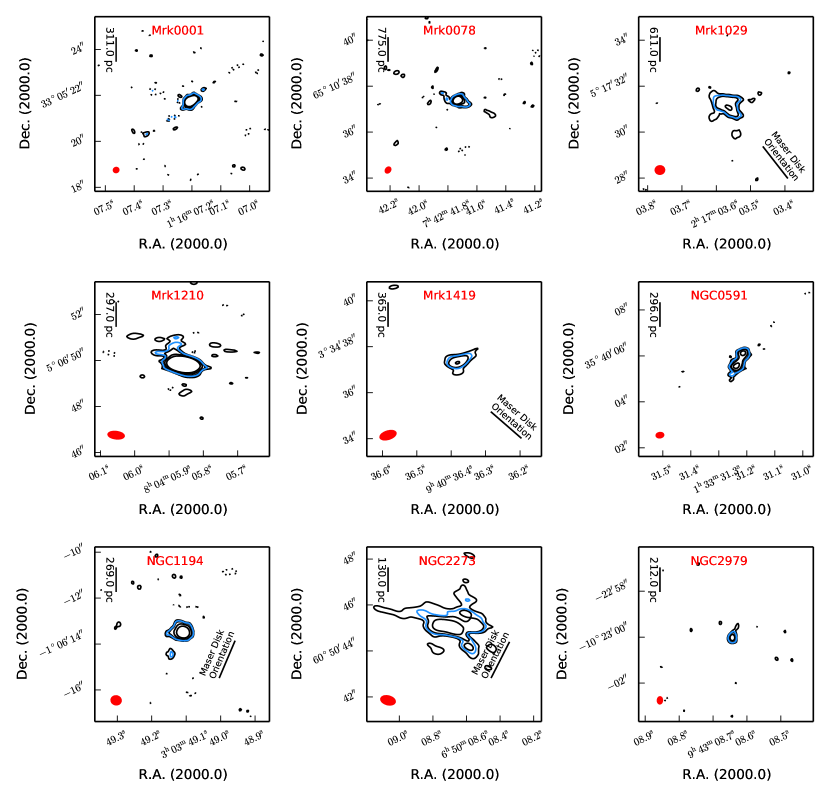
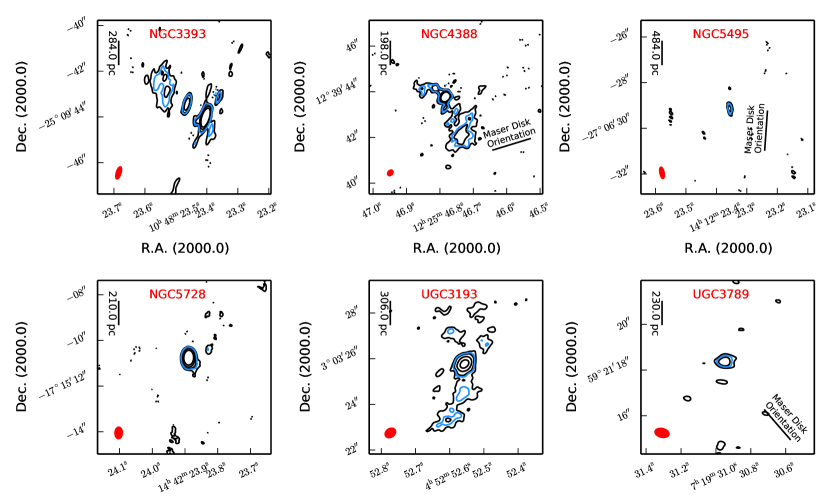
Figure 1 presents the 33 GHz contour maps for our sample, where the contour levels are 3, 6, 12, 24 times the root-mean-square noise (rms) of an emission-free field in the CLEANed image (see Table 2 for the sensitivities). Since our detection limit is 4.5, a contour level of this value is also shown in Fig. 1 (in blue), to facilitate distinguishing between a weakly detected source and an undetected source. Figure 1 clearly shows the large number of sources exhibiting a compact core without much additional structure. While our classification depends on limited signal-to-noise ratios and is thus sometimes debatable, we count 16 such compact sources, where “compact” used here and in the following denotes a beam-convolved (and deconvolved) major axis smaller than 2.5 times the beam major axis. One source shows two main components, another source three main components, and three other sources exhibit extended emission. We note that the sources with two or three main components also contain compact cores, as do some of the extended sources.
Only three of the 24 galaxies (IC 485, J0437+2456, and J0836+3327) were not detected at 33 GHz at a level of 4.5 or higher. Two of these galaxies, IC 485 and J0836+3327, are at relatively large distances of 122 Mpc and 214 Mpc, respectively. IC 485 was detected with a flux density of 3.01 mJy, and J0836+3327 with 1.95 mJy by FIRST. Adopting a mean spectral index of 0.73 obtained in this work (Sect. 5.2) between FIRST 1.4 GHz and our 33 GHz observations 999Assuming a power-law dependence for the continuum flux density given by , see Sect. 5.2., flux densities of 0.30 mJy and 0.19 mJy are expected to be observed at 33 GHz for IC 485 and J0836+3327, respectively. These flux densities are still higher than our 4.5 detection threshold. Therefore, these sources may have spectral indices steeper than 1.0. The third source, J0437+2456, is closer (68 Mpc), but remained undetected by both NVSS and FIRST.
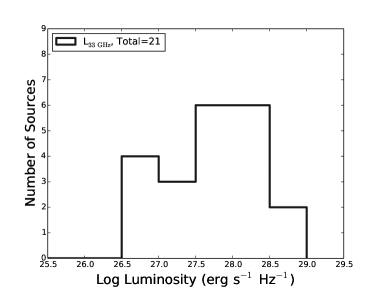
With 21 galaxies detected at Ka band (29-37 GHz), 87% of the galaxies in our sample show radio emission at levels of 4.5 to 240 . The 33 GHz continuum luminosity distribution is presented in Fig. 4.
Furthermore, our 33 GHz maps have improved the accuracy of the central coordinates of some galaxies in our sample. We identify the compact radio sources as the galactic nuclei. After fitting two-dimensional Gaussians (in the image domain) on the central component, the central position of the Gaussian fit is adopted as the new position of the center of the respective galaxy. These new radio coordinates and their uncertainties are presented in Table 1. Our position uncertainties take into account statistical uncertainty, the uncertainty of the phase calibrator position, and systematic uncertainties. The systematic uncertainty was approximated from , where B is the beam size, is the source major axis, and SNR is the signal-to-noise ratio of the map (for more details see White et al. 1997). For 10 galaxies in our sample, interferometrically determined coordinates from the maser emission are also available (Kondratko et al. 2006a, 2008; Kuo et al. 2011; Gao et al. 2017). The central positions obtained in this work and those obtained from maser emission deviate on average by 121 107 mas (milliarcseconds) and are mostly in agreement within the limits provided by beam size and signal-to-noise ratio (S/Ns). See Table 3 for a comparison of our determined positions and the H2O maser positions. Noteworthy deviations beyond the 3 level are found for ESO 0558–G009, NGC 1194, Mrk 1419, and NGC 4388, all sources where at least slightly extended emission is found in our continuum data. For two sources, Mrk 1029 and NGC 5495, our coordinates have lower uncertainties than those of the maser positions.
In Tables 2 and 4 we list the derived properties of the sources. Flux density and position angle (P.A.) have been determined by two-dimensional Gaussian model fitting on a region containing all the significant emission. For sources with more complex radio morphologies, multiple Gaussians were fitted in order to have a better estimate of the fluxes (NGC 0591, NGC 3393, NGC 4388, UGC 3193). In what follows we mention some relevant properties of these galaxies such as their morphology, activity type, or other interesting features that are discussed in the literature together with some basic properties that can be extracted from our maps. Statistical properties are discussed in Sect. 5.
| Galaxy | Maser | 33GHz | Difference | Maser | |||||||
| 2000 R.A. | R.A. | 2000 Dec. | Dec. | 2000 R.A. | R.A. | 2000 Dec. | Dec. | R.A. | Dec. | Position | |
| (″) | (″) | (″) | (″) | (″) | (″) | Reference | |||||
| ESO558-G009 | 07:04:21.0113 | 0.014 | –21:35:18.948 | 0.014 | 07:04:21.01 | 0.06 | –21:35:19.03 | 0.05 | 0.02 | 0.08 | 1 |
| IC 2560 | 10:16:18.710 | 0.075 | –33:33:49.74 | 0.01 | 10:16:18.71 | 0.16 | –33:33:49.60 | 0.16 | 0.00 | 0.14 | 2 |
| Mrk 1029 | 02:17:03.566 | 0.5 | +05:17:31.43 | 0.5 | 02:17:03.57 | 0.18 | +05:17:31.15 | 0.18 | 0.06 | 0.28 | 1 |
| Mrk 1419 | 09:40:36.38370 | 0.01 | +03:34:37.2915 | 0.01 | 09:40:36.38 | 0.14 | +03:34:37.36 | 0.13 | 0.06 | 0.07 | 3 |
| NGC 1194 | 03:03:49.10864 | 0.0002 | –01:06:13.4743 | 0.0004 | 03:03:49.11 | 0.03 | –01:06:13.48 | 0.03 | 0.02 | 0.01 | 3 |
| NGC 2273 | 06:50:08.65620 | 0.01 | +60:50:44.8979 | 0.01 | 06:50:08.69 | 0.28 | +60:50:45.10 | 0.27 | 0.25 | 0.20 | 3 |
| NGC 3393 | 10:48:23.4659 | 0.001 | –25:09:43.477 | 0.001 | 10:48:23.46 | 0.03 | –25:09:43.44 | 0.03 | 0.08 | 0.04 | 4 |
| NGC 4388 | 12:25:46.77914 | 0.0004 | +12:39:43.7516 | 0.0003 | 12:25:46.78 | 0.02 | +12:39:43.77 | 0.02 | 0.01 | 0.02 | 3 |
| NGC 5495 | 14:12:23.35 | 0.3 | –27:06:29.20 | 0.3 | 14:12:23.35 | 0.05 | –27:06:29.14 | 0.06 | 0.00 | 0.06 | 5 |
| UGC 3789 | 07:19:30.9490 | 0.01 | +59:21:18.3150 | 0.01 | 07:19:30.95 | 0.08 | +59:21:18.37 | 0.08 | 0.01 | 0.06 | 3 |
Notes. Column 1: source name. Columns 2 and 3: 2000 right ascension determined from H2O maser observations and their uncertainties. Columns 4 and 5: 2000 declination determined from H2O maser observations and their uncertainties. Columns 6 and 7: 2000 right ascension determined from our radio maps and their uncertainties. Columns 8 and 9: 2000 declination determined from our radio maps and their uncertainties. Columns 10 and 11: right ascension and declination difference between H2O maser observations and our observations. Column 12: references for H2O maser observations: (1) Gao et al. (2017); (2) Ishihara et al. (2001); (3) Kuo et al. (2011); (4) Kondratko et al. (2008) and (5) Kondratko et al. (2006b).
4.2 Individual sources
ESO558-G009 is an Sbc galaxy. The MCP reported rapid intra-day variability in the maser spectrum, which was interpreted as the result of interstellar scintillation (Pesce et al. 2015). Compact radio emission is observed in our 33 GHz map. A two-dimensional Gaussian fit (Table 4) provides a formal P.A. of 15533∘. Gao et al. (2017) reported a P.A. of 2562∘ (redshifted side, here and elsewhere) for the maser disk. While this might indicate that the radio continuum elongation and the maser disk are almost perpendicular (separated by 10133∘), this needs to be verified by additional mesurements.
IC 0485 is an Sa Seyfert 2 galaxy. Radio continuum emission was not detected at 4.5 or higher levels (but it is tentatively detected at the 3.5 level). As mentioned before, the galaxy is at a relatively large distance of 120 Mpc.
IC 2560 is an SBb Seyfert 2 galaxy. Ishihara et al. (2001) reported a 2000 22 GHz peak radio continuum position of RA = 10h16m18.710s0.006s and Dec = –33d33m49.74s0.01 (1pc). The blueshifted maser features spatially coincide with the 22 GHz continuum component and are interpreted as jet maser emission (Ishihara et al. 2001). A peak and an integrated flux density of 1.8 0.3 mJy/beam and 1.7 0.5 mJy, respectively, were reported by Yamauchi et al. (2012) at 22 GHz. The nearly edge-on Keplerian disk with a position angle of –46∘ is almost perpendicular to the large-scale galactic disk (Ishihara et al. 2001). This means that the rotation axis of the maser disk and that of the large-scale galactic disk are nearly perpendicular. Compact radio emission is observed in our 33 GHz radio map, where the peak position agrees within the uncertainties with the position of the 22 GHz continuum peak reported by Yamauchi et al. (2012).
J0126-0417 has compact radio continuum emission detected in our 33 GHz map.
J0350-0127 is a (within the errors) compact source detected in our 33 GHz map; this most likely represents the nucleus.
The source J0437+2456 is not detected at 33 GHz.
The source J0437+6637 is detected in our 33 GHz map and is unresolved in our Gaussian deconvolution.
J0836+3327 is a Seyfert 2 galaxy. No radio continuum was detected at a 4.5 or higher level in our 33 GHz map (but it is tentatively detected at a 4 level).
J1658+3923 is an Sc Seyfert 2 galaxy. A slightly extended radio continuum source is observed in our map.
Mrk 0001 is an SBa Seyfert 2 spiral galaxy. Omar et al. (2002) observed H i emission from Mrk 1 and interpreted its morphology as due to a tidal interaction with its nearby companion NGC 451. The authors also reported that the line of sight toward the nucleus of Mrk 1 is rich in both atomic and molecular gas, or in other words, that it is heavily obscured. Compact 33 GHz radio emission is observed in our map.
Mrk 0078 is classified as an SB Seyfert 2 galaxy. The narrow line region (NLR) of this galaxy is affected by a strong jet-gas interaction, and spectroscopic observations have shown that its narrow emission lines are double peaked (Sargent 1972; Adams 1973). Based on optical and 3.6 cm VLA images, Whittle & Wilson (2004) suggested that Mrk 78 is a post-merger system, with a highly extended asymmetric gas distribution and a nuclear dust lane. The radio nucleus lies within this highly obscuring dust lane (Whittle & Wilson 2004). Slightly extended radio emission might be detected east and west of the center of our 33 GHz map, but the S/Ns are low, so that this source is also rated compact.
Mrk 1029 shows extended radio emission in our 33 GHz map with a P.A. of 5911°. Gao et al. (2017) reported a P.A. of 218°10∘ for the maser disk. While we consider our position angle as uncertain in spite of the low formal error, it would suggest that maser disk and radio continuum have approximately the same orientation (separation of 2115°).
Mrk 1210, also known as the Phoenix galaxy, is an amorphously looking spiral galaxy that has been classified as both Seyfert 1 and Seyfert 2. Former studies have confirmed a double structure, a core, and a southeastern jet component (Middelberg et al. 2004). Spectroscopic findings support the presence of a nuclear outflow instead of a hidden broad line region (Mazzalay & Rodríguez-Ardila 2007). A flux density of 36.28 1.95 mJy at 5 GHz was reported by Xanthopoulos et al. (2010). We observe compact emission in our 33 GHz map within the uncertainties.
Mrk 1419, also known as NGC 2960, is an Sa galaxy. Mrk 1419 hosts a LINER nucleus. The P.A. of the maser disk is 49°, and the disk inner and outer radii are 0.13 pc and 0.37 pc, respectively (Kuo et al. 2011). Sun et al. (2013) reported an extension in the 20 cm radio map at a P.A. of 125 10 ∘. This extension may suggest that a jet is launched from the central black hole. In our 33 GHz map, the radio emission may show a slight extension in the northwest-southeast direction, with a P.A. of 11784°. Nevertheless, we rate the source as compact.
NGC 0591 is an SB0/a Seyfert 2 galaxy. Near-infrared spectral studies of stellar and gas kinematics of NGC 591 show that the gas has two kinematic components: one is located inside the plane of the galaxy with similar rotation to that of stellar motion, and the other is forming an outflow that is oriented along the radio jet directed toward the northwest from the nucleus (Riffel & Storchi-Bergmann 2011). Our 33 GHz map shows two peaks with a separation of 0.66 arcsec, more precisely, with an R.A. separation of 360 mas and a Dec separation of 550 mas at a position angle of about –34∘. The central component has a flat spectrum with =0.540.44 that possibly is the radio core, while the northwestern component is characterized by =1.390.63. Such a steep spectrum suggests the presence of a jet as the source of radio emission, which is consistent with the above-mentioned gas kinematics of NGC 591 obtained at other wavelengths.
NGC 1194 is an S0-a Seyfert 1.9 galaxy. Of the galaxies with a determined nuclear mass in our sample, this galaxy has the most massive nuclear core, = (6.50.3) (Kuo et al. 2011). The position angle of the maser disk is 157° east of north and the inclination is 85°(Kuo et al. 2011). Compact radio emission is detected in our 33 GHz map.
NGC 2273 is an SBa Seyfert 2 galaxy. The H2O maser in NGC 2273 is the least luminous of our sample with L ¡ 10 L⊙. Petitpas & Wilson (2002) reported a nuclear stellar bar with a P.A. of 45° that is located approximately perpendicular to the large-scale galactic bar with a P.A. of 115°. However, Erwin & Sparke (2003) found evidence for a circumnuclear disk. Greene et al. (2013) suggested the presence of an inner ring that manifests itself as a spike in the ellipticity profile of the inclined main galactic body at a galactocentric distance of 150 pc. The dust lanes interior to the ring are most readily identified with spiral arms. In our 33 GHz map we observe extended emission, with a P.A. of 82.8° 2.8°. The P.A. of the maser disk is 153∘ (Kuo et al. 2011), which indicates that our radio continuum and the maser disk are misaligned by 70°.
NGC 2979 is an SABa Seyfert 2 galaxy. Our 33 GHz image shows compact radio continuum emission.
NGC 3393 is an SBa Seyfert 2 galaxy. Fabbiano et al. (2011) reported X-ray (3-8 keV) observations of this system and provided evidence for the existence of a binary black hole system. However, deep Chandra imaging, combined with adaptive optics and radio imaging (Koss et al. 2015), suggest a single heavily obscured radio-bright active galactic nucleus (AGN). VLA observations at 8.6 GHz (A configuration) have shown a system that consists of four radio components; one at the center, one displaced to the southwest, and two very close components to the northeast (see Schmitt et al. 2001). In our 33 GHz observations with approximately the same synthesized beam width, we see three components: one at the center, one toward the southwest, and one located to the northeast. That we see not two sources, like Schmitt et al. (2001) in the latter case, may be due to the limited S/N of this component. Our spectral analysis shows =1.690.1.46 for the central component, =2.663.2 for the northwestern component, and =0.840.29 for the southeastern component. The high uncertainty of the indices for the central and northwestern components do not allow us to draw a conclusion on the nature of the sources. However, an index of 0.840.29 for the southeastern component could be indicative of radio emission from a jet.
NGC 4388 is an Sb edge-on Seyfert 2 galaxy. NGC 4388 is known to have a biconical narrow line region (Pogge 1988; Corbin et al. 1988, Wilson et al. 1993). The maser disk has a P.A. of 107∘ (Kuo et al. 2011). The kiloparsec-scale disk has a P.A. of 90∘ and the more nuclear stellar disk has a P.A. of 75∘ (Greene et al. 2014). Damas-Segovia et al. (2016) reported a southern jet with a scale of 1 kpc. Extended radio emission is observed in our 33 GHz map with a P.A. of 24∘54∘ (Table 4). The large error in the latter value is mainly caused by the bending of the jet, visible in Fig. 1. Thus maser disk and the extended radio emission seen in our data are oriented almost perpendicular to each other.
NGC 5495 is an SABc Seyfert 2 galaxy. H2O maser emission was detected by Kondratko et al. (2006b) with an orbital velocity of 400 km s-1. Gao et al. (2017) reported a P.A. of 176∘5∘ for the maser disk. Compact 33 GHz emission is observed in our map.
NGC 5728 is an SBa Seyfert 2 galaxy. Similar to NGC 4388, this galaxy is known to have a biconical narrow line region (Pogge 1988; Corbin et al. 1988, Wilson et al. 1993). Our 33 GHz map shows compact radio continuum at the central NED position.
UGC 3193 is an SBb galaxy. Extended 33 GHz emission, mainly oriented along an axis from north to south, is observed together with a compact core at the center of our map.
UGC 3789 is an SABa Seyfert 2 galaxy. There is optical evidence for a circumnuclear disk. An inner ring is visible as a spike in the ellipticity profile, and dust lanes are located interior to the ring, which are most readily identified with spiral arms (Greene et al. 2013). The well-studied maser disk traces rotation speeds of up to 750 km s-1 (Braatz & Gugliucci 2008; Braatz et al. 2010; Reid et al. 2013). The MCP has measured an angular-diameter distance of 49.6 5.1 Mpc for this galaxy (Reid et al. 2013), which is compatible with the value given in Table 1. The P.A. of the maser disk is 41° east of north (Kuo et al. 2011). The inner and outer radii of the disk are 0.08 pc and 0.30 pc, respectively. UGC 3789 has a black hole mass of (1.40.05) (Kuo et al. 2011). In addition, Castangia et al. (2013) classified UGC 3789 as a Compton-thick galaxy ( ¿ ). Radio emission is observed at the center of our 33 GHz map. While its nominal P.A. is 117∘22∘ (see Table 4), the 33 GHz radio continuum source is too compact with respect to our resolution to discuss any potential alignments.
5 Analysis and discussion
After reviewing the individual 33 GHz maps, here we discuss our results in more detail. First we analyze the encountered morphologies and spectral indices obtained for the detected sources, and then we discuss possible correlations between various physical quantities by addressing the galaxies and in particular their nuclear regions. In order to do so, we applied linear fits, accounting for errros along both axes, and a Spearman rank correlation test. Slopes and intercepts of the fits, correlation coefficients, and -values, denoting the likelihood that the parameters are unrelated, are shown in a corner of most plots. One purpose of this analysis, in addition to identifying correlations, is to increase the chance of disk-maser detections in future surveys.
5.1 33 GHz morphologies - where are the jets?
As explained in Sect. 4.1, the bulk of our 33 GHz maps contain compact cores and clearly asks for higher resolution studies at lower frequencies, where higher fluxes may be expected. Interestingly, two of the seven sources with 100 Mpc (J1658+3923 and Mrk 1029) show extended emission. Perhaps there is even a third, Mrk 78. Apparently, the linear extent of the central emission can vary strongly, from 50 pc in some compact nearby sources (e.g., NGC 2979) to 600 pc in Mrk 1029. J0350-0127, J1658+3923, and Mrk 78 might show elongated structure, but the S/Ns do not permit a clear interpretation. While some of our most distant sources show structure, the most complex sources, NGC 591, NGC 3393, NGC 4388, and UGC 3193, are with 65 Mpc all relatively nearby. Each of them contains a compact core, but additional compact sources such as in NGC 591 and NGC 3393 indicate the presence of jets. This also holds for the other two objects, NGC 4388 and UGC 3193, where extended emission in the northeast and/or south has been observed. Nevertheless, most sources only exhibit a core component. This implies that in most of our objects jets are either shorter than a few 100 pc, that they are still below our sensitivity limit due to a steep radio spectrum, or that they do not exist at all.
5.2 Spectral indices
Spectral indices can tell us more about the nature of observed radio emission in our sample. For instance, a steep or flat spectral index can be indicative of a jet or radio core, respectively. However, measuring spectral indices for our sources has its own challenges. Using archival data such as NVSS or FIRST, will result in misestimation of spectral indices because of the different beam sizes, which cover different areas (even when we compare the FIRST beam size with our 33 GHz beam size, the ratio of the covered areas is 450). Additional uncertainty in our spectral index estimation is introduced by the possible variability of the nuclear radio emission. Radio variability in active galaxies is a common phenomenon, especially in compact sources (Mundell et al. 2009), which is the case for most of our targets. The variability is observed on a timescale of a few months to several years, and there are cases where the nuclear flux density has changed by 38% over seven years (Mundell et al. 2009). When we consider that our observations and other observations such as NVSS or FIRST were performed in different years (NVSS observations were conducted 16 years before our observations and FIRST observations from 2 to 19 years before), Seyfert variability is another source of uncertainty in our spectral index calculations.
To exclude such errors, we can calculate the spectral indices over the wide bandwidth of the observations. For our sample, we derived the spectral indices assuming a power-law dependence for the continuum flux density given by , using the 8 GHz (29-37 GHz) bandwidth of our observations. By splitting the data into GHz parts and imaging each sub-band separately (with Briggs weighting and a robust parameter of 0), we obtain the spectral indices between 30 GHz and 36 GHz () using fluxes at the central frequencies of the sub-bands. In some cases the S/N was too low and the source was not detected after splitting the data. It should also be noted that the results obtained by this method have significantly higher errors. We also obtained from spectral index maps created by CASA when using the task CLEAN with the number of Taylor coefficients set as 2. For the sources where 1.4 GHz NVSS flux densities (Condon et al. 1998) or 1.4 GHz FIRST flux densities (Becker et al. 1995) were available (Table 2 and 4), the indices were also obtained between 1.4 GHz and 33 GHz.
obtained from CASA, based on 21 sources, has an unweighted mean value of 0.680.28, while for the splitting method we obtained for 16 sources with an unweighted mean value of 0.790.32. For 17 sources the indices were obtained from NVSS and 33 GHz (from now on called ), with a mean (unweighted) value of 0.970.06. For the seven galaxies with measured indices between FIRST and 33 GHz (), the unweighted mean value is 0.730.16 (errors are the standard error of the mean). See Table 4 for spectral index measurement of the individual sources.
5.3 Radio continuum versus H2O disk-maser host galaxy properties
5.3.1 Correlations with optical or near-infrared morphology
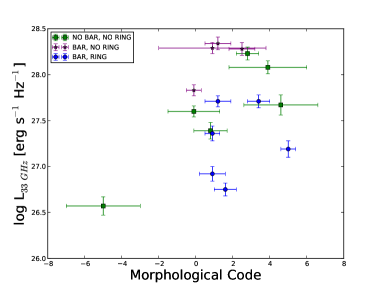
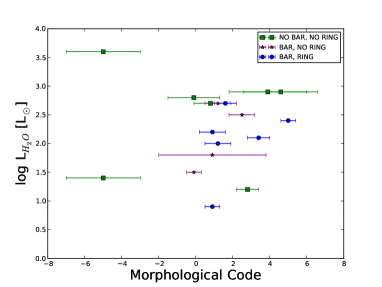
As mentioned before, H2O disk-masers are observed in Seyfert 2s and LINERs (Table 2), that is, in spiral galaxies. We adopted the morphological type in de Vaucouleur’s scale from the HyperLeda101010HyperLeda is a database for physics of galaxies. For more information see: http://leda.univ-lyon1.fr database (Makarov et al. 2014). In this scale, negative numbers represent ellipticals and positive numbers spirals, with higher positive numbers representing later-type spirals. The morphology of the galaxies in our sample lies between S0 and Sc, with the exception of two galaxies that are classified as ellipticals. However, accounting for uncertainties, these could also be S0 galaxies. Fifteen (62%) of our galaxies are barred, and 9 (37%) contain a ring. Figure 5 presents 33 GHz continuum and H2O maser luminosities versus the morphological type. Galaxies with both a bar and a ring in the central parts apparently have lower radio continuum luminosities than those with only a bar. It is well known that in the presence of a bar, gas will be driven inward by angular momentum transport. This transport drives turbulence within the gas that temporarily keeps it strongly gravitationally stable and prevents the onset of rapid star formation. However, at some point, the rotation curve must transition from an approximately flat to an approximately solid body, and the resulting reduction in shear reduces the transport rates and causes gas to build up, eventually producing a gravitationally unstable region, a ring, that is subject to rapid and violent star formation (e.g., Piner et al. 1995; Krumholz & Kruijssen 2015). The region inside the ring might be characterized by a lower rate of inflow, leading to less star formation and synchrotron emission of the ambient gas as well as to a less active nucleus with a lower radio luminosity. We note, however, that our finding is based on small number statistics. Moreover, following the “stuff inside stuff” scenario (Hopkins & Quataert 2010), there may be yet another so far undetected bar inside the ring channeling material closer to the center. Furthermore, not in all our sample galaxies searches for a bar or ring have been performed. Additional morphological studies (see, e.g., Greene et al. 2010; Riffel & Storchi-Bergmann 2011; Greene et al. 2013) would thus be highly desirable.
5.3.2 Position angle and inclination
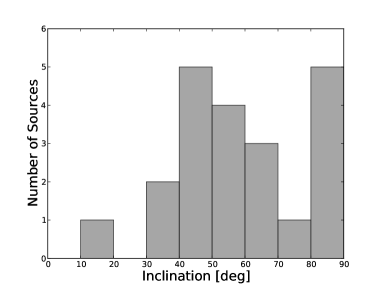
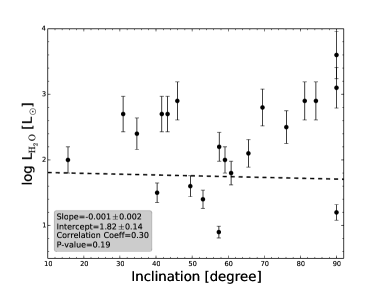
For four galaxies in our sample maser disk inclinations have been reported, with values between 84∘ and 90∘ (Kuo et al. 2011). This inclination range for the maser disk should hold for the entire sample. In spiral galaxies, the inclination of the central region is independent of the inclination of the large-scale disk (Ulvestad & Wilson 1984; Nagar & Wilson 1999; Kinney et al. 2000). Apparently, this is also the case for circumnuclear disks and bars at galactocentric distances of several 100 pc (Greene et al. 2014). Although the inclination of the H2O maser disks of our sample is almost 90∘, the large-scale inclination of their host galaxies can reach any value. In Table 4 we list P.A. and inclination of the galaxies taken from HyperLeda. The distribution of the inclination is displayed in Fig. 6.
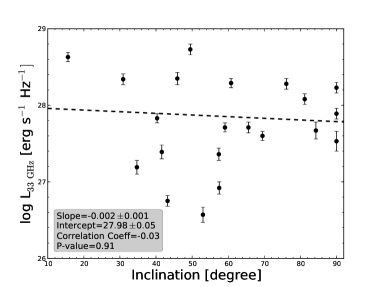
We also checked for possible relations between the H2O maser luminosity and large-scale inclination, and for 33 GHz continuum luminosity and large-scale inclination. As shown in Fig. 7, no correlation is found. Of the four galaxies of our sample in which jet-like features can be identified (NGC 591, NGC 3393, NGC 4388, and UGC 3193; see Fig. 1), one source has also been observed with high resolution by the MCP in the 22 GHz H2O line. This galaxy is NGC 4388, where Kuo et al. (2011) found an edge-on disk with a P.A. (blueshifted side) of 107∘. As stated in Sect. 4.1, our supposed jet with a P.A. = 24∘ 54∘ appears to be perpendicular to the maser disk. Inspecting the image shown in Fig. 1, the formal error in this position angle, accounting for all the emission seen, may well overestimate the actual uncertainty. The other interesting case is NGC 2273 (see again Sect. 4.1 and Fig. 1), where an angle not far from 90∘ is also likely.
5.3.3 Stellar velocity dispersion and circular velocity
The discovery of a correlation between SMBH mass and the velocity dispersion of the bulge component of bright elliptical galaxies, together with similar correlations with bulge luminosity and mass, led to the widespread belief that SMBHs and bulges coevolve by regulating each other’s growth (e.g., Kormendy & Ho 2013). However, by studying less luminous spiral galaxies and making use of the quite accurately determined SMBH masses of H2O megamaser galaxies, it has become clear more recently that the relationship between and velocity dispersion has a larger scatter and more structure than was originally thought (Greene et al. 2010; Sun et al. 2013; Greene et al. 2016). In particular, it seems (although still based on small number statistics) that the megamaser galaxies may show a different scaling relation than galaxies of similar size and Hubble type studied at other wavelengths, possibly indicating an observational bias in either the masing or the non-masing galaxy samples. It is thus essential to look deeper into this apparent scatter to shed more light onto the underlying physics that probably involves inflow, black hole growth, and subsequent feedback.
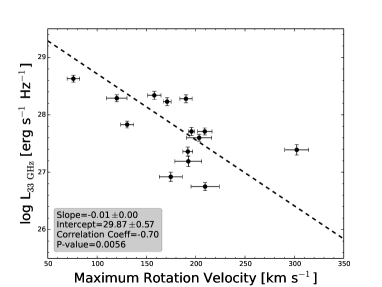
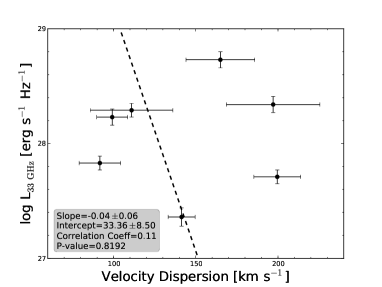
We searched for possible relations between the 33 GHz luminosity, the stellar velocity dispersion , and the maximum rotation velocity of the gas, . As shown in the bottom panel of Fig. 8, and 33 GHz continuum luminosity are not correlated. Surprisingly, however, we find an anticorrelation between the 33 GHz continuum luminosity and circular velocity of the galaxies, with a correlation coefficient of –0.70 and an associated -value of 0.0056. For a better understanding of the implications, we note that the HyperLeda rotation velocities are obtained from Hi 21 cm line data and corrected for the inclination of the main body of the respective galaxy. In spiral galaxies, Hi is most prominent outside the cerntral region, so that here we compare a central parameter with a parameter obtained from emission originating outside of the central region. How can these be related? And why do we find an anticorrelation? The rotation velocity of spirals tends to reach near-maximum values at 2 kpc (e.g., Hlavacek-Larrondo et al. 2011; Chemin et al. 2015), while our images typically cover 1 kpc with most of the detected emission arising from an even smaller region.
Following Safronov (1960), Toomre (1964) and Quirk (1972), for a gaseous differentially rotating disk, the following criterion must hold:
with denoting the velocity dispersion, the epicyclic frequency, and G the gravitational constant. stands for surface density. Thus, a higher rotational velocity keeps the disk more stable and less prone to fragmentation and subsequent star formation, reducing radio continuum emission that is due to star formation. More regular motion may also reduce accretion by the AGN and the luminosity of the radio core. Nevertheless, this may be a far-fetched explanation. Although the correlation is statistically convincing, we find the result surprising, and confirmation is needed by measurements of more such galaxies by employing both lower and higher angular resolution to fully cover the relevant linear scales.
5.3.4 Infrared versus radio luminosity
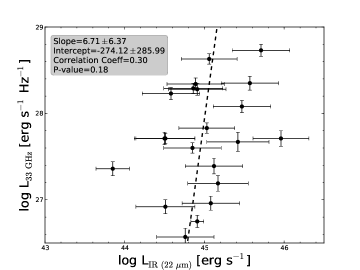
As pointed out by Diamond-Stanic et al. (2009), the radio luminosity can be an indicator of the AGN isotropic luminosity. On the other hand, in Seyfert 2 galaxies, the UV/optical photons of the AGN are absorbed by the circumnuclear dusty torus and are re-emitted in the mid-IR. Therefore the mid-IR photometry can also be used as an indicator of the AGN activity (e.g., Stern et al. 2012; Fiore et al. 2008; Georgantopoulos et al. 2008). Hence we investigate the radio to mid-infrared correlation of our disk-maser sample, since both bands can be indicators of the total AGN power. As shown in Fig. 9, a weak correlation with correlation coefficient of 0.30 is observed.
5.4 Radio continuum, X-ray, and IR luminosities versus maser-disk properties
5.4.1 H2O maser luminosity
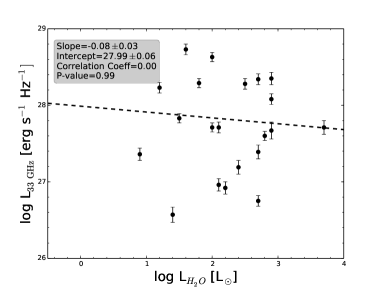
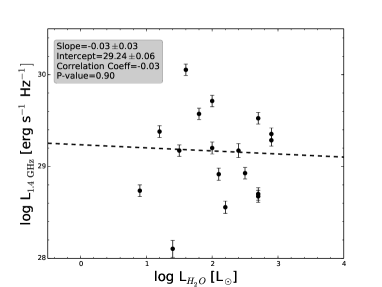
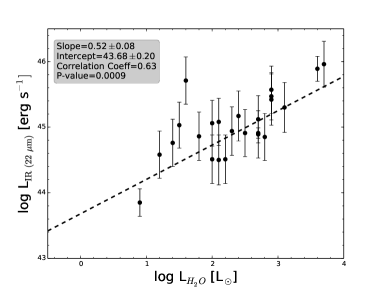
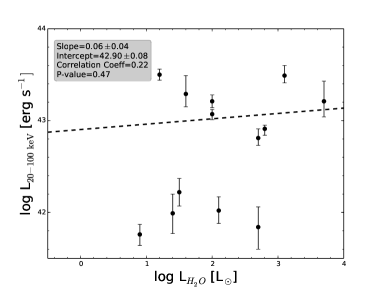
Since the AGN luminosity is most likely the power source for H2O megamasers (Lo 2005), we expect correlations between AGN luminosity and H2O maser luminosity. For example, Henkel et al. (2005) reported a correlation between far-infrared (FIR) and H2O maser flux densities for maser sources that are related to either star-forming regions or AGNs. We also observe a weak correlation between IR and H2O maser luminosity with a correlation coefficient of 0.63. Henkel et al. (2005) proposed that for the case of maser emission associated with AGN, the observed correlation between IR and H2O maser luminosity can be related to the existence of spatially extended dust-rich bars that fuel the central engine. Our observed weak positive correlation between the mass of the central engine and the H2O maser luminosity (see Sect. 5.4.3) may support the suggestions of Henkel et al. (2005). However, we do not detect such a relation between H2O maser and radio (33 GHz and 1.4 GHz) luminosities, or between H2O-maser and hard X-ray luminosities (see Fig. 10).
Van den Bosch et al. (2016) reported a weak correlation between maser and [OIII] luminosities from studying all maser sources, while this correlation vanishes when only the disk masers are considered. Kondratko et al. (2006a) also reported a possible correlation between soft X-ray (2-10 KeV) and maser luminosities, where again most of the correlation is due to the non-disk masers. More investigations to determine possible correlations between soft X-ray (2-10 KeV) and H2O maser luminosity for a sample of 14 disk-maser galaxies were carried out by Castangia et al. (2013). They did not find any correlation either. Following Van den Bosch et al. (2016), the disk-maser galaxies, even though they cover a range of two orders of magnitude in isotropic maser luminosity, may be quite similar with respect to galaxy and SMBH mass. Their properties do not provide a sufficiently broad range of parameters, given the constant surface density predicted by Neufeld et al. (1994) and the similar sizes (0.5 pc) for most of the masing disks. The reason that we do not see correlations between H2O maser and hard X-ray or radio luminosities might be that the small differences in the disk inclination angle and/or different support through seed photons from the nuclear continuum (which are probably responsible for the strong systemic maser features in NGC 4258 (Herrnstein et al. 1998)) may lead to significant scatter that efficiently hides any expected correlation.
5.4.2 Maser-disk radius
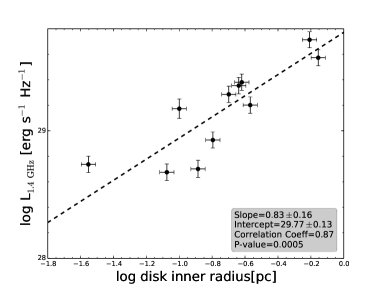
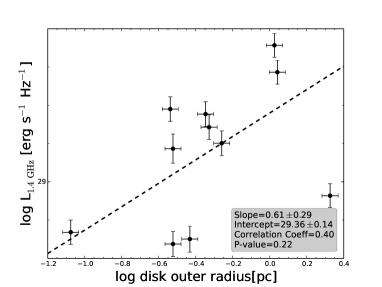
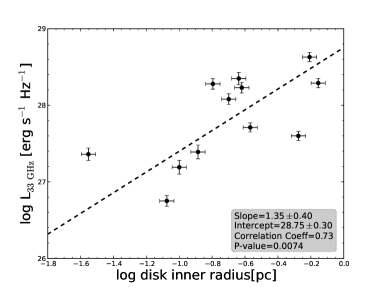
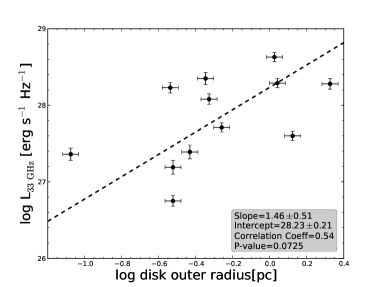
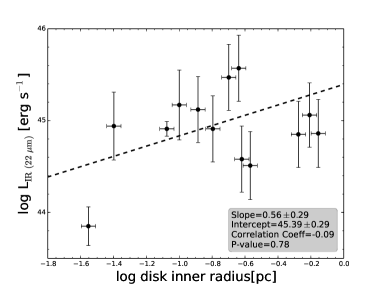
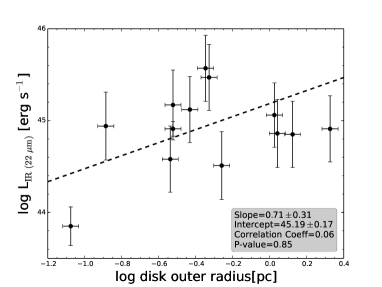
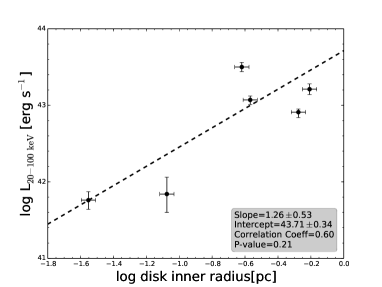
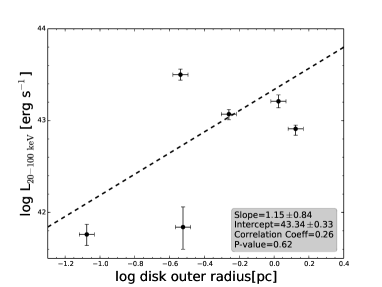
An empirical upper envelope for a scaling relation between and the outer radii of the megamaser disks, = 0.3 /107 M⊙, was reported by Wardle & Yusef-Zadeh (2012) for 12 disk maser sources. We have searched for additional relations associated with disk radii (see Table 4), addressing a connection to radio, IR, and X-ray luminosity. Recently, Masini et al. (2016) have searched for correlations between the ratio of inner and outer radii and X-ray luminosity in the 2-10 keV band for 14 disk-maser sources. They did not find any clear correlation.
Although it is more plausible to see correlations at high radio frequencies (where mainly the core that is directly related to the AGN may be seen) than at low frequencies (where the possible presence of jets with steep spectra might cause the emission to be less correlated with the maser disk size), we do not find a large difference (see Fig. 11). The strongest correlations apparently belong to the radio luminosities versus the disk inner radius (correlation coefficients of 0.87 and 0.73 for 1.4 GHz and 33 GHz, respectively) and disk outer radius (correlation coefficients of 0.40 and 0.54 for 1.4 GHz and 33 GHz, respectively). Generally, as seen in Fig. 11, the disk inner radii show stronger correlations with luminosity than the disk outer radii.
This may suggest that the core has a greater influence at the inner than at the outer radii, where disk warping, star formation, or peculiar density distributions may reduce the direct impact of the SMBH. However, Gao et al. (2017) found a correlation between maser disk outer radius (and not the inner radius) and WISE IR luminosity at Band 3 (=12 m), with a Spearman rank correlation coefficient of 0.83.
Within this context, it should be noted that our radio luminosities trace the 100 pc scale, so that any relation with properties of sub-pc maser disks requires follow-up investigations with higher resolution.
5.4.3 Black hole masses
As mentioned in Sect. 5.3.3, relations between and other properties of galaxies have extensively been studied in recent decades (e.g., Kormendy & Ho 2013). Accurate measures of the black hole masses are essential to study such relations.
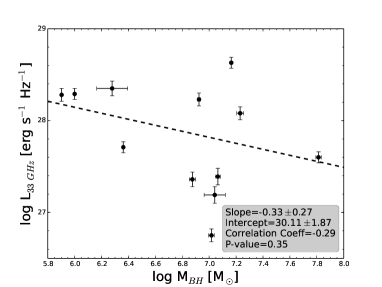
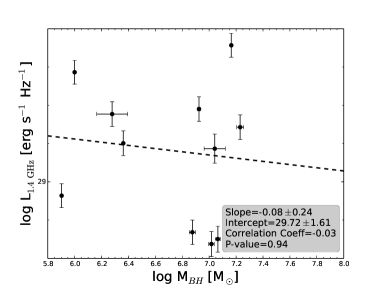
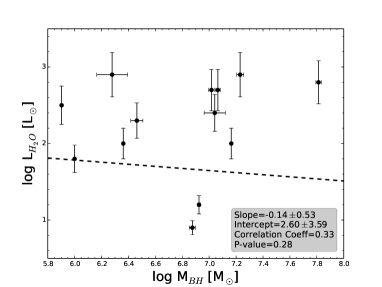
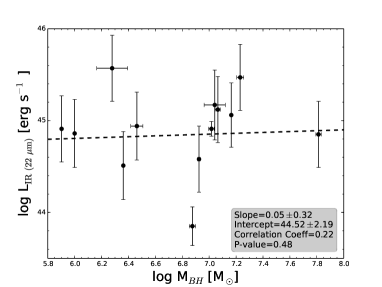
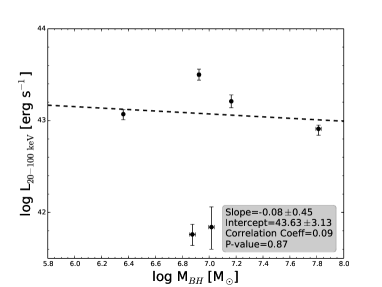
In nearby galaxies, VLBI observations of masers with high angular resolution provide a direct and precise measurement of the (see Miyoshi et al. 1995; Herrnstein et al. 1999; Humphreys et al. 2013). The MCP has provided precise measures of the for 13 galaxies (Kuo et al. 2011; Braatz et al. 2015a; Gao et al. 2017). In Fig. 13 we present versus the continuum luminosity for these galaxies. The strongest correlation is seen for H2O maser luminosity versus with a correlation coefficient of 0.33. For continuum luminosities, no significant correlation is observed. We should nevertheless keep in mind that a sample of 13 galaxies is small for statistical considerations.
6 Summary
VLA observations of 24 mostly Seyfert 2 galaxies with edge-on H2O megamaser disks were obtained at Ka band (29–37 GHz) to investigate the radio continuum emission from the center of these galaxies with 0.2-0.5 arcsec resolution. With respect to the distance distribution of the sample galaxies, this corresponds to a linear resolution on the order of 100 pc. Out of 24 galaxies, 21 show radio emission at a 4.5 or higher level, giving a detection rate of 87%. Almost all of the galaxies contain compact cores with beam-convolved (and deconvolved) major axes smaller than 2.5 times the beam major axis, which even holds for most of the sources with more complex structure. NGC 591 exhibits two main components, and NGC 3393 even three main components, which is indicative of 100 pc scale radio jets. Four additional galaxies have extended structure, possibly also revealing jet-like features, but the majority shows a single compact emission region.
The radio continuum luminosity at 1.4 GHz, 22 GHz H2O maser luminosity, infrared luminosity (22 m), the hard X-ray luminosity (20-100 keV), optical or near-infrared morphology, position angle and inclination of the host galaxies, and their stellar velocity dispersions and circular velocities, maser-disk radii and black hole masses were taken into account for the further analysis of disk-maser host galaxy properties, as summarized below.
Only for one source in our sample with a jet-like 33 GHz continuum feature (NGC 4388) is the H2O maser-disk orientation known. The relative orientation appears to be orthogonal. NGC 2273 may show a similar scenario, but here alignments are less certain. Galaxies with inner rings appear to exhibit less 33 GHz emission than those without. The maximum rotation velocity of the disk-maser host galaxies appears to be anticorrelated with 33 GHz radio continuum luminosities, with a Spearman rank correlation coefficient of –0.70. The 33 GHz radio continuum shows a weak correlation with IR luminosity at 22 m derived from the WISE satellite. The H2O maser luminosity does not exhibit any correlations with the radio (1.4 GHz and 33 GHz) or hard X-ray luminosities. The black hole masses show stronger correlations with the H2O maser luminosity than with the 1.4 GHz, 33 GHz, or hard X-ray luminosities. The H2O maser-disk inner radii show stronger correlations with 1.4 GHz, 33 GHz, and hard X-ray luminosities than the disk outer radii. The strongest correlation is found with low-frequency 1.4 GHz radio data.
Further studies with higher spatial resolution would be highly desirable to reveal the nature of the detected 33 GHz continuum sources, to identify and map jets
on scales 100 pc, and to better distinguish between radio emission arising from the AGN and that from surrounding star-forming regions.
| Spectral indices | Galaxy scale | This work | Maser disk | ||||||||||
| Galaxy | P.A. | Inclination | P.A. | P.A. | Inclination | ref | |||||||
| (°) | (°) | (°) | (°) | (°) | (pc) | (pc) | (107M⊙) | ||||||
| ESO558-G009 | 0.88 0.02 | … | 1.110.94 | 0.760.22 | 8.0 | 81.2 | 15533 | 256 | 98 | 0.20 | 0.47 | 1.7 | 1 |
| IC 0485 | … | … | … | … | 153.9 | 90.0 | … | … | … | … | … | … | … |
| IC 2560 | 0.88 0.02 | … | 1.310.88 | 0.880.21 | 45.7 | 65.6 | 2511 | … | … | … | … | … | … |
| J0126-0417 | … | … | -2.062.58 | 0.872.34 | 100.0 | … | 14686 | … | … | … | … | … | … |
| J0350-0127 | … | … | … | -2.634.32 | 155.0 | … | 134.68.1 | … | … | … | … | … | … |
| J0437+2456 | … | … | … | … | … | … | … | 20 | 81 | 0.04 | 0.13 | 0.29 | 1 |
| J0437+6637 | 1.12 0.08 | … | … | -0.521.58 | 117.0 | 53.0 | … | … | … | … | … | … | … |
| J0836+3327 | … | … | … | … | 51.6 | 57.7 | … | … | … | … | … | … | … |
| J1658+3923 | … | 0.950.07 | … | 2.362.77 | 104.3 | 90.0 | 81.44.7 | … | … | … | … | … | … |
| Mrk 0001 | 0.93 0.01 | … | 1.060.30 | 0.930.06 | 77.5 | 60.8 | 119.62.1 | … | … | 0.70 | 1.10 | 1.0 | 2 |
| Mrk 0078 | 0.96 0.02 | … | 0.820.58 | 1.010.17 | 87.0 | 49.5 | 8110 | … | … | … | … | … | … |
| Mrk 1029 | 0.73 0.04 | 0.610.04 | … | 0.722.37 | 73.5 | 45.9 | 5911 | 218 | 79 | 0.23 | 0.45 | 0.19 | 1 |
| Mrk 1210 | 0.79 0.01 | … | 0.030.08 | -0.120.93 | 160.0 | 15.6 | 17983 | … | … | 0.62 | 1.06 | 14.6 | 2 |
| Mrk 1419 | 0.96 0.06 | 0.840.05 | 3.0 2.72 | -0.671.92 | 40.2 | 41.5 | 11784 | 229 | 89 | 0.13 | 0.37 | 1.16 | 3 |
| NGC 0591 | 0.98 0.02 | … | 2.471.49 | 1.311.60 | 0.2 | 40.3 | 153.32.8 | … | … | … | … | … | … |
| NGC 1194 | … | 0.100.03 | -0.200.63 | -0.250.27 | 139.3 | 71.1 | 7582 | 157 | 85 | 0.54 | 1.33 | 6.5 | 3 |
| NGC 2273 | 1.00 0.04 | … | 0.551.13 | 1.861.15 | 63.3 | 57.4 | 82.82.8 | 153 | 84 | 0.028 | 0.084 | 0.75 | 3 |
| NGC 2979 | 1.19 0.04 | … | 0.911.94 | 0.650.92 | 21.0 | 57.5 | 13851 | … | … | … | … | … | … |
| NGC 3393 | 0.87 0.03 | … | 1.020.26 | 2.103.18 | 12.8 | 30.9 | 16550 | … | … | … | … | … | … |
| NGC 4388 | 0.84 0.02 | 0.52 0.02 | -0.100.22 | 3.363.58 | 91.1 | 90.0 | 2454 | 107 | … | 0.24 | 0.29 | 0.84 | 3 |
| NGC 5495 | 1.44 0.06 | … | … | 0.431.38 | 44.5 | 34.7 | 16724 | 176 | 95 | 0.10 | 0.30 | 1.1 | 1 |
| NGC 5728 | 1.09 0.02 | … | -1.260.37 | -1.530.17 | 14.5 | 59.1 | … | … | … | 0.27 | 0.55 | 2.3 | 2 |
| UGC 3193 | 0.47 0.02 | … | 2.081.12 | 0.961.92 | 177.4 | 76.1 | 167.24 | … | … | 0.16 | 2.12 | 0.8 | 2 |
| UGC 3789 | 1.40 0.04 | 1.340.03 | 1.894.26 | 2.831.76 | 166.0 | 43.2 | 11722 | 41 | ¿88 | 0.084 | 0.30 | 1.04 | 3 |
Notes. Column 1: source name. Column 2: spectral indices between NVSS 1.4 GHz and 33 GHz, with uncertainties. Column 3: spectral indices between FIRST 1.4 GHz and 33 GHz, with uncertainties. Columns 4 and 5: spectral indices between 30 GHz and 36 GHz from our 8 GHz bandwidth observations, first by splitting the data and second by setting the Taylor coefficients as two in CASA (see Sect. 5.2). Column 6 and 7: large scale position angle and inclination (from HyperLeda database). Column 8: position angle of the 33 GHz continuum component with formal errors, obtained from Gaussian fits to a region containing all the significant emission. Columns 9 and 10: maser disk position angle and inclination. Columns 11 and 12: maser disk inner and outer radii in pc. Column 13: black hole mass. Column 14: references for disk maser radii and : (1) Gao et al. (2017); (2) Braatz et al. (2015b); (3) Kuo et al. (2011).
Acknowledgements.
F.K. would like to thank Sergio Dzib Quijano for his useful comments on the data reduction process. This work made use of the NASA/IPAC extragalactic Database (NED), which is operated by the Jet Propulsion Laboratory, California Institute of Technology, under contract with NASA. We further acknowledge the usage of the HyperLeda database (http://leda.univ-lyon1.fr) and the SAO/NASA ADS Astronomy Abstract Service (http://adsabs.harvard.edu) and Kapteyn Package (Terlouw & Vogelaar 2015).References
- Adams (1973) Adams, T. F. 1973, ApJ, 179, 417
- Becker et al. (1995) Becker, R. H., White, R. L., & Helfand, D. J. 1995, ApJ, 450, 559
- Braatz et al. (2015a) Braatz, J., Condon, J., Constantin, A., et al. 2015a, IAU General Assembly, 22, 2255730
- Braatz et al. (2015b) Braatz, J., Condon, J., Constantin, A., et al. 2015b, IAU General Assembly, 22, 2255730
- Braatz & Gugliucci (2008) Braatz, J. A. & Gugliucci, N. E. 2008, ApJ, 678, 96
- Braatz et al. (2004) Braatz, J. A., Henkel, C., Greenhill, L. J., Moran, J. M., & Wilson, A. S. 2004, ApJ, 617, L29
- Braatz et al. (2010) Braatz, J. A., Reid, M. J., Humphreys, E. M. L., et al. 2010, ApJ, 718, 657
- Castangia et al. (2013) Castangia, P., Panessa, F., Henkel, C., Kadler, M., & Tarchi, A. 2013, MNRAS, 436, 3388
- Chemin et al. (2015) Chemin, L., Renaud, F., & Soubiran, C. 2015, A&A, 578, A14
- Cheung et al. (1969) Cheung, A. C., Rank, D. M., Townes, C. H., Thornton, D. D., & Welch, W. J. 1969, Nature, 221, 626
- Condon et al. (1998) Condon, J. J., Cotton, W. D., Greisen, E. W., et al. 1998, AJ, 115, 1693
- Corbin et al. (1988) Corbin, M. R., Baldwin, J. A., & Wilson, A. S. 1988, ApJ, 334, 584
- Damas-Segovia et al. (2016) Damas-Segovia, A., Beck, R., Vollmer, B., et al. 2016, ApJ, 824, 30
- Diamond-Stanic et al. (2009) Diamond-Stanic, A. M., Rieke, G. H., & Rigby, J. R. 2009, ApJ, 698, 623
- Erwin & Sparke (2003) Erwin, P. & Sparke, L. S. 2003, ApJS, 146, 299
- Fabbiano et al. (2011) Fabbiano, G., Wang, J., Elvis, M., & Risaliti, G. 2011, Nature, 477, 431
- Fiore et al. (2008) Fiore, F., Grazian, A., Santini, P., et al. 2008, ApJ, 672, 94
- Gallimore et al. (2001) Gallimore, J. F., Henkel, C., Baum, S. A., et al. 2001, ApJ, 556, 694
- Gao et al. (2017) Gao, F., Braatz, J. A., Reid, M. J., et al. 2017, ApJ, 834, 52
- Georgantopoulos et al. (2008) Georgantopoulos, I., Georgakakis, A., Rowan-Robinson, M., & Rovilos, E. 2008, A&A, 484, 671
- Greene et al. (2010) Greene, J. E., Peng, C. Y., Kim, M., et al. 2010, ApJ, 721, 26
- Greene et al. (2013) Greene, J. E., Seth, A., den Brok, M., et al. 2013, ApJ, 771, 121
- Greene et al. (2016) Greene, J. E., Seth, A., Kim, M., et al. 2016, ApJ, 826, L32
- Greene et al. (2014) Greene, J. E., Seth, A., Lyubenova, M., et al. 2014, ApJ, 788, 145
- Henkel et al. (2005) Henkel, C., Peck, A. B., Tarchi, A., et al. 2005, A&A, 436, 75
- Herrnstein et al. (1998) Herrnstein, J. R., Greenhill, L. J., Moran, J. M., et al. 1998, ApJ, 497, L69
- Herrnstein et al. (1999) Herrnstein, J. R., Moran, J. M., Greenhill, L. J., et al. 1999, Nature, 400, 539
- Hlavacek-Larrondo et al. (2011) Hlavacek-Larrondo, J., Carignan, C., Daigle, O., et al. 2011, MNRAS, 411, 71
- Hopkins & Quataert (2010) Hopkins, P. F. & Quataert, E. 2010, MNRAS, 407, 1529
- Humphreys et al. (2013) Humphreys, E. M. L., Reid, M. J., Moran, J. M., Greenhill, L. J., & Argon, A. L. 2013, ApJ, 775, 13
- Impellizzeri et al. (2008) Impellizzeri, C. M. V., McKean, J. P., Castangia, P., et al. 2008, Nature, 456, 927
- Ishihara et al. (2001) Ishihara, Y., Nakai, N., Iyomoto, N., et al. 2001, PASJ, 53, 215
- Kinney et al. (2000) Kinney, A. L., Schmitt, H. R., Clarke, C. J., et al. 2000, ApJ, 537, 152
- Kondratko et al. (2006a) Kondratko, P. T., Greenhill, L. J., & Moran, J. M. 2006a, ApJ, 652, 136
- Kondratko et al. (2008) Kondratko, P. T., Greenhill, L. J., & Moran, J. M. 2008, ApJ, 678, 87
- Kondratko et al. (2006b) Kondratko, P. T., Greenhill, L. J., Moran, J. M., et al. 2006b, ApJ, 638, 100
- Kormendy & Ho (2013) Kormendy, J. & Ho, L. C. 2013, ARA&A, 51, 511
- Koss et al. (2015) Koss, M. J., Romero-Cañizales, C., Baronchelli, L., et al. 2015, ApJ, 807, 149
- Krumholz & Kruijssen (2015) Krumholz, M. R. & Kruijssen, J. M. D. 2015, MNRAS, 453, 739
- Kuo et al. (2011) Kuo, C. Y., Braatz, J. A., Condon, J. J., et al. 2011, ApJ, 727, 20
- Lo (2005) Lo, K. Y. 2005, ARA&A, 43, 625
- Makarov et al. (2014) Makarov, D., Prugniel, P., Terekhova, N., Courtois, H., & Vauglin, I. 2014, A&A, 570, A13
- Masini et al. (2016) Masini, A., Comastri, A., Baloković, M., et al. 2016, A&A, 589, A59
- Mazzalay & Rodríguez-Ardila (2007) Mazzalay, X. & Rodríguez-Ardila, A. 2007, A&A, 463, 445
- McMullin et al. (2007) McMullin, J. P., Waters, B., Schiebel, D., Young, W., & Golap, K. 2007, in Astronomical Society of the Pacific Conference Series, Vol. 376, Astronomical Data Analysis Software and Systems XVI, ed. R. A. Shaw, F. Hill, & D. J. Bell, 127
- Middelberg et al. (2004) Middelberg, E., Roy, A. L., Nagar, N. M., et al. 2004, A&A, 417, 925
- Miyoshi et al. (1995) Miyoshi, M., Moran, J., Herrnstein, J., et al. 1995, Nature, 373, 127
- Mundell et al. (2009) Mundell, C. G., Ferruit, P., Nagar, N., & Wilson, A. S. 2009, ApJ, 703, 802
- Nagar & Wilson (1999) Nagar, N. M. & Wilson, A. S. 1999, ApJ, 516, 97
- Nakai et al. (1993) Nakai, N., Inoue, M., & Miyoshi, M. 1993, Nature, 361, 45
- Neufeld et al. (1994) Neufeld, D. A., Maloney, P. R., & Conger, S. 1994, ApJ, 436, L.127
- Omar et al. (2002) Omar, A., Dwarakanath, K. S., Rupen, M., & Anantharamaiah, K. R. 2002, A&A, 394, 405
- Pesce et al. (2015) Pesce, D. W., Braatz, J. A., Condon, J. J., et al. 2015, ApJ, 810, 65
- Petitpas & Wilson (2002) Petitpas, G. R. & Wilson, C. D. 2002, ApJ, 575, 814
- Piner et al. (1995) Piner, B. G., Stone, J. M., & Teuben, P. J. 1995, ApJ, 449, 508
- Pogge (1988) Pogge, R. W. 1988, ApJ, 332, 702
- Quirk (1972) Quirk, W. J. 1972, ApJ, 176, L9
- Reid et al. (2013) Reid, M. J., Braatz, J. A., Condon, J. J., et al. 2013, ApJ, 767, 154
- Riffel & Storchi-Bergmann (2011) Riffel, R. A. & Storchi-Bergmann, T. 2011, MNRAS, 417, 2752
- Safronov (1960) Safronov, V. S. 1960, Annales d’Astrophysique, 23, 979
- Sargent (1972) Sargent, W. L. W. 1972, ApJ, 173, 7
- Schmitt et al. (2001) Schmitt, H. R., Ulvestad, J. S., Antonucci, R. R. J., & Kinney, A. L. 2001, ApJS, 132, 199
- Stern et al. (2012) Stern, D., Assef, R. J., Benford, D. J., et al. 2012, ApJ, 753, 30
- Sun et al. (2013) Sun, A.-L., Greene, J. E., Impellizzeri, C. M. V., et al. 2013, ApJ, 778, 47
- Terlouw & Vogelaar (2015) Terlouw, J. P. & Vogelaar, M. G. R. 2015, Kapteyn Package, version 2.3, Kapteyn Astronomical Institute, Groningen, available from http://www.astro.rug.nl/software/kapteyn/
- Toomre (1964) Toomre, A. 1964, ApJ, 139, 1217
- Ulvestad & Wilson (1984) Ulvestad, J. S. & Wilson, A. S. 1984, ApJ, 285, 439
- Van den Bosch et al. (2016) Van den Bosch, R. C. E., Greene, J. E., Braatz, J. A., Constantin, A., & Kuo, C.-Y. 2016, ApJ, 819, 11
- Wardle & Yusef-Zadeh (2012) Wardle, M. & Yusef-Zadeh, F. 2012, ApJ, 750, L38
- White et al. (1997) White, R. L., Becker, R. H., Helfand, D. J., & Gregg, M. D. 1997, ApJ, 475, 479
- Whittle & Wilson (2004) Whittle, M. & Wilson, A. S. 2004, AJ, 127, 606
- Wright et al. (2010) Wright, E. L., Eisenhardt, P. R. M., Mainzer, A. K., et al. 2010, AJ, 140, 1868
- Xanthopoulos et al. (2010) Xanthopoulos, E., Thean, A. H. C., Pedlar, A., & Richards, A. M. S. 2010, MNRAS, 404, 1966
- Yamauchi et al. (2012) Yamauchi, A., Nakai, N., Ishihara, Y., Diamond, P., & Sato, N. 2012, PASJ, 64 [arXiv:1207.6820]
- Zhang et al. (2012) Zhang, J. S., Henkel, C., Guo, Q., & Wang, J. 2012, A&A, 538, A152