A Mathematical Framework for Kinetochore-Driven Activation Feedback in the Mitotic Checkpoint
Abstract
Proliferating cells properly divide into their daughter cells through a process that is mediated by kinetochores, protein-complexes that assemble at the centromere of each sister chromatid. Each kinetochore has to establish a tight bipolar attachment to the spindle apparatus before sister-chromatid separation is initiated. The Spindle Assembly Checkpoint (SAC) links the biophysical attachment status of the kinetochores to mitotic progression, and ensures that even a single misaligned kinetochore keeps the checkpoint active. The mechanism by which this is achieved is still elusive. Current computational models of the human SAC disregard important biochemical properties by omitting any kind of feedback loop, proper kinetochore signals, and other spatial properties such as the stability of the system and diffusion effects. To allow for more realistic in silico study of the dynamics of the SAC model, a minimal mathematical framework for SAC activation and silencing is introduced. A nonlinear ordinary differential equation model successfully reproduces bifurcation signaling switches with attachment of all 92 kinetochores and activation of APC/C by kinetochore-driven feedback. A partial differential equation model and mathematical linear stability analyses indicate the influence of diffusion and system stability. The conclusion is that quantitative models of the human SAC should account for the positive feedback on APC/C activation driven by the kinetochores which is essential for SAC silencing. Experimental diffusion coefficients for MCC sub-complexes are found to be insufficient for rapid APC/C inhibition. The presented analysis allows for systems-level understanding of mitotic control and the minimal new model can function as a basis for developing further quantitative-integrative models of the cell division cycle.
Bashar Ibrahim
Department of Mathematics and Computer Science, University of Jena, Ernst-Abbe-Platz 2, 07743 Jena
1 Introduction
Monitoring the fidelity of chromosome segregation during the cell life cycle relies on transition control mechanisms, called checkpoints, which ensure that all criteria are met before moving on irreversibly to the next phase [49, 23]. The major control mechanism in mitosis is called the Spindle Assembly Checkpoint (SAC; sometimes referred to as the mitotic checkpoint [52]). The SAC ensures that all chromosomes are properly attached to spindle microtubules through their kinetochores. Even a single unattached or mis-attached kinetochore (out of 92 in a human cell) is sufficient to keep the SAC engaged, yet the mechanism by which this is achieved is still elusive [51, 50]. A malfunction in the SAC process can cause aneuploidy and lead to tumorigenesis [55, 18, 6].
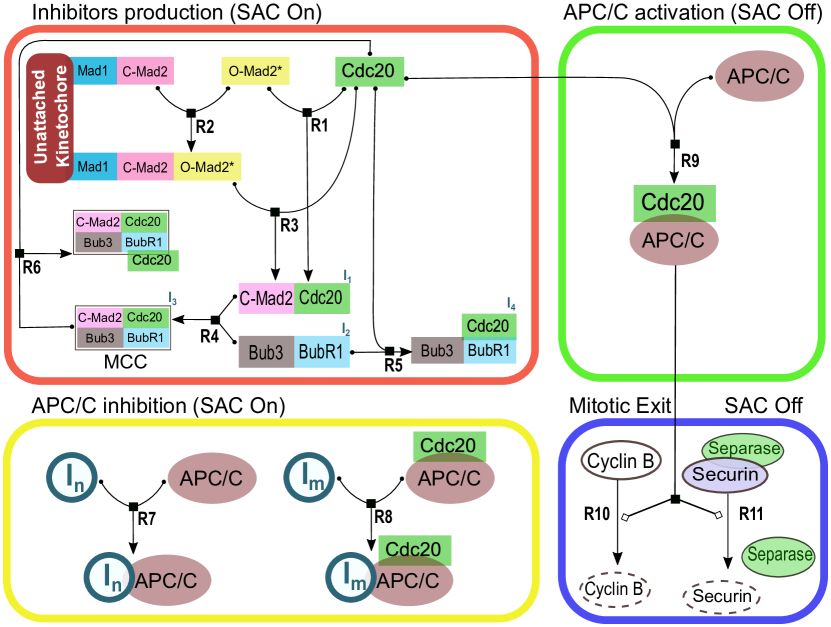
Biochemically, it is thought that unattached or misaligned kinetochores catalyze the formation and broadcasting of a ‘wait’ signal to the environment (cf. Fig. 1, R1-R5). This counters the activation of the ubiquitin ligase anaphase promoting complex/cyclosome (APC/C) by Cdc20. APC/C activity is thought to be inhibited in multiple ways. It can be directly prevented by a potent inhibitor, the Mitotic Checkpoint Complex (MCC), which consists of the four checkpoint proteins Mad2, BubR1, Bub3, and Cdc20 (cf. Fig. 1, R7-R8). Furthermore, it has been suggested that MCC sub-complexes (such as BubR1 and Mad2:Cdc20) interact with APC/C [12, 17]. Another inhibitor, called the mitotic checkpoint factor 2 (MCF2), is associated with APC/C in the checkpoint arrested state but its composition is unknown [10] (cf. Fig. 1, R7). Recent compelling data shows that the MCC itself can bind to Cdc20 that has already bound to APC/C or to a free Cdc20 [31] (cf. Fig. 1, R6). With the exception of MCF2, all complexes inhibiting APC/C rely on the presence of unattached kinetochores for sufficiently rapid formation [23]. Immediately following proper attachment of the final kinetochore to the microtubules, inhibitors rapidly dissolve, ultimately resulting in active APC/C (cf. Fig. 1, R9). APC/C that has been activated by Cdc20 contributes to the degradation of Cyclin B, which is an essential requirement for mitotic exit [23] (cf. Fig. 1, R10).
Simultaneously, APC/C:Cdc20 tags Securin for degradation by proteasome. Securin binds and inhibits Separase, a protease required to cleave Cohesin, which is the glue connecting the two sister-chromatids of each chromosome (cf. Fig. 1, R11). Thus, activation of APC/C by Cdc20 initiates sister-chromatid separation, which marks the transition to mitotic exit. The APC/C activation mechanism is known as SAC silencing, in which APC/C itself plays a role, driven by kinetochores, in the disassembly of its own inhibitors [64, 63]. Additionally, many proteins are also involved in the silencing process, such as P31, UbcH10, and Dynein (see the review [23]).
Both spindle assembly checkpoint activation and silencing are complex and it is difficult to observe their spatial features experimentally. Each SAC component has various localizations and states upon which the interactions depend. And a single small human kinetochore (radius m) has to inhibit all APC/Cs in the cell (average radius m), and after the last attachment, the inhibitors have to be switched off rapidly. Also, kinetochores have dynamical complex structure which change over the cell-cycle phases. Mitotic regulation is also challenging theoretically as computational methods can be hindered by the combinatorial explosion in the number of intermediate components (complexes) and explicit representations. Also, the different components often interact nonlinearly in space and time, and in the presence of various feedback loops, which lead to remarkable phenomena that are difficult to predict [15, 28, 36, 16, 14, 61]. Mathematical models have helped to illuminate fundamental modules of the SAC controls [8, 53, 21, 40, 20, 22, 27, 45, 37, 25, 13, 24, 26, 29, 3]. These models yet conceived SAC activation on details molecular level in order to distinguish between different pathways. However, none of these models have considered SAC silencing, included important properties such as feedback loops (e.g. the APC/C positive feedback activation loop) or have been subjected to stability analyses. In this study, a concise model for both SAC activation and silencing in humans was engineered, accounting for all kinetochore signals and also the APC/C activation loop. Ordinary differential equation (ODE) model simulations were computed, along with a single parameter bifurcation analysis. The effects of important parameters on the dynamics of the system were then studied, followed by a partial differential equation (PDE) model and its linear stability with various parameter values.
2 Mathematical Framework for the SAC Mechanism
2.1 Biochemical Reaction Equations
The SAC model shown in Fig. 1 was manually reduced to a core model that contains three biochemical reaction equations (Eqs. (1-3)) describing the dynamics of the following four species: I (Inhibitor production like Mad2 or Cdc20 or BubR1), I* (cf. MCC), I*:APC/C (or MCC:APC/C), and APC/C. Four additional additional reactions (Eqs. (4-7)) were incorporated to represent the production and degradation of both Cyclin B and Securin. Mathematically, these additional reactions do not affect the overall dynamics. The full biochemical reaction rules describing the SAC system are:
| (1) | |||
| (2) | |||
| (3) | |||
| (4) | |||
| (5) | |||
| (6) | |||
| (7) |
Where Att.-Kin and Un.-Kin refer to attached and unattached kinetochores, respectively. The APC/C positive feedback-loop that is driven by the kinetochore is incorporated in Eq. (3.
2.2 Ordinary Differential Equation Model
The reaction rules (Eqs. (1-7)) can be translated into sets of time-dependent nonlinear ordinary differential equations (ODEs). The translation is done by applying the general principles of mass-action kinetics, computing with state vector , flux vector and stoichiometric matrix . This results in one time-dependent ODE for each species such as Cyclin B or Securin. For example the equation for Cyclin B would be: .
2.3 Partial Differential Equations Model
Adding a diffusion term to each differential equation transforms the system into a set of coupled partial differential equations (PDEs) known as the Reaction-Diffusion system, that are functions of space and time and the following general form:
| (8) |
Where denote concentrations for species . On the right hand side, the first term refers to the diffusion and the second term represents the biochemical reactions for species . The constant coefficient represents its species diffusion. t is time and represents phenomenological parameters. The operator refers to the spatial gradient in spherical coordinates ( ). Recent mathematical models of the SAC mechanism show that spherical symmetry can be used without loss of generality [27, 20], and this form is used here. The system in Eq. (8) reduces to the following PDEs depending on and :
| (9) |
2.4 Numerical Simulations
The ODE models were implemented in the freely-available software package XPPAUT [9] and integrated using a stiff solver. The bifurcation analyses were computed with AUTO [7] using the XPPAUT interface. The PDE reaction-diffusion systems were implemented in matlab (MathWorks) and simulated using the pdepe function. The pdepe solver can handle systems of parabolic and elliptic PDEs in one space variable and time, perfectly matching the presented SAC model. This function uses the method of lines, spatially discretizing the problem in space and converting it to a system of ordinary differential equations that can be solved using the numerical stiff solver ode15s in Matlab [56]. The ode15s ODEs solver can solve the differential-algebraic systems that frequently arise in PDE systems.
The same initial concentrations were applied to all models for comparability and consistency (Table 1). The specific values were chosen according to data from the literature ([60, 57, 11, 19, 34, 48, 58, 38, 59]). The kinetic rate constants were also taken from literature when available (e.g. [33, 41, 5, 43, 24]; Table 1). For the rate constants (, and , see Table 1), several computations with values representing the whole physiologically reasonable parameter range were compared (see Fig. 2D and Fig. 3). The trajectories are discussed in corresponding figures.
2.5 Model Assumptions
In the PDE simulations, the cell is taken to be a sphere with radius . The last unattached kinetochore is modeled as a sub-sphere (radius ) located in the center of the cell. Boundary conditions are assumed to be reflective and the numbers of all interacting elements are assumed to be conserved. The PDEs are assumed to be spherically symmetric. Reactions are considered to follow the mass-action-kinetics law and all rate constants are listed in (Table 1). The initial conditions for the PDEs are correspond to uniform distribution. The reason is that APC/C is found experimentally to be localized at kinetochores, spindles and poles [62, 35] while MCC is found to be localized in both the kinetochores and the cytosol [29]. Thus it is most appropriate to assume a uniform distribution.
3 Results and Discussions
3.1 Ordinary Differential Equation SAC Model
The SAC mechanism (Fig. 1) consists of four modules: Inhibitors production (Fig. 1 red box), APC/C inhibition (Fig. 1 yellow box), APC/C activation (Fig. 1 green box), and mitotic exit (Fig. 1 blue box). This mechanism was reduced to a minimal core model (shaded area shown in Fig. 2A) comprising three reaction equations (R1-R3) that describe the dynamics of four main species: I (represents either Mad2 or Cdc20 or BubR1), I* (cf. MCC), I*:APC/C (or MCC:APC/C), and APC/C. These reactions were translated into a set of coupled nonlinear ordinary differential equations under the assumption of mass action kinetics for all reactions. In order to further reduce the model, the following biochemical assumptions were assumed. The total concentration of APC/C in the system is constant and can be calculated using . The same is true for , using = [I] + [I*] + [I*:APC/C]. For simplicity, the total amount of I* was taken to be =[I*]+[I*:APC/C]. The core SAC system can be written as the following pair of nonlinear ODEs:
| (10) |
| (11) |
Finally, an extended model is generated by adding Cyclin B, Securin, and also presuming that APC/C is in steady state, so that putting the total concentration of [APC/C]tot into the system gives the following full ODE-based model:
| (12) | ||||
| [I*:APC/C] | (13) | |||
| (14) | ||||
| (15) | ||||
| where, | ||||
And refers to the number of unattached kinetochores that have an additional ODE equation: . refers to the number of attached kinetochores and is equal to . It is clear that the addition of Cyclin B and/or Securin does not affect the system’s behavior because these species depend on the active APC/C level.
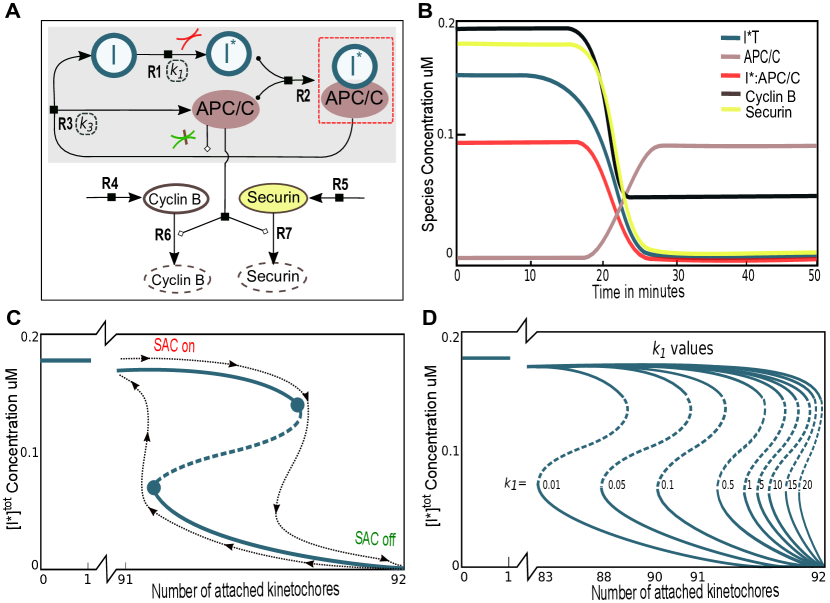
The results of numerical simulations (see Section 2.4) are shown in Fig. 2B. They are consistent with experimental findings in terms of APC/C level and the timing of anaphase [1, 40]. The concentration of APC/C (Fig. 2B brown line) is very low even when a single kinetochore is not attached. After around 18 minutes, the APC/C activity increases rapidly to reach its maximum value. The complexes I*:APC/C (or MCC:APC/C) exhibit behavior that is opposite to that of APC/C (Fig. 2B, red line). I* concentration follows I*:APC/C with a difference only in the initial concentration (Fig. 2B, blue line).
A one parameter bifurcation analysis was performed for the nonlinear ODE-based system (Eqs. 12 and 13). Simulations of the bifurcation curves were performed using the AUTO software (Section 2.4). The desired behavior is a bistable switch influencing the total I* as kinetochores are attached one-by-one. Fig. 2C shows the result, which is a typical S-shape in the number of attached kinetochores as a function of the total concentration of the inhibitor, I*. Solid lines refer to stable nodes while dashed lines refers to the unstable saddles. Stable and unstable states meet at saddle node bifurcation points that are indicated by solid circles. When nearly all kinetochores are attached (91.85 kinetochores), the SAC checkpoint turns off and APC/C is activated rapidly. Total I* falls back to zero as the cell exits from mitosis. The black line indicates how the switch alternates between the SAC-active and SAC-inactive states as the number of attached kinetochores increases. All parameters were taken from Table 1.
In order to determine the sensitivity to parameter values, various ranges of parameter values were examined (Fig. 2D and Fig. 3). The bifurcation diagram is most sensitive to values. The working range is between 0.01 and 30. As increases, the bifurcation point and curve are shifted to the right (Fig. 2D). Low values of (c.f. 0.01) initiate the SAC switch before 83 kinetochores are attached, which could cause grave risk to the cell. All other values higher than 0.5 generate a safe and appropriately-timed switch. values have some minor effects on the system (Fig. 3). Its working values are between 0.01 ad 100. Increasing value to 100 can shift the bifurcation point higher to meet at higher amount of total I*.

3.2 Partial Differential Equation SAC Model
Several studies have indicated the importance of diffusion in the SAC mechanism (e.g. [8], [20]). However, these models represented either smaller budding yeast cells using PDEs or detailed SAC activation using ODEs. Here, a minimal core SAC model represented by PDEs is examined.
Cyclin B and Securin reactions are eliminated because these reactions are the output of active APC/C and cannot affect APC/C regulation. To this end, a second derivative diffusion term was added to the SAC system (Eq.11-Eq.10), which leads to a set of coupled partial differential equations known as a Reaction-Diffusion system with spherical symmetry (Section 2.3):
| (16) |
| (17) |
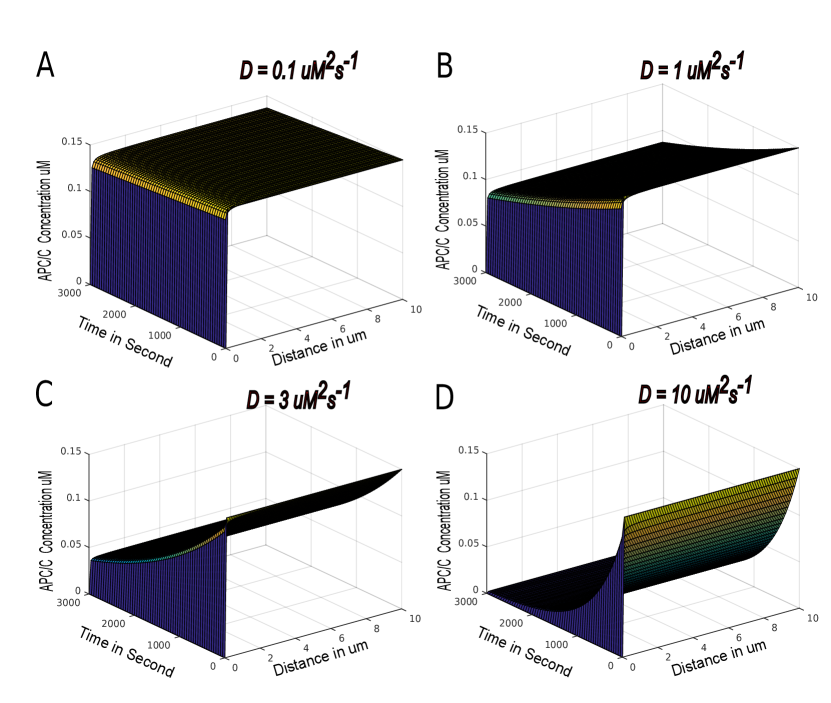
These are supplemented by reflective (Neumann) boundary conditions and assumptions of spherical geometry for the cell and kinetochores (Section 2.5). Numerical simulations of the PDE system (Eq.16-Eq.17) were conducted in matlab. The diffusion coefficient for APC/C is known from the literature (Table 1) while that of MCC (or ) is not. Therefore the simulations were repeated using four different values for the MCC diffusion coefficient, (Table 1 and Fig. 4A-D). One of these values (referred to here as ‘realistic’) is chosen with reference to experimental work on MCC subunits (cf. Mad2, BubR1, Bub2, and Cdc20; see Table 1). The other values span a wide range to allow any effects of diffusion to be observed. Following the idea by Doncic et. al [8], only the last unattached kinetochore was considered. Hence, the parameter was assumed to be constant and to refer only to the last unattached kinetochore (cf. , and ). The aim was to reveal, if the last kinetochore is not yet attached, how fast MCC is able to inhibit high levels of APC/C in the cell.
The simulations show that using a realistic diffusion coefficient for MCC (3),
APC/C is inhibited very slowly after an hour (Fig. 4C).
Using lower diffusion coefficients (1), only 10% of the APC/C level is inhibited (Fig. 4B) while
APC/C is not inhibited at all (Fig. 4A) when using an even lower value (0.1) .
Using a diffusion coefficient higher than the realistic value (10) achieves proper inhibition of APC/C (Fig. 4D).
The conclusions are that a realistic diffusion coefficient is sufficient for inhibiting APC/C, albeit slowly, but a coefficient 2-3 times larger is required for proper SAC functioning.
Thus, it is recommended to use a SAC model based on a PDE model, rather than solely on ODEs, though it is not essential.
3.3 Linear Stability Analysis
As shown in the previous section, a realistic value for the diffusion coefficient does not have a strong effect on the SAC model. However, this does not exclude the possibility that diffusion influences properties of the system such as its stability. To study this, a linear stability analysis was performed on the SAC PDE model (Eqs.16-17).
Taking = [APC/C] + [I*:APC/C], and =[I*]+[I*:APC/C] (or equivalently [I*]=- [APC/C]), the system will be:
| (18) |
| (19) |
Assuming small perturbations on I* and APC/C in standard form (see for example [39]):
| (20) |
| (21) |
where and denote the steady state, and and denote the unsteady-state (or disturbance). Substituting Eqs.20-21 into the PDE system (Eqs.16-17) leads to two separate systems. The linearized equations governing the disturbance system are
| (22) |
| (23) |
where, , is constant, , and . Note that for hydrodynamic stability any second order terms in the disturbance system should be neglected [39]. Since the diffusion coefficient for I* (MCC complex) is unknown, the focus is on I*.
The solution is assumed to be a propagating wave, dependent on both space and time, and given by , and . is the wave number and is the complex speed of the wave where is the important parameter for stability analysis. The disturbance is damped if is negative, whereas for , the disturbance will grow and lead to instability. After simplification, the relation becomes:
always.
This indicates that the system is stable regardless of the value of the diffusion coefficient. The diffusion coefficient plays no major in the SAC model presented here because all kinetic reaction constants are already high.
4 Conclusion
The spindle assembly checkpoint (SAC) regulates the timing of chromosome segregation to prevent the creation of aneuploidy and tumorigenesis [55, 18, 6]. SAC is highly sensitive to kinetochore -microtubule attachment, such that even a single unattached or mis-attached kinetochore can maintain checkpoint activation and keep the APC/C complex inactive. The checkpoint is only silenced when all chromosomes are properly attached to microtubules, after which APC/C is activated and anaphase onset occurs. The mechanism by which SAC activation and silencing is achieved is still largely elusive.
Despite several systems-level mathematical efforts in recent years to model SAC activation, no model has been built with the level of detail in its mathematical abstraction that is crucial for further developments [23]. For example, no model has considered all kinetochore signals. In addition, to the best of our knowledge, there is no model of the SAC that combines both SAC activation and silence, or one that includes any kind of feedback. This is the first work presenting a mathematical analysis that integrates both SAC activation and silencing. The model is minimal in that it contains only four reactions and four species, considers all 92 kinetochore signals, and incorporates kinetochore-driven feedback on APC/C activation (for SAC silencing). The model incorporates differing levels of detail. The ODE-based model was simulated and generated a bifurcation diagram realistic switch behavior over a wide range of parameters. The model was also compared with experimental findings and found to be consistent (Table 2).
Parameters were selected carefully. All models have the same initial concentrations which were chosen according to data from the literature (Table 1). The reaction rate constants were also taken from literature where they were known. For two rate constants , and , several computations were performed using values representing the whole physiologically reasonable parameter range (see Fig. 2D and Fig. 3).
It had been thought that diffusion is required for proper SAC functioning (e.g. [23]). To investigate the role of diffusion, a second level of detail was implemented in a PDE-based reaction-diffusion model. Active transport (or convection) was not considered because there is no experimental evidence for transport of either APC/C or MCC. Active transport is essential for inhibitor formation, which has been studied extensively in the literature and is therefore not considered here. It has been shown both experimentally and mathematically that active transport of O-Mad2 towards the spindle mid-zone increases the efficiency of Mad2-activation in inhibiting Cdc20 [27, 19, 54]. The diffusion coefficient for APC/C is known [65]. The MCC diffusion coefficient is not known but was approximated based on its sub-components (Mad2, Cdc20, BubR1 and Bub3). This value of (3 ) was found to be insufficient for rapid APC/C inhibition. Fast APC/C inhibition, and therefore proper SAC functioning, was found to require a value that was at least twice as high. This may be due to noise in the experimental data or because there is an additional mechanism that increase the rate independent of the kinetochores ([29]).
The mathematical modeling and analysis presented here can serve as a basis for more sophisticated models be used to evaluate novel hypotheses related to mitosis and the cell cycle. A combination of further experimental work and mathematical analysis be necessary to fill in the gaps in our understanding of the cell life cycle.
| Symbol | Fig. 2B, C | Fig. 2D | Fig. 3 | Fig. 4 | Remark | |
| Initial amount | ||||||
| APC/C | 0.09 | 0.09 | 0.09 | 0.09 | [60, 57] | |
| I*(cf. MCC) | 0.15 | 0.15 | 0.15 | 0.15 | [22] | |
| I | 0.15 | 0.15 | 0.15 | 0.15 | [11, 19, 34] | |
| I*:APC/C | 0 | 0 | 0 | 0 | ||
| Cyclin B | 0.2 | 0.2 | 0.2 | 0.2 | [48, 58, 38] | |
| Securin | 0.18 | 0.18 | 0.18 | 0.18 | [59] | |
| U | 92 | 92 | 92 | 92 | [24, 23] | |
| A | 92-U | 92-U | 92-U | 92-U | [24, 23] | |
| Diffusion coefficients | ||||||
| APC/C | 1.8 | [65] | ||||
| I* (cf. MCC) | 0.1-10 | This study | ||||
| I (Cdc20) | 19.5 | [65] | ||||
| I (Mad2) | 5 | [20] | ||||
| I (Mad2:Cdc20) | 4 | [20] | ||||
| I (BubR1:Bub3) | 7.9 | [60, 11] | ||||
| Environment | ||||||
| Radius of the kinetochore | 0.1 | [4] | ||||
| Radius of the cell | 10 | [27] | ||||
| Rate constants | ||||||
| This study | ||||||
| [24] | ||||||
| [24] | ||||||
| This study | ||||||
| [33, 41] | ||||||
| [33, 41] | ||||||
Diffusion for MCC was calculated using , where and are the diffusion coefficients for (Mad2:Cdc20) and (BubR1:Bub3), respectively.
| Type of mutation | Experiment | in-vitro | in-silico | Remarks |
|---|---|---|---|---|
| Wild-Type | - | Low before attachment and high after | Low before attachment and high after | e.g. [5, 49, 23, 24] |
| Mad2 | O | Low | Low | e.g. [32] |
| D | High | High | e.g. [44] | |
| BubR1:Bub3 | O | Low | Low | e.g.[66] |
| D | High | High | e.g.[2] | |
| Cdc20 | O | High | High | e.g.[47] |
| D | Low | Low | e.g.[46] |
D refers to a deletion or knockdown experiment, and O refers to an over-expression experiment. In the simulations the respective initial concentration is set to zero for the deletions, and 10-fold higher concentrations for over-expression.
acknowledgements
This work was supported by the European Commission HIERATIC Grant 062098/14. The author gratefully acknowledges the visiting fund of the Institute for Numerical Simulation (INS) at Bonn University.
References
- [1] Bakhoum, S.F., Genovese, G., Compton, D.A.: Deviant kinetochore microtubule dynamics underlie chromosomal instability. Curr. Biol. 19(22), 1937–1942 (2009)
- [2] Chan, G.K., Jablonski, S.A., Sudakin, V., Hittle, J.C., Yen, T.J.: Human BUBR1 is a mitotic checkpoint kinase that monitors CENP-E functions at kinetochores and binds the cyclosome/APC. J. Cell Biol. 146(5), 941–954 (1999)
- [3] Chen, J., Liu, J.: Spatial-temporal model for silencing of the mitotic spindle assembly checkpoint. Nat Commun 5, 4795 (2014)
- [4] Cherry, L.M., Faulkner, A.J., Grossberg, L.A., Balczon, R.: Kinetochore size variation in mammalian chromosomes: an image analysis study with evolutionary implications. J. Cell. Sci. 92 ( Pt 2), 281–289 (1989)
- [5] De Antoni, A., Pearson, C.G., Cimini, D., Canman, J.C., Sala, V., Nezi, L., Mapelli, M., Sironi, L., Faretta, M., Salmon, E.D., Musacchio, A.: The Mad1/Mad2 complex as a template for Mad2 activation in the spindle assembly checkpoint. Curr. Biol. 15(3), 214–225 (2005)
- [6] Denisenko, T.V., Sorokina, I.V., Gogvadze, V., Zhivotovsky, B.: Mitotic catastrophe and cancer drug resistance: A link that must to be broken. Drug Resistance Updates 24, 1–12 (2016)
- [7] Doedel, E.J.: Auto: A program for the automatic bifurcation analysis of autonomous systems. Congr. Numer 30, 265–284 (1981)
- [8] Doncic, A., Ben-Jacob, E., Barkai, N.: Evaluating putative mechanisms of the mitotic spindle checkpoint. Proc. Natl. Acad. Sci. USA 102(18), 6332–7 (2005)
- [9] Ermentrout, B.: Simulating, analyzing, and animating dynamical systems: a guide to XPPAUT for researchers and students, vol. 14. Siam (2002)
- [10] Eytan, E., Braunstein, I., Ganoth, D., Teichner, A., Hittle, J.C., Yen, T.J., Hershko, A.: Two different mitotic checkpoint inhibitors of the anaphase-promoting complex/cyclosome antagonize the action of the activator Cdc20. Proc. Natl. Acad. Sci. U.S.A. 105(27), 9181–9185 (2008)
- [11] Fang, G.: Checkpoint protein BubR1 acts synergistically with Mad2 to inhibit anaphase-promoting complex. Mol. Biol. Cell 13(3), 755–766 (2002)
- [12] Fang, G., Yu, H., Kirschner, M.W.: The checkpoint protein MAD2 and the mitotic regulator CDC20 form a ternary complex with the anaphase-promoting complex to control anaphase initiation. Genes Dev. 12(12), 1871–1883 (1998)
- [13] Görlich, D., Escuela, G., Gruenert, G., Dittrich, P. Ibrahim, B.: Molecular codes in the human inner-kinetochore model: Relating cenps to function. Biosemiotics 7(2), 223–247 (2014)
- [14] Gruenert, G., Gizynski, K., Escuela, G., Ibrahim, B., Gorecki, J., Dittrich, P.: Understanding networks of computing chemical droplet neurons based on information flow. International journal of neural systems 25(07), 1450,032 (2015)
- [15] Gruenert, G., Ibrahim, B., Lenser, T., Lohel, M., Hinze, T., Dittrich, P.: Rule-based spatial modeling with diffusing, geometrically constrained molecules. BMC Bioinformatics 11 (2010)
- [16] Gruenert, G., Szymanski, J., Holley, J., Escuela, G., Diem, A., Ibrahim, B., Adamatzky, A., Gorecki, J., Dittrich, P.: Multi-scale modelling of computers made from excitable chemical droplets. International Journal of Unconventional Computing 9(3-4), 237–266 (2013)
- [17] Han, J.S., Holland, A.J., Fachinetti, D., Kulukian, A., Cetin, B., Cleveland, D.W.: Catalytic assembly of the mitotic checkpoint inhibitor BubR1-Cdc20 by a Mad2-induced functional switch in Cdc20. Mol. Cell 51(1), 92–104 (2013)
- [18] Holland, A.J., Cleveland, D.W.: Boveri revisited: chromosomal instability, aneuploidy and tumorigenesis. Nat. Rev. Mol. Cell Biol. 10(7), 478–87 (2009)
- [19] Howell, B.J., Hoffman, D.B., Fang, G., Murray, A.W., Salmon, E.D.: Visualization of Mad2 dynamics at kinetochores, along spindle fibers, and at spindle poles in living cells. J. Cell Biol. 150(6), 1233–1250 (2000)
- [20] Ibrahim, B.: In silico spatial simulations reveal that mcc formation and excess bubr1 are required for tight inhibition of the anaphase-promoting complex. Mol. BioSyst. (2015). DOI 10.1039/C5MB00395D
- [21] Ibrahim, B.: Spindle assembly checkpoint is sufficient for complete cdc20 sequestering in mitotic control. Comput Struct Biotechnol J 13, 320–328 (2015)
- [22] Ibrahim, B.: Systems Biology Modeling of Five Pathways for Regulation and Potent Inhibition of the Anaphase-Promoting Complex (APC/C): Pivotal Roles for MCC and BubR1. OMICS 19(5), 294–305 (2015)
- [23] Ibrahim, B.: Toward a systems-level view of mitotic checkpoints. Prog. Biophys. Mol. Biol. 117(2-3), 217–224 (2015)
- [24] Ibrahim, B., Diekmann, S., Schmitt, E., Dittrich, P.: In-silico modeling of the mitotic spindle assembly checkpoint. PLoS ONE 3(2) (2008)
- [25] Ibrahim, B., Dittrich, P., Diekmann, S., Schmitt, E.: Stochastic effects in a compartmental model for mitotic checkpoint regulation. Journal of Integrative Bioinformatics 4(3), 66 (2007)
- [26] Ibrahim, B., Dittrich, P., Diekmann, S., Schmitt, E.: Mad2 binding is not sufficient for complete cdc20 sequestering in mitotic transition control (an in silico study). Biophysical Chemistry 134(1-2), 93–100 (2008)
- [27] Ibrahim, B., Henze, R.: Active transport can greatly enhance Cdc20:Mad2 formation. Int J Mol Sci 15(10), 19,074–19,091 (2014)
- [28] Ibrahim, B., Henze, R., Gruenert, G., Egbert, M.M., Huwald, J., Dittrich, P.: Rule-based modeling in space for linking heterogeneous interaction data to large-scale dynamical molecular complexes. Cells 2, 506–544 (2013)
- [29] Ibrahim, B., Schmitt, E., Dittrich, P., Diekmann, S.: In silico study of kinetochore control, amplification, and inhibition effects in mcc assembly. BioSystems 95(1), 35–50 (2009)
- [30] Irniger, S.: Cyclin destruction in mitosis: a crucial task of Cdc20. FEBS Lett. 532(1-2), 7–11 (2002)
- [31] Izawa, D., Pines, J.: The mitotic checkpoint complex binds a second CDC20 to inhibit active APC/C. Nature 517(7536), 631–634 (2015)
- [32] Kabeche, L., Compton, D.A.: Checkpoint-independent stabilization of kinetochore-microtubule attachments by Mad2 in human cells. Curr. Biol. 22(7), 638–644 (2012)
- [33] Kamenz, J., Mihaljev, T., Kubis, A., Legewie, S., Hauf, S.: Robust Ordering of Anaphase Events by Adaptive Thresholds and Competing Degradation Pathways. Mol. Cell 60(3), 446–459 (2015)
- [34] Kastl, J., Braun, J., Prestel, A., Moller, H.M., Huhn, T., Mayer, T.U.: Mad2 Inhibitor-1 (M2I-1): A Small Molecule Protein-Protein Interaction Inhibitor Targeting the Mitotic Spindle Assembly Checkpoint. ACS Chem. Biol. 10(7), 1661–1666 (2015)
- [35] Kraft, C., Herzog, F., Gieffers, C., Mechtler, K., Hagting, A., Pines, J., Peters, J.M.: Mitotic regulation of the human anaphase-promoting complex by phosphorylation. EMBO J. 22(24), 6598–6609 (2003)
- [36] Kreyssig, P., Escuela, G., Reynaert, B., Veloz, T., Ibrahim, B., Dittrich, P.: Cycles and the qualitative evolution of chemical systems. PLoS ONE 7(10), e45,772 (2012)
- [37] Kreyssig, P., Wozar, C., Peter, S., Veloz, T., Ibrahim, B., Dittrich, P.: Effects of small particle numbers on long-term behaviour in discrete biochemical systems. Bioinformatics 30(17), i475–481 (2014)
- [38] Lindqvist, A., van Zon, W., Karlsson Rosenthal, C., Wolthuis, R.M.: Cyclin B1-Cdk1 activation continues after centrosome separation to control mitotic progression. PLoS Biol. 5(5), e123 (2007)
- [39] Logan, J.: Applied mathematics. Wiley, New York (1997)
- [40] Lohel, M., Ibrahim, B., Diekmann, S., Dittrich, P.: The role of localization in the operation of the mitotic spindle assembly checkpoint. Cell Cycle 8(16), 2650–2660 (2009)
- [41] Lu, D., Girard, J.R., Li, W., Mizrak, A., Morgan, D.O.: Quantitative framework for ordered degradation of APC/C substrates. BMC Biol. 13, 96 (2015)
- [42] Luo, X., Tang, Z., Xia, G., Wassmann, K., Matsumoto, T., Rizo, J., Yu, H.: The Mad2 spindle checkpoint protein has two distinct natively folded states. Nat. Struct. Mol. Biol. 11(4), 338–345 (2004)
- [43] Mapelli, M., Filipp, F.V., Rancati, G., Massimiliano, L., Nezi, L., Stier, G., Hagan, R.S., Confalonieri, S., Piatti, S., Sattler, M., Musacchio, A.: Determinants of conformational dimerization of Mad2 and its inhibition by p31comet. EMBO J. 25(6), 1273–1284 (2006)
- [44] Michel, L.S., Liberal, V., Chatterjee, A., Kirchwegger, R., Pasche, B., Gerald, W., Dobles, M., Sorger, P.K., Murty, V.V., Benezra, R.: MAD2 haplo-insufficiency causes premature anaphase and chromosome instability in mammalian cells. Nature 409(6818), 355–359 (2001)
- [45] Mistry, H.B., MacCallum, D.E., Jackson, R.C., Chaplain, M.A., Davidson, F.A.: Modeling the temporal evolution of the spindle assembly checkpoint and role of Aurora B kinase. Proc. Natl. Acad. Sci. U.S.A. 105(51), 20,215–20,220 (2008)
- [46] Mondal, G., Baral, R.N., Roychoudhury, S.: A new Mad2-interacting domain of Cdc20 is critical for the function of Mad2-Cdc20 complex in the spindle assembly checkpoint. Biochem. J. 396(2), 243–253 (2006)
- [47] Mondal, G., Sengupta, S., Panda, C.K., Gollin, S.M., Saunders, W.S., Roychoudhury, S.: Overexpression of Cdc20 leads to impairment of the spindle assembly checkpoint and aneuploidization in oral cancer. Carcinogenesis 28(1), 81–92 (2007)
- [48] Moore, J.D., Kirk, J.A., Hunt, T.: Unmasking the S-phase-promoting potential of cyclin B1. Science 300(5621), 987–990 (2003)
- [49] Musacchio, A., Salmon, E.D.: The spindle-assembly checkpoint in space and time. Nat. Rev. Mol. Cell Biol. 8, 379–393 (2007)
- [50] Rieder, C.L., Cole, R.W., Khodjakov, A., Sluder, G.: The checkpoint delaying anaphase in response to chromosome monoorientation is mediated by an inhibitory signal produced by unattached kinetochores. J. Cell Biol. 130(4), 941–948 (1995)
- [51] Rieder, C.L., Schultz, A., Cole, R., Sluder, G.: Anaphase onset in vertebrate somatic cells is controlled by a checkpoint that monitors sister kinetochore attachment to the spindle. J. Cell Biol. 127(5), 1301–1310 (1994)
- [52] Rudner, A.D., Murray, A.W.: The spindle assembly checkpoint. Curr. Opin. Cell Biol. 8(6), 773–780 (1996)
- [53] Sear, R.P., Howard, M.: Modeling dual pathways for the metazoan spindle assembly checkpoint. Proc. Natl. Acad. Sci. U.S.A. 103(45), 16,758–16,763 (2006)
- [54] Silva, P.M., Reis, R.M., Bolanos-Garcia, V.M., Florindo, C., Tavares, A.A., Bousbaa, H.: Dynein-dependent transport of spindle assembly checkpoint proteins off kinetochores toward spindle poles. FEBS Lett. 588(17), 3265–3273 (2014)
- [55] Morais da Silva, S., Moutinho-Santos, T., Sunkel, C.E.: A tumor suppressor role of the Bub3 spindle checkpoint protein after apoptosis inhibition. J. Cell Biol. 201(3), 385–393 (2013)
- [56] Skeel, R.D., Berzins, M.: A method for the spatial discretization of parabolic equations in one space variable. SIAM journal on scientific and statistical computing 11(1), 1–32 (1990)
- [57] Stegmeier, F., Rape, M., Draviam, V.M., Nalepa, G., Sowa, M.E., Ang, X.L., McDonald, E.R., Li, M.Z., Hannon, G.J., Sorger, P.K., Kirschner, M.W., Harper, J.W., Elledge, S.J.: Anaphase initiation is regulated by antagonistic ubiquitination and deubiquitination activities. Nature 446(7138), 876–881 (2007)
- [58] Stemmann, O., Zou, H., Gerber, S.A., Gygi, S.P., Kirschner, M.W.: Dual inhibition of sister chromatid separation at metaphase. Cell 107(6), 715–726 (2001)
- [59] Sun, Y., Kucej, M., Fan, H.Y., Yu, H., Sun, Q.Y., Zou, H.: Separase is recruited to mitotic chromosomes to dissolve sister chromatid cohesion in a DNA-dependent manner. Cell 137(1), 123–132 (2009)
- [60] Tang, Z., Bharadwaj, R., Li, B., Yu, H.: Mad2-Independent inhibition of APCCdc20 by the mitotic checkpoint protein BubR1. Dev. Cell 1(2), 227–237 (2001)
- [61] Tschernyschkow, S., Herda, S., Gruenert, G., Doring, V., Gorlich, D., Hofmeister, A., Hoischen, C., Dittrich, P., Diekmann, S., Ibrahim, B.: Rule-based modeling and simulations of the inner kinetochore structure. Prog. Biophys. Mol. Biol. 113(1), 33–45 (2013)
- [62] Tugendreich, S., Tomkiel, J., Earnshaw, W., Hieter, P.: CDC27Hs colocalizes with CDC16Hs to the centrosome and mitotic spindle and is essential for the metaphase to anaphase transition. Cell 81(2), 261–268 (1995)
- [63] Uzunova, K., Dye, B.T., Schutz, H., Ladurner, R., Petzold, G., Toyoda, Y., Jarvis, M.A., Brown, N.G., Poser, I., Novatchkova, M., Mechtler, K., Hyman, A.A., Stark, H., Schulman, B.A., Peters, J.M.: APC15 mediates CDC20 autoubiquitylation by APC/C(MCC) and disassembly of the mitotic checkpoint complex. Nat. Struct. Mol. Biol. 19(11), 1116–1123 (2012)
- [64] Varetti, G., Guida, C., Santaguida, S., Chiroli, E., Musacchio, A.: Homeostatic control of mitotic arrest. Molecular cell 44(5), 710–720 (2011)
- [65] Wang, Z., Shah, J.V., Berns, M.W., Cleveland, D.W.: In vivo quantitative studies of dynamic intracellular processes using fluorescence correlation spectroscopy. Biophysical journal 91(1), 343–351 (2006)
- [66] Yamamoto, Y., Matsuyama, H., Chochi, Y., Okuda, M., Kawauchi, S., Inoue, R., Furuya, T., Oga, A., Naito, K., Sasaki, K.: Overexpression of BUBR1 is associated with chromosomal instability in bladder cancer. Cancer Genet. Cytogenet. 174(1), 42–47 (2007)