NIHAO XIV: Reproducing the observed diversity of dwarf galaxy rotation curve shapes in CDM
Abstract
The significant diversity of rotation curve (RC) shapes in dwarf galaxies has recently emerged as a challenge to CDM: in dark matter (DM) only simulations, DM halos have a universal cuspy density profile that results in self-similar RC shapes. We compare RC shapes of simulated galaxies from the NIHAO project with observed galaxies from the homogeneous SPARC dataset. The DM halos of the NIHAO galaxies can expand to form cores, with the degree of expansion depending on their stellar-to-halo mass ratio. By means of the relation (where is the outermost measured rotation velocity), we show that both the average trend and the scatter in RC shapes of NIHAO galaxies are in reasonable agreement with SPARC: this represents a significant improvement compared to simulations that do not result in DM core formation, suggesting that halo expansion is a key process in matching the diversity of dwarf galaxy RCs. Note that NIHAO galaxies can reproduce even the extremely slowly rising RCs of IC 2574 and UGC 5750. Revealingly, the range where observed galaxies show the highest diversity corresponds to the range where core formation is most efficient in NIHAO simulations, 50/km s-1100. A few observed galaxies in this range cannot be matched by any NIHAO RC nor by simulations that predict a universal halo profile. Interestingly, the majority of these are starbursts or emission-line galaxies, with steep RCs and small effective radii. Such galaxies represent an interesting observational target providing new clues to the process/viability of cusp-core transformation, the relationship between starburst and inner potential well, and the nature of DM.
keywords:
galaxies: evolution – formation – haloes cosmology: theory – dark matter1 Introduction
A well established outcome of the -cold dark matter (CDM) cosmological model is the self-similarity of dark matter (DM) halos that host galaxies: their density distribution is described by a steep, ‘cuspy’ profile, introduced 20 years ago by Navarro et al. (1997). Although numerical simulations based on the CDM paradigm can reproduce the clustering of cosmic structures on large scales (Klypin et al., 2016) and the two and three-point correlation functions of galaxies (Guo et al., 2016a, b; Rodríguez-Torres et al., 2016), these cuspy halos are at odds with the internal structure of many dwarf galaxies, as inferred by observations of their rotation curves (RCs). This is a decades-long problem known as the ‘cusp-core’ discrepancy (Moore, 1994; Flores & Primack, 1994; de Blok et al., 2008; de Blok, 2010; Oh et al., 2015). In fact, observations of rotation curves (RCs) of low-mass galaxies reveal a great diversity in their shapes (Oman et al., 2015). Many dwarf RCs rise slowly and gently toward the galaxy’s outskirts, indicative of ‘cored’ DM density profiles, while others rise rapidly, more in line with cuspy profiles.
The low baryonic mass fraction of dwarf galaxies makes it tempting to assume that their DM halos can be directly related to results from DM-only simulations. However, hydrodynamical simulations indicate that the DM halos of dwarf galaxies can be significantly modified by baryonic processes (e.g., Governato et al., 2010, 2012; Di Cintio et al., 2014a; Cloet-Osselaer et al., 2014; Chan et al., 2015; Verbeke et al., 2015; Tollet et al., 2016; Read et al., 2016b). Some of these hydrodynamical simulations include feedback processes such as energy released by young and massive stars (Stinson et al., 2013) and winds projected from supernovae explosions (Stinson et al., 2006), which result in outflows of gas from the inner region of galaxies. The simulations show how these outflows can disperse DM particles, reshaping the underlying DM distribution as the galaxy evolves (Navarro et al., 1996), and induce core creation when repeated outflow events occur as a result of a bursty star formation (Read & Gilmore, 2005; Pontzen & Governato, 2012). This hypothesis gains support by observational evidence for strong gas outflows from the centres of galaxies at all redshifts (Shapley et al., 2003; Martin, 2005; van der Wel et al., 2011), as well as by studies on the star formation histories of local and nearby dwarf galaxies (e.g., McQuinn et al., 2010; Lelli et al., 2014c; Weisz et al., 2014; Izotov et al., 2016). In addition, strong outflows have been integral in the progress toward simulating realistic populations of galaxies (Brook et al., 2012; Munshi et al., 2013; Hopkins et al., 2014; Wang et al., 2015; Schaye et al., 2015; Agertz & Kravtsov, 2015).
The issue of the large variety of dwarf RC shapes has been explored recently using different models. In particular, Oman et al. (2015) studied the RC shapes of simulated galaxies versus a compilation of observed galaxies by comparing the circular velocities at the maximum of the RC, , and in the inner region of the galaxy disc, , and they noted the wide range of shapes –or values for a given – arising in observations.
Brook (2015) showed with a semi-empirical model that by combining the scatter found in observed galaxy scaling relations with the scatter in the halo mass-concentration relation, one can obtain the required scatter in RC shapes; assuming that DM halos follow the DC14 mass dependent density profile (Di Cintio et al., 2014b) and hence are cored at a particular mass range, M⊙. This result reflects the fact that baryons contribute significantly to the inner mass of cored profiles, so the observed diversity in disc scale-lengths will result in a higher diversity of RC shapes than the case of a cuspy profile, in which the contribution of baryons to the central mass is lower. The result still begs the question of the origin of the diversity of scale lengths and the relation between baryonic and DM mass distributions.
Read et al. (2016b) used very high-resolution hydrodynamical simulations of isolated dwarf galaxies to show that different RC shapes and DM density profiles may be a reflection of the star formation stage the galaxy is under-going: either bursty, post-bursty, or quiescent; that pushes the amplitude of the RC from steeply rising, to very shallow rising, to something in between, respectively. These simulations indicated that the steep RCs of starburst galaxies are caused by the increased gas turbulence driven by the star formation.
Katz et al. (2017) explored the issue in a complementary manner, building mass models for observed galaxies with reliable stellar mass measurements, assuming a cuspy NFW (Navarro et al., 1997) and a modified-by-baryonic-feedback DC14 (Di Cintio et al., 2014b) halo profile to fit their observed RCs. The results showed that using an expanded halo profile with the degree of expansion depending on the stellar-to-halo mass ratio (Di Cintio et al., 2014a) allowed the recovery of the observed RCs for a very broad range of galaxy masses and surface brightnesses, and, additionally, allowed to match the and mass-concentration relations as predicted by abundance-matching and CDM theory.
Dark matter alternative models like those of self-interacting dark matter (SIDM) have previously shown to produce cored DM halos (Rocha et al., 2013). More recently, controlled N-body simulations that used SIDM particles and mimicked the effect of a baryonic disc were also able to better reproduce the observed distribution of dwarf galaxy RC shapes than CDM-only simulations (Creasey et al., 2017), establishing that the combination of SIDM and baryonic effects may represent a viable solution to the problem. This is in agreement with previous analytical calculations within the SIDM scenario made by Kamada et al. (2016) and with hydro-SIDM simulations from Fry et al. (2015). However, in order to increase the scatter in RC shapes and match mass profiles from dwarf galaxies to cluster scales, SIDM models require velocity dependent cross-sections, invoking additional parameters beyond CDM. A more robust examination of the validity of this model would be possible from a self-consistent simulation of SIDM with baryons and its prediction for different halo mass scales.
In this paper we compare the RC shapes of the new SPARC dataset (Lelli et al., 2016a), a collection of high-quality H i/H RC data of nearby galaxies that span a wide range in luminosities, to state-of-the-art hydrodynamical zoom-in simulations from the NIHAO project (Wang et al., 2015), that span a wide range in masses and merger histories. NIHAO uses a cold DM (CDM) model, and includes a feedback implementation that naturally produces galaxies hosted in halos that have undergone a wide spectrum of halo responses, from contraction to expansion. The degree of expansion has been shown to depend primarily on the stellar-to-halo mass ratio (Di Cintio et al., 2014a; Tollet et al., 2016), and then eventually, at a given stellar mass, also on size (Dutton et al., 2016a), with larger galaxies being more susceptible to expansion. Following the method used in Oman et al. (2015), we compare the circular velocities at the inner and outermost parts of the RCs to define their shapes and then assess their diversity, paying particular attention to mass dependence.
The paper is organized as follows. The suites of observed and simulated galaxies are introduced in Secs. 2.1 and 2.2. In Sec. 2.3 we present the method used for obtaining an equivalent radius at which to measure the circular velocity in galaxies of similar mass. The comparison of RC shapes and its discussion is done in Sects. 3.1 and 3.2, and finally the results are summarized in Sec. 4.
2 Methods
2.1 Simulations
We use the NIHAO (Numerical Investigation of a Hundred Astrophysical Objects) project (Wang et al., 2015) suite of 100 hydrodynamical zoom-in simulations of isolated halos, with halo masses ranging from M⊙, and run in a flat CDM cosmology with parameters from Planck Collaboration et al. (2014): km s-1 Mpc-1, , , , , , , and initial conditions created using a modified version of the grafic2 package as described in Penzo et al. (2014).
The refinement level in the different simulation boxes is chosen in order to maintain a roughly constant relative resolution (i.e., ), with DM particles per halo. This allows the resolution of the mass profile to below 1 per cent of the virial radius at all halo masses ensuring that galaxy half-light radii are well resolved. For the specific values of resolution see Wang et al. (2015).
The hydrodynamical run has been done with a version of the N-body SPH code GASOLINE (Wadsley et al., 2004; Keller et al., 2014), referred to as ESF-GASOLINE2 (Wang et al., 2015). As in the original version of GASOLINE, it has prescriptions for gas hydrodynamics and cooling, hydrogen, helium and metal-line cooling (Shen et al., 2010), photo ionization and heating from a Haardt & Madau (1996) UV background, star formation according to a Kennicutt-Schmidt Law where stars form when gas particles are cold ( K) and dense ( cm-3), supernova feedback following the blastwave formalism (Stinson et al., 2006), ‘early stellar feedback’ from massive stars (Stinson et al., 2013), and metal diffusion. The new version includes an updated hydrodynamics solver, described in Keller et al. (2014).
The NIHAO simulations have already proved to reproduce realistic galaxies matching many properties and scaling relations which we group into three classes. Baryonic content: the stellar mass vs halo mass relation from halo abundance-matching and the star formation rate vs stellar mass relation (Wang et al., 2015); neutral gas vs stellar mass relation (Stinson et al., 2015); circum-galactic medium (Gutcke et al., 2017); Tully-Fisher scaling relations (Dutton et al., 2017); the baryon budget of the Milky Way (Wang et al., 2017). Dark matter properties: the shape of the Milky Way’s DM halo (Butsky et al., 2016); central DM density slopes of dwarf galaxies (Tollet et al., 2016); resolves the Too-Big-To-Fail problem for field dwarf galaxies (Dutton et al., 2016b); the HI velocity function (Macciò et al., 2016). Galaxy structure: the kinematics of galaxy disks (Obreja et al., 2016); ultra diffuse galaxies (Di Cintio et al., 2017); clumpy morphology of high redshift galaxies (Buck et al., 2017).
For this work we have used those galaxies with total (inside 10 per cent of the virial radius) stellar masses in the M⊙ range: a sample of 73 simulated galaxies.
2.2 Observations
Observational galaxies are taken from the new SPARC (Spitzer Photometry & Accurate RCs) dataset (Lelli et al., 2016a) and the LITTLE THINGS (Local Irregulars That Trace Luminosity Extremes, The HI Nearby Galaxy Survey) galaxies analyzed in Iorio et al. (2017).
SPARC is a sample of 175 nearby galaxies with homogeneous photometry at 3.6 m and high-quality RC data from previous H i/H studies. Though not a complete sample, it is representative of nearby disc galaxies spanning a very wide range in luminosities (therefore stellar masses), morphologies and surface brightnesses.
The LITTLE THINGS data used in this work is the one studied in Iorio et al. (2017), in which a sub-sample of 17 dwarf irregulars, taken from the original sample of Oh et al. (2015), was reanalyzed. These galaxies conserve the same statistical distribution of galactic properties as the original sample. Rotation curves were built following the 3D-approach of the 3DBAROLO software (Di Teodoro & Fraternali, 2015), which allows results to be unaffected by beam smearing.
SPARC RCs have been corrected for beam smearing, inclination, and pressure support (or asymmetric drift). The Iorio et al. 2017’s LITTLE THINGS RCs have also been carefully corrected for pressure support. We note however that this correction is important in very few cases of low mass galaxies that have a velocity dispersion comparable to their rotational velocity. Therefore, even though the corrections have been done differently for each sample (see secs. 5.2 and 4.3 from Lelli et al., 2014b; Iorio et al., 2017, respectively), we assume that the observed RC data used here effectively traces the circular velocity of the galaxy. We acknowledge that apart from pressure support, other deviations from equilibrium can be produced by the effect of factors such as HI bubbles from star formation events (Read et al., 2016a) or gas non-circular motions, which seem to be common near the centre of very low mass galaxies. Due to the complexity of the problem, as recently discussed in Oman et al. (2017), a thorough study of these effects would be beyond the scope of the present paper.
For this study we select observed galaxies inside the same stellar mass range as simulated galaxies. For SPARC the stellar masses are computed assuming a constant stellar mass-to-light ratio of , value which has been shown to minimize the scatter around the baryonic Tully-Fisher relation (BTFR, Lelli et al., 2016b) and to give a realistic galaxy population on the relation (see Lelli et al., 2016a). For LITTLE THINGS we use the highest stellar mass between the two values given in Oh et al. (2015), computed from kinematics and SED fitting respectively, in order to include the maximum number of objects possible. Moreover, we use only those objects with inclinations greater than 45∘ to ensure the most reliable RC data111Note that including all galaxies with inclinations 30∘ does not substantially change our results.. This leaves a sample of 94 observed galaxies, of which 85 belong to SPARC and 9 to LITTLE THINGS.
2.3 Comparing observed and simulated rotational velocities
Various definitions for the ‘characteristic’ rotational velocity of observed galaxies are often used: , , , , … (e.g., Verheijen, 2001; Bradford et al., 2015, 2016; McGaugh & Schombert, 2015), which can lead to confusion when comparing rotational velocities of simulations with observations. By studying the different BTFRs obtained with various definitions, we have formerly highlighted the need to be consistent about the particular method of measuring , and precise about the radius at which velocities are measured (see fig. 5, Brook, Santos-Santos, & Stinson, 2016).
Indeed, the commonly used and measures are ambiguous, since many observed low mass galaxies have RCs that are still rising at their last measured point (e.g. Kuzio de Naray et al., 2006; Catinella et al., 2006), and the data does not reach the true maximum or flat part of their RCs (Brook & Di Cintio, 2015; Sales et al., 2017). Therefore, taking into account that observational RC data extends out to a certain, limited radius for each galaxy, while simulations allow calculating the RC out to any radius, we have searched in this work for an equivalent radius at which to measure in both observed and simulated galaxies with similar stellar masses.
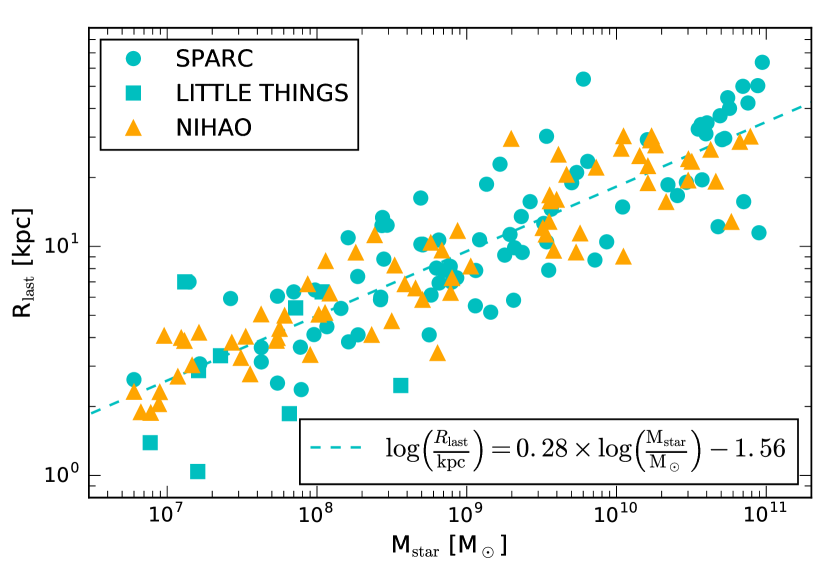
We use the relation between and from the observational sample, where is the radius at the last measured point of the RC. We choose to compare with stellar mass because for all SPARC galaxies this quantity is estimated in a uniform manner from precise near-infrared surface photometry (). In the case of simulations, the stellar mass is unambiguously and directly obtained. Using the total baryonic mass gives a slightly tighter relation, but the different ways of measuring the ‘cold’ or H i gas in observed and simulated galaxies introduces an extra uncertainty (e.g. Stinson et al., 2015; Sales et al., 2017) which we want to avoid.
We used a linear fit for the observed relation, with its scatter, to derive the corresponding for a simulated galaxy of given stellar mass. In Fig. 1 we show as cyan points the relation for the set of observed galaxies. A dashed line represents the linear fit to these points, which is explicitly shown in a box in the lower part of the figure. The last measured point of the RC increases with stellar mass as expected, following
| (1) |
and presents a moderate scatter for a given stellar mass, which translates into a standard deviation in of 0.17 dex. Applying this relation, we have computed the corresponding radii for the NIHAO galaxies according to their stellar mass and taking into account the observed scatter.
Results for the NIHAO sample are overplotted as orange triangles to the observational data in Fig. 1: by design they occupy the same region of the plane as observed galaxies. Figure 1 further indicates that both NIHAO and SPARC + LITTLE THINGS datasets cover homogeneously the M⊙ stellar mass range.
3 Results
3.1 Matching the diversity of observed RC shapes
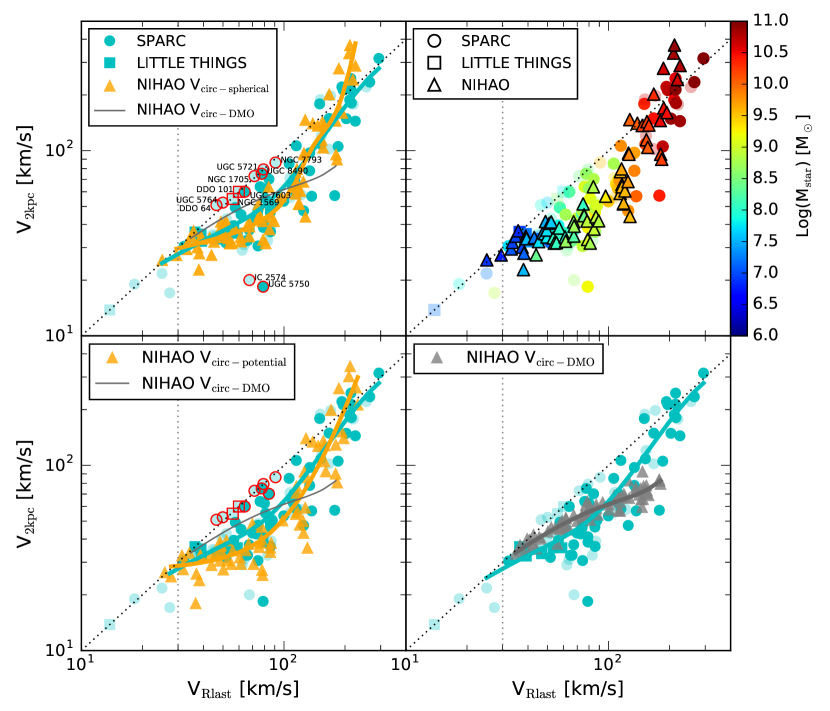
To compare the global shapes of simulated and observed galaxies’ RCs we use the relation, where is the RC at 2 kpc from the centre, and is the RC measured at , given by Eq. 1 for NIHAO galaxies. For those observed galaxies that do not have measured velocities exactly at 2 kpc, we interpolate between the two closest bins. This relation is shown in Fig. 2, where in all four panels SPARC data are shown as circles, LITTLE THINGS as squares, and NIHAO galaxies as triangles.
The top left panel of Fig. 2 shows the relation of observed (cyan) and NIHAO (orange) galaxies, where NIHAO rotational velocities are approximated as the spherical circular velocities: , where is the 3D radius and is the total mass enclosed within such radius.222 We acknowledge that assuming a spherical mass distribution is not the accurate-most hypothesis, however we use this definition in order to be able to directly compare our results to previous simulation data that use it as well: in particular the EAGLE/APOSTLE simulations presented in Oman et al. (2015). SPARC galaxies with high quality H i-H RC measurements (as evaluated in the SPARC dataset) are indicated with dark cyan circles, while lower quality data are shown as semi-transparent cyan circles. The lower quality of H i data in these galaxies is due to major asymmetries, strong non-circular motions, and/or offsets between the H i and stellar distributions. Similarly, LITTLE THINGS galaxies with very uncertain RCs (due to peculiar kinematics, strong asymmetries, or poorly determined distances, as discussed in Iorio et al., 2017) are also shown with semi-transparent color. Additionally, this panel shows as solid lines the smoothed-spline interpolations to observational and NIHAO data, highlighting the average distribution of observed and simulated galaxies in the plane.
From the top left panel of Fig. 2 we see that the simulated NIHAO galaxies occupy a similar region of the plane and follow similar trends as the observed galaxies. Furthermore, they show a wide variety of RC shapes for a given . This is a noticeable improvement compared to the hydro-simulations analyzed in Oman et al. (2015, 2016) that instead follow the expectations of a DM-only model with very little scatter up to 30 km s-1(as the 1:1 dotted line), and then start deviating from it at larger than 60–70 km s-1(larger halo masses) due to the increasing contribution of baryons at the galactic centre.
The top right panel of Fig. 2 shows SPARC (circles), LITTLE THINGS (squares), and NIHAO (triangles) data colored by stellar mass, again with less accurate observational RCs indicated with a semi-transparent color. As expected, there is a correlation between and . This panel highlights that both observed and simulated galaxies with similar stellar masses occupy similar positions in the plane. It also shows that the region at which the spread in RC shapes is maximal, i.e., between 50km s-1100, corresponds to the stellar-to-halo mass ratios at which we expect DM core formation to be most efficient: after assuming an abundance-matching relation this corresponds to between and M⊙ (Di Cintio et al., 2014a). Therefore, the diversity of RC shapes highlighted by Oman et al. (2015) primarily occurs at the precise mass range where the models show the greatest effects of baryonic physics on modifying the density profiles of cold-DM halos.
Given that assuming a spherical mass distribution is a simplification, we show in the bottom left panel of Fig. 2 the ‘true’ circular velocities of NIHAO galaxies, computed through the gravitational potential in the disc plane: , such that the actual mass distruibution of disc galaxies is taken into account. Note that the H i gas rotational velocity traces the true circular velocity of the galaxy if its gas is in equilibrium (Binney & Tremaine, 2008; Burkert et al., 2010; Iorio et al., 2017). Though this may not be the case of all simulated (or observed) galaxies studied here, the use of the true circular velocity allows a closer comparison with H i RC observational data.
When using , the overall scatter in the plane is slightly increased and the mean trend line is lowered. This lower average result is expected since we recall that, in the extreme case of an exponential disc mass distribution, increases linearly with at radii smaller than the scale-length, instead of as as in the spherical case. This inner region discrepancy can be further enhanced if there is an H i hole in the galactic centre, as is commonly observed. More specifically, we find , with a mean of 0.91, and . Thus, these not very remarkable quantitative differences between the two definitions of circular velocity allow for the same qualitative analysis and general conclusions formerly drawn for the spherical circular velocity case.
A more thoughtful comparison between simulated and observed galaxies, however, requires refined methods in order to trace the actual dynamics of the gas: indeed, it has been shown by several authors that the H i velocity profile of the gas (VHI) in dwarf galaxies often does not trace the circular velocity of the corresponding halo (Valenzuela et al., 2007; Brook & Di Cintio, 2015; Macciò et al., 2016; Pineda et al., 2017; Verbeke et al., 2017; El-Badry et al., 2017; Brooks et al., 2017; Oman et al., 2017). As already mentioned, in this case new factors such as equilibrium criteria, velocity dispersions, and asymmetric drift corrections will come into play, making the comparison more robust yet more complicated. These issues will be studied in a forthcoming paper (Dutton et al. in prep).
Finally, the bottom right panel of Fig. 2 shows NIHAO’s DM-only circular velocities. Without hydrodynamics, NIHAO DM halos are self-similar, which results in self-similar circular RCs and minimum scatter on the relation. This panel stresses how much pure CDM predictions are at odds with observational RC data, and how baryonic effects on DM are crucial to reproduce observed galaxy properties. The DM-only NIHAO prediction is placed as a thin black line on the rest of panels for a clearer comparison with the cases where baryons are included.
The success of NIHAO hydro-simulations in recovering the observed distribution and scatter of RC shapes lies in the wide range of halo responses these simulated galaxies can exhibit, from contraction to expansion. In particular, the match with data at the controversial scales of intermediate-mass and dwarf galaxies, is due to the role of supernova-driven gas outflows that induce the expansion of the central galactic DM content (Governato et al., 2012; Pontzen & Governato, 2012; Macciò et al., 2012). These processes generate a DM (and stellar) core in the galaxy, in a mass-dependent fashion (Di Cintio et al., 2014a; Tollet et al., 2016; Di Cintio et al., 2017): the core formation mechanism is strongly sensitive to even small variations in (as already reported in Brook, 2015); and at a given stellar mass, there is in addition a tendency for larger galaxies to expand more (Dutton et al., 2016a). All this results in NIHAO achieving a relatively wide variety of RC shapes. Furthermore, the mass-dependent core formation model presented in Di Cintio et al. (2014b) predicts that at the lowest mass scales, i.e., for galaxies with M⊙, the effect of stellar feedback is insufficient to create a shallow DM distribution (Peñarrubia et al., 2012; Governato et al., 2012). This should translate into a similarity of RCs at this extreme mass scale, which is indeed evident both in observations and simulations with km s-1. At the highest mass scales, i.e. M⊙, the effect of stellar feedback starts to be insufficient to modify the DM halo due to the deepening of the potential caused by stars that form in the central region. However, precisely because of this increasing dominance of baryons at the galactic centre, their RC shapes are not expected to be self-similar but to vary, tracing the different possible final baryonic distributions. This explains the existing scatter in both observed and simulated RC shapes above km s-1.
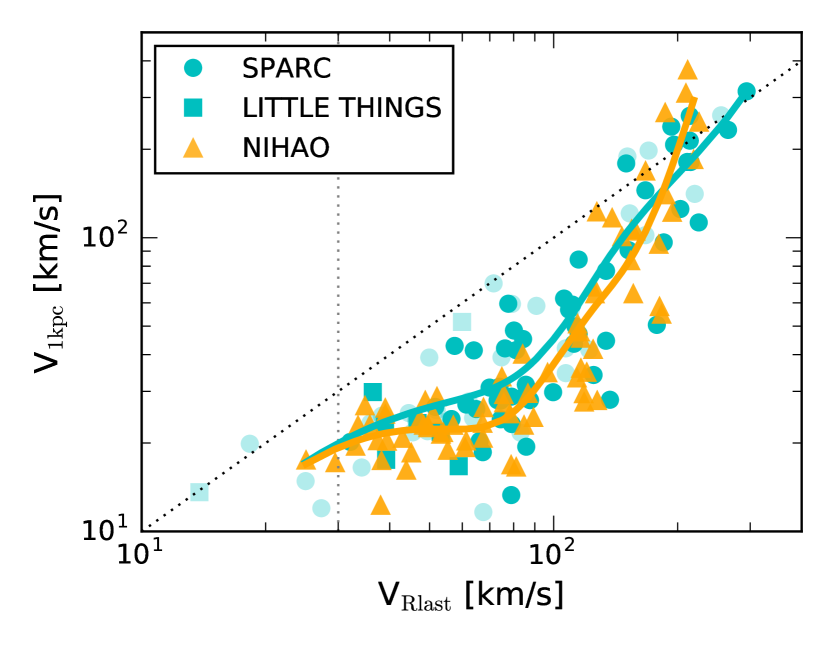
Due to the choice of the quantities plotted, will be equal to for observed and simulated galaxies with kpc. According to Eq. 1 and to the top-right panel of Fig. 2, this corresponds to a typical value of km s-1, marked in all panels with a thin dotted vertical line. We insist however that the choice of using the velocity at a radius of 2 kpc does not force the match at the low-velocity end between observational and simulation results. Figure 3 shows that when plotting instead the velocity at a smaller radius, for example at 1 kpc, the least massive galaxies also tend to have higher , coming closer to the 1:1 line, and in general the shapes of the trendlines of both the observed and simulated samples coincide.
The main difference with respect to the figure is that with there is a higher dispersion over the entire range, both in the observational data and in the simulation results. We note that when using instead , the average trend keeps the same curved shape but this time with a smaller dispersion of both simulated and observed results. Therefore, results with velocities computed at 1 kpc, 2 kpc, and 3 kpc show qualitatively the same trends, but with a decreasing overall scatter as we move to larger radii. The fact that the overall scatter in the plane decreases when computing velocities at higher and higher radii is an interesting point: this is what we expect from models in which core formation mainly acts at modifying the inner region of DM halos, such as baryonic-driven core formation. As we move towards large radii, kpc, the effect of core formation is less evident on the RC of galaxies, and therefore we expect to observe less scatter in their RC shapes. This is indeed the case for both NIHAO simulations and the observational results presented here.
Although the NIHAO simulated galaxies follow the observational trend quite well, the match to observational data is not perfect. We denote as ‘outliers’ those observed galaxies whose is outside the range determined with respect to the NIHAO trend line. Note that we do not take into account the individual measurement errors when checking if observational data are inside the contours. For SPARC these are, on average, between km s-1, and include the uncertainties in circular random motions and distance estimates but do not include the systematic inclination error. The LITTLE THINGS errors are of km s-1 on average and account for the errors coming from the 3DBAROLO parameter estimations and the asymmetric drift corrections. If the error bars are considered, some of the following galaxies are actually not outliers to NIHAO. We stick here however to this more conservative approach.
Focusing on the top left panel of Fig. 2, where spherical circular velocities were used for NIHAO, we find 11 observational outliers, all between /km s-1, which we circle in red: they either present an extremely steep RC (falling close to the 1:1 dotted line), or an extremely shallow one. These galaxies will be studied in detail in Section 3.2. When using instead the true circular velocities, we find 1 additional outlier with a steeply rising RC, but no longer the shallow rising galaxies (see red circles in bottom left panel of Fig. 2). In fact, the RC of these galaxies are matched very well by NIHAO galaxies of similar (see Sec. Section 3.2). It is worth mentioning that the steepest observed RCs in the km s-1 range pose a problem also to simulations that predict a cuspy inner mass profile: when put on the plane, the EAGLE/APOSTLE simulations are also unable to match the SPARC outliers with the highest velocities, despite the high mean values they present over the whole extent (see Fig. 4).
We note that at the highest values ( M⊙) some NIHAO RCs are rising more steeply than SPARC galaxies. NIHAO simulations do not include the effects of AGN feedback, which is particularly important at these mass scales to counteract the cooling of baryons and regulate star formation (Nulsen et al., 2007; McCarthy et al., 2010; Beckmann et al., 2017). Therefore they may enclose a higher-than-average mass in their inner regions compared to SPARC data. The significance of the deviation of simulated RCs from observed ones at the highest stellar masses will be explored in future work that takes into account AGN effects.
We caution the reader that while the observations (SPARC + LITTLE THINGS) and the simulations (NIHAO) are representative, they are not necessarily unbiased samples of the underlying galaxy population. Thus, in the plot the differences between various simulations and observations may be due in part to sampling effects, and this issue applies as well to all previous studies on the subject.
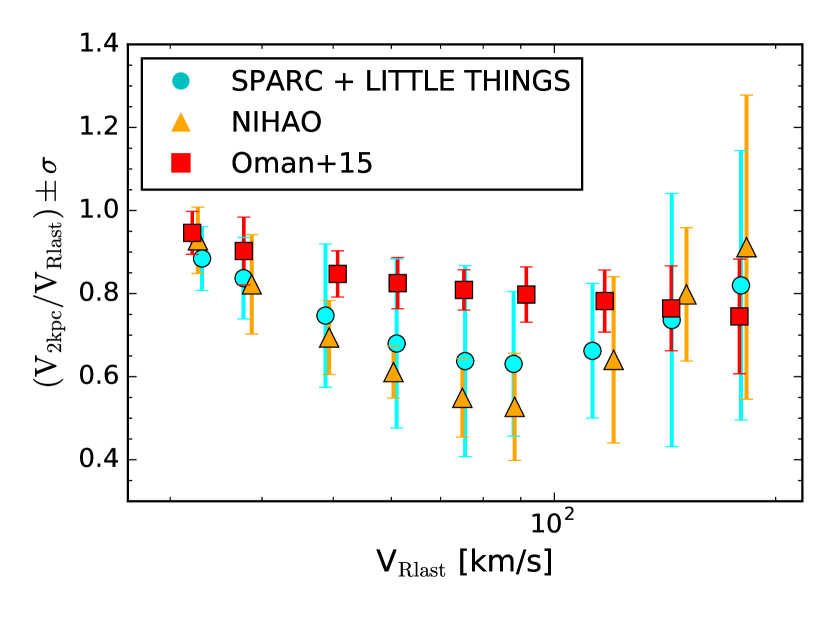
Finally, in Fig. 4 we quantify the scatter of the relation by dividing the data in regular logarithmic bins in VRlast and comparing the simulated and observed mean ratios and standard deviations in each bin. As in previous figures, observational data is shown in cyan and NIHAO results (note that these are the spherical circular velocities) in orange. The mean values are given by the interpolation lines in the top left panel of Fig. 2, while the scatter indicates the standard deviation to this mean ratio, thus representing a direct measure of the diversity in RC shapes.
The mean values are reasonably similar in the observational and NIHAO samples, and the major differences in the size of scatter appear again in the previously mentioned regions: in the high range where NIHAO RCs rise steeper than SPARC (probably due to the lack of AGN effects), and in the 50–100 km s-1 range where there are observed galaxies with both steeper and shallower RCs than NIHAO (outliers with red contours in top left panel of Fig. 2). We note that when using the true circular velocities, the overall scatter is increased 14 per cent on average, and the mean ratios are decreased 7 per cent on average.
Figure 4 also shows the results for the EAGLE/APOSTLE simulations from Oman et al. (2015) (red squares). Their values as calculated from Eq. 1 have been kindly provided by Kyle Oman. Since these simulations form galaxies with self-similar cuspy DM halos at every mass, their mean values in the km s-1 region are significantly higher than observed, while their measured scatter is smaller than observed. Thus, the greatest mismatch between EAGLE/APOSTLE simulations and observations occurs in the precise range where the NIHAO galaxies are most efficient at forming cores. As compared to NIHAO data, EAGLE/APOSTLE scatter is on average 60 per cent that of NIHAO.
3.2 Observational outliers
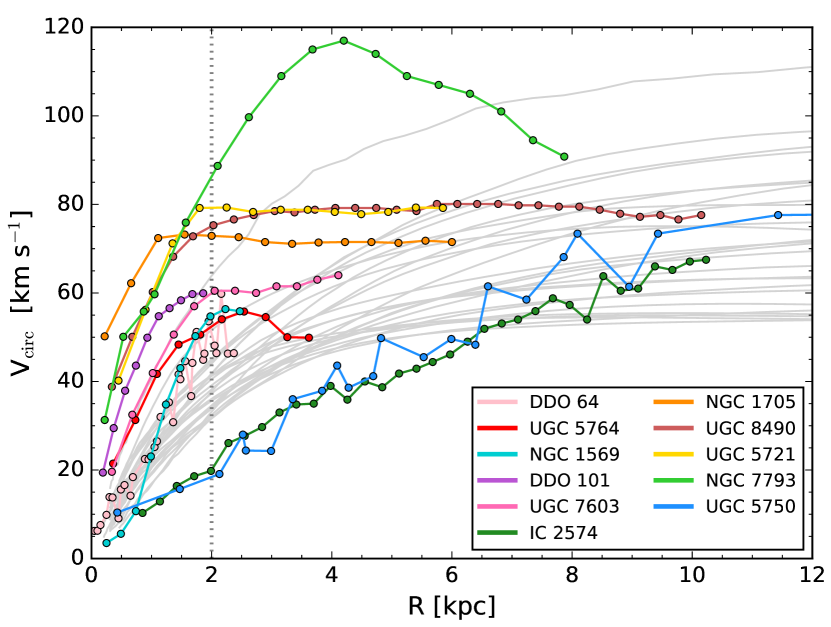
We analyze in detail the individual galaxies from the observed samples that are outliers in the plane, highlighted with red contours in Fig. 2 (top left panel). They correspond to galaxies whose velocity at 2 kpc is more than 3 away from the mean NIHAO value in the same range. As said previously, this is a subset of 11 galaxies, all within km s-1 in . We recall that we have not taken into account the measurement error for each observed galaxy when assessing if they are 3 away from simulation averages.
The RCs of these outlier galaxies are depicted with colored lines in Fig. 5 with their names indicated in the legend. The R-axis is truncated at 12 kpc for clarity, but we note that galaxy UGC 5750 extends flat out to 23 kpc. This subset of galaxies is compared to the sample of NIHAO galaxies within the same range, km s-1, shown as grey lines in Fig. 5. All the NIHAO galaxies in this range form cores of various sizes, matching very well the remaining 31 observed galaxies in this velocity region which represent the majority of observed SPARC galaxies here ( per cent).
Apart from galaxies IC 2574 and UGC 5750, which have a very shallow RC, all the remaining 9 outliers do not match NIHAO expectations since their RCs are steeper, rising faster from the galactic centre, and presenting a sharp discontinuity to flat rotation. Such extremely steep RCs are too steep even compared to expectations from simulations with a universal standard NFW profile for DM halos (Oman et al., 2015), and are not matched by any NIHAO DM-only RC either (see bottom right panel of Fig. 2). This may be indicating that i) the baryon content is not negligible compared to the DM, or ii) the data is not tracing the potential, probably caused by the presence of non-circular and/or random motions, or fast moving H i bubbles (Read et al., 2016b) around the galactic centre. Further, these galaxies are outliers compared not only to simulated galaxies, but also to the average observed RCs in such range.
We note that out of 11 outliers only 3 have high quality RC data, while the remaining 8 present several observational and technical issues that hinder an accurate derivation of their RCs. Specifically, the sources of error in the determination of the velocity fields of these galaxies include (for references and further details see Secs. 3 and 3): disturbed H i discs containing holes or being severely warped (e.g., NGC 7793, NGC 1705, UGC 5764, IC 2574, NGC 1569), significant uncertainties in distances, inclinations and orientation angles (e.g., UGC 5721, NGC 7793, DDO 101), abrupt changes of inclination throughout the galaxy disc (e.g., NGC 1705), unsufficient angular resolution over the beam (e.g., UGC 5721), asymmetries and non-circular or random motions (e.g., IC 2574, DDO 64, NGC 1569).
We firstly note that with such observational uncertainties it seems natural that the scatter in observed RC shapes should be larger than that found in simulations. Secondly, we note that some environmental effects may be missing in the NIHAO sample, which are simulations of isolated field galaxies only. The SPARC and LITTLE THINGS datasets, instead, include galaxies both in isolation and within groups. Such a difference could represent an extra source of higher scatter in observations, since a group environment can strongly affect a galaxy’s evolution (see e.g., Wetzel et al., 2013; Del Popolo, 2012).
We proceed by examining one by one the outliers shown in the top-left panel of Fig. 5.
Low-V2kpc outliers
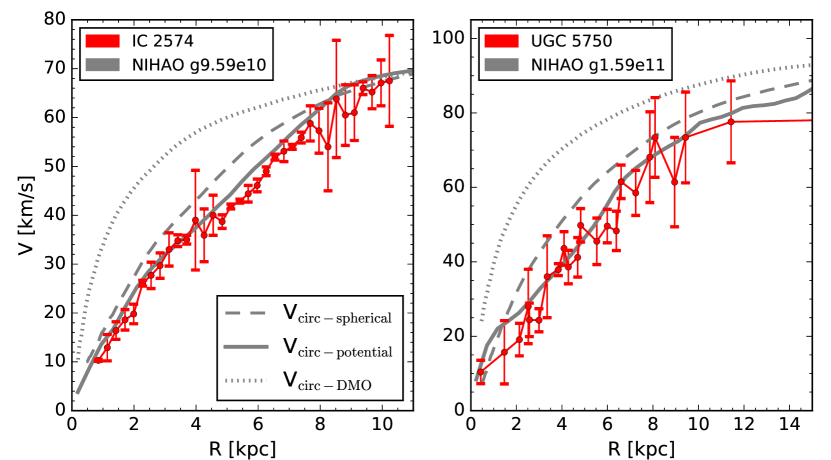
Galaxies IC 2574 and UGC 5750 have been extensively studied elsewhere in the context of CDM (e.g., Oman et al., 2015, 2016; Creasey et al., 2017): their RCs are so slowly-rising that their implied DM core is even larger than that predicted by other hydro-simulations that form cores. While issues about non-circular motions have been raised by de Blok et al. (2008) and Oh et al. (2008) for the case of IC 2574, such concerns do not apply to UGC 5750. Therefore, it has been argued that these galaxies pose a problem to the core-formation scenario (Oman et al., 2015). We show here that this is not the case.
In Fig. 6 we closely compare the observed RC of IC 2574 and UGC 5750 with that of their most-similar NIHAO counterpart (g9.59e10 and g1.59e10, respectively). SPARC data is presented with error bars. For NIHAO galaxies we show the circular velocities from the DM-only run , the spherical circular velocities (as in top left panel of Fig. 2), and the true circular velocties computed from the gradient of the gravitational potential at the disc plane (as in bottom left panel of Fig. 2).
Although IC 2574 and UGC 5750 present a higher than 3 difference with respect to NIHAO galaxies on the plane when using , the use of the true circular velocity that takes into account the precise mass distribution of the galaxy provides a remarkable agreement with observational data, proving that when simulations include effective feedback, dwarf galaxies IC 2574 and UGC 5750 can be reconciled with predictions based on the CDM model. We note that in the case of these two particular NIHAO galaxies, gas velocity dispersions are low and asymmetric drift corrections can be neglected, which means that this is approximately equal to the rotational velocity that could be measured from the H i gas. This may not be the situation for all simulated NIHAO galaxies; therefore, as said previously, this more realistic comparison of the H i gas velocities of NIHAO simulations with observations is left for a following paper. We already hint here that, as presumed, adding observational ‘effects’ or ‘biases’ to the derivation of simulated galaxies’ RCs will provide very diverse RC shapes and add a considerable amount of scatter to the relation yielding a better match with observational data.
High-V2kpc outliers
Galaxy NGC 1705 has a regularly rotating H i disc which is strongly warped, and may be out of equilibrium due to its off-centred stellar component. Moreover, its H i disc may indicate the presence of radial motions (15 km s-1) near the centre (Lelli et al., 2014b). NGC 1705 is a starburst galaxy (Annibali et al., 2003), with a birthrate parameter close to 6 (Lelli et al., 2014b), where the McQuinn et al. (2009) definition of starburst is followed, as a galaxy that has a birthrate parameter , where SFR(mean)0-6 is the mean SFR over the past 6 Gyr.
UGC 8490 (also known as NGC 5204) is a nearby compact irregular galaxy that is strongly warped, with several changes in inclination (Sicotte & Carignan, 1997). The innermost points of its H and H i RCs do not agree (Swaters et al., 2009). Its star formation history shows a significant rise at recent times compared with the average star formation rate over the last few Gyr, in consistency with known starburst dwarf galaxies (Lelli et al., 2014a; McQuinn et al., 2015).
UGC 5721 (NGC 3274) is a barred spiral, emission-line or H ii galaxy (Hunter et al., 1982) in the constellation of Leo. Its H curve shows a steep rise that is not seen in the H i data. Moreover, the inner points of its RC are uncertain because of insufficient angular resolution (Swaters et al., 2009). It has a circular velocity gradient comparable to those of BCDs (Lelli et al., 2014a), and so could possibly harbor a starburst.
UGC 7603 (NGC 4455) is another emission-line (Seyfert) galaxy (Deo et al., 2007). The derived H i RC may be uncertain since its velocity gradient is not well resolved by the H i beam. This uncertainty is enhanced in the inner region of the RC due to its high inclination (Swaters et al., 2009).
UGC 5764 (DDO 83) is a gas-rich isolated galaxy, classified morphologically as irregular or even BCD. It has a low luminosity but high central surface brightness giving a kpc scale length. This galaxy seems to have just started to flatten out at the edge of its detected H i, but it presents a warp on its receding side that makes its last 2 points uncertain (van Zee et al., 1997).
NGC 7793 is a warped spiral galaxy in the constellation of Sculptor, at a distance of Mpc. It has a chaotic spiral structure and shows signs of new star formation. Its HI RC appears to be declining in the outer parts (Carignan & Puche, 1990; Dicaire et al., 2008; de Blok et al., 2008) though the inclination estimates are uncertain. It hosts many X-ray sources; e.g., in the outskirts lies a powerful microquasar that is driving gas away from the disc at high speeds in two jets, creating a 300-parsec-long jet-inflated bubble of hot gas (Pakull et al., 2010).
NGC 1569 (UGC 3056) is a nearby ( Mpc) starburst dwarf irregular galaxy with very disturbed HI kinematics and a turbulent ISM. Its velocity dispersion is km s-1 on average and therefore the asymmetric drift correction dominates the RC at all radii (Iorio et al., 2017). Several young super stellar clusters are located in its centre. It also presents signs of superbubbles and supergalactic winds (Sánchez-Cruces et al., 2015).
DDO 64 (UGC 5272) is a dwarf irregular galaxy that is actively forming stars. It is dominated by HII regions around which stars are clumped, giving place to a patchy distribution. The inner regions of the stellar component are dominated by a young population which translates in this galaxy presenting extremely blue colors as compared to other irregular galaxies. Emission lines are measured from spectroscopy of its HII regions (Hopp & Schulte-Ladbeck, 1991). Non-circular motions may be causing a difference between the approaching and receding sides of the velocity field (de Blok & Bosma, 2002).
DDO 101’s HI disc is extended only slightly beyond the optical disc. It’s RC only reaches out to a radius of kpc (Iorio et al., 2017). The estimates of the distance for this galaxy are very uncertain, ranging from 5 to 16 Mpc.
So, of the 9 galaxies with steeply rising RCs, 7 are either starburst galaxies or emission-line galaxies, which may also be indicative of significant ongoing star formation, since the gas is presumably ionized by the ultraviolet radiation from massive young stars. Indeed, that the inner RC of starburst dwarfs rises more steeply than that of typical dwarf irregulars has been shown in previous studies (Lelli et al., 2014c, b; McQuinn et al., 2015), indicating that starburst galaxies have a higher-than-average central dynamical mass and that starburst activity may be related to the shape of the potential well.
In Lelli et al. (2014b) it is argued that the steep RC of starburst galaxies is in disagreement with the ‘cusp-core’ transformation picture offered by cosmological hydrodynamical simulations. These galaxies observationally show a large gas reservoir which the authors discuss could drive large fluctuations of the central potential forming eventually a shallow core. This mechanism is particularly efficient during violent star formation episodes, such as those a starburst galaxy is going through. However, the timescale and total duration of such stellar activity should also be taken into account. Models of DM core creation, based on cosmological simulations, agree on the notion that a bursty, repeated, and extended star formation history is necessary in order to create a large DM core (e.g., Pontzen & Governato, 2012; Read et al., 2016a; Di Cintio et al., 2017). By contrast, star formation in starburst galaxies commonly happens at very late times, after a possibly overall quiet star formation history. If proven by future observations, this would support a scenario in which low mass starbursts have a highly concentrated dark matter inner mass distribution, matched by an NFW or a contracted profile, since there has not been enough energy from gas outflows at any time in order to modify the inner region. Once again, note that indeed these galaxies have a central mass distribution at 2 kpc which is even higher than that of the EAGLE/APOSTLE simulations and NIHAO DM-only predictions: this highlights the role of violent and ongoing starbursts in creating a contracted central density. That starburst phases lead to steep RCs, as measured from gas kinematics, has also been recently shown with high resolution dwarf galaxy simulations (Read et al., 2016b).
In favor of this possibility is the fact that these star-forming (either starburst of emission-line) galaxies have smaller effective radii than average galaxies of the same stellar mass. For example, NGC 1705, UGC 8490, UGC 5721, and UGC 7603 have a 1 kpc (see Lelli et al., 2016a). In this sense, these galaxies are outliers within the observational sample itself. These relatively compact stellar populations may be indicative of these galaxies having undergone less halo expansion (e.g., Teyssier et al., 2013; Dutton et al., 2016a; Di Cintio et al., 2017).
Note that we do not claim that all starbursts should have steep DM profiles. As said previously, the creation of a core versus maintaining a cuspy NFW inner profile strongly depends on the star formation activity before the final starburst phase. In fact, opposed to Lelli et al. (2014b)’s general findings of high central densities in starburst galaxies, McQuinn et al. (2012) showed the diverse spatial distribution of the stellar activity in a set of observed starburst galaxies, where ‘centrally concentrated’ bursts were not the most common case. For example, IC 2574 has a burst at and yet shows a large central core. In this case the burst occurs on the borders of a supergiant H i shell located close to the edge of the galaxy (Weisz et al., 2009). We note however that evidence of frequent disturbed non-symmetric H i disc morphologies observed in starburst dwarf galaxies (Lelli et al., 2014c) support that the mechanisms that are most likely able to set off new star formation activity in dwarfs are tidal perturbations from companion objects and gas shocks during mergers. If environmental processes are triggering star formation in these observed outliers, then they cannot be directly compared with the isolated galaxies of the NIHAO suite.
Of course, this picture about starburst galaxies and their relation to the ‘cusp-core’ issue is purely speculative at this stage. Further studies based on simulations that take into account the role of environment, considering the full parameter space of interactions in a cosmological context at , are required to assess the origin and properties of starburst galaxies, and their relation to the cusp-core transformation. Finally, more detailed measurements of the full star formation histories of starburst galaxies are necessary in order to shed light on the interplay between star formation and the shape of DM halo profiles.
4 Conclusions
It has been argued that galaxies simulated within a CDM universe are not able to reproduce the observed diversity of dwarf’s RCs, which may represent a problem for the CDM cosmological model (Oman et al., 2015). We have made a comparison between circular velocities of simulated galaxies from the NIHAO project and observed rotational velocities of galaxies belonging to the new SPARC dataset and to the LITTLE THINGS survey, spanning a wide range of masses from Milky Way to dwarf galaxies, to check whether simulations that include baryonic processes that modify the distribution of mass in the central regions of DM halos can reproduce the variety of observed RC shapes.
We derived a method to measure the circular rotational velocity at the ‘same’ radius for both observed and simulated galaxies of comparable stellar mass. We then compared the circular velocities at the inner 2 kpc and at the outermost radii (). This relation gives an idea of the global shape of the RC. The main results of this paper are:
-
•
The trend of RC shapes as a function of is very similar for simulated NIHAO galaxies and observed galaxies: the largest deviation from DM-only predictions occurs at 60/km s-1100 for both observations and NIHAO simulations, corresponding to the 108.0-9.0 M⊙ mass range, at which core formation from stellar feedback has been previously shown to be most efficient (e.g., Di Cintio et al., 2014a; Tollet et al., 2016).
-
•
NIHAO has significantly greater scatter in RC shapes compared to previous studies that do not foresee core creation from stellar feedback, bringing simulation results into better agreement with observations: the largest scatter in RC shapes for both observations and simulations is indeed found in the mass range where core formation is most efficient.
-
•
Observed galaxies such as IC 2574 and UGC 5750, with extremely shallow-rising RCs that represented a long-standing issue for CDM, are now very well matched by NIHAO simulations, once observational uncertainties are considered and the actual gradient of the potential is used to compute circular velocities.
-
•
Some observational outliers are found outside the 3 contours covered by NIHAO galaxies in the plane: the majority of these outlier galaxies are starburst galaxies or present emission lines that may indicate significant ongoing star formation activity. Remarkably, their RC is too steep even when compared to pure N-body simulations that predict a cuspy profile, indicating a tight link between the starbursting activity and the central dynamical mass of these galaxies.
Some extra degree of scatter in observed RC shapes is expected and comes from observational issues: indeed, 8 out of 11 observed outliers have poor quality RCs, which denotes problems such as disturbed H i discs containing holes or being warped, significant uncertainties in distances and inclinations, abrupt changes of inclination throughout the disc, insufficient angular resolution over the beam, asymmetries and non-circular or random motions.
The two most cored observed SPARC galaxies are outliers when using the spherical circular velocities, but result very much recovered when using the true circular velocity criterion, which takes into account the real mass distribution of the simulated galaxy and is computed from the gravitational potential at the disc midplane. For galaxies in equilibrium, this is in fact the same velocity than that measured from the rotation of the H i gas, therefore allowing a more consistent comparison with observational data.
The remaining outlier galaxies all have RCs that rise fast in the inner regions and then show a sharp change to flat rotation, contrary to all simulated galaxies in the 50-100 km s-1 range which instead have a smooth RC and present a central DM core of various sizes. We note that some of these galaxies have even higher inner velocities than those of dwarf galaxies from simulations where DM halos are barely affected by baryonic processes, and whose RCs therefore reflect their initial NFW DM distributions. While some objects have low-quality H i velocity data –meaning that they are out of equilibrium and their H i velocities do not trace the underlying potential– in the case of the high quality data, such quickly rising and flat RCs can be indicating that the inner baryonic mass fraction cannot be neglected, and their halos may have been adiabatically contracted.
In fact, the majority of such observed steeply-rising outlier galaxies are either starbursts (see Read et al., 2016b) or emission-line galaxies. In agreement with previous studies that suggest that central starburst activity is closely linked to a high central dynamical mass in dwarf galaxies, these particular outliers tend to have a lower-than-average effective radius for galaxies of their stellar mass (see fig.2 in Lelli et al., 2016a). While the NIHAO galaxies can reproduce well the general trends of the observed SPARC relation (Dutton et al., 2016a), they cannot reproduce such compact objects with short effective radii, which appear to be outliers not only when compared to our simulations, but also when compared to the average population of galaxies of similar stellar mass (see compilation of effective radii and data set in Lelli et al.)
Thus, our analysis shows that the galaxies with the most compact stellar populations are the ones that have retained a cuspy, or possibly contracted, central halo profile: this is interesting since baryon expansion effects are predicted to apply to both stellar and DM (Teyssier et al., 2013; Dutton et al., 2016a; Di Cintio et al., 2017). The implication is that this population of starburst galaxies may have had a mass accretion and star formation history that minimized any baryon-driven expansion effects. Furthermore, it is worth noting that the exceptionally high rate of star formation that defines starburst galaxies is often triggered by interactions and mergers (Lelli et al., 2014c). This is inferred from their RCs, frequently out of equilibrium. The NIHAO project, on the contrary, only simulates isolated galaxies, meaning that it is perhaps not unexpected that they do not reproduce any starburst galaxy, and therefore do not match their observed RCs.
Although NIHAO simulations do not perfectly reproduce observations, their ability to match the general trends in observed RC shapes is encouraging, particularly the match to the features in the velocity region where core formation is predicted to be most efficient. Most observed dwarf galaxies’ RCs in the 60–100 km s-1 range (corresponding to M⊙) indicate the presence of a DM core, whilst most galaxies outside this range show a cuspy DM profile, just as predicted by theoretical models that take into account the effect of gas outflows on DM halos (e.g., Governato et al., 2012). Observations suggest that the implied core sizes vary greatly in extent even in galaxies of similar total mass. Different hydrodynamical simulations with realistic feedback models have shown that this can be explained by the -dependent core formation mechanism (Di Cintio et al., 2014a; Chan et al., 2015; Tollet et al., 2016) where at a given , variations in produce cores of different sizes. Simulations in CDM are therefore able to reproduce the expected diversity of RC shapes, without resorting to alternative DM scenarios (e.g., Kamada et al., 2016; Creasey et al., 2017). Similar results are also obtained with semi-empirical models just by accounting for the scatter in the and relations (see Brook, 2015).
By contrast, explaining the inability of NFW profiles to match the observed trends in RC shapes by invoking observational errors would imply that i) in the km s-1 range, 80 per cent of observed galaxies have errors in their RC measurements that preferentially bias them toward showing a core: this means that the error must be ‘systematic’, favoring the existence of cores, which is the mean observational trend; and ii) such systematic errors must only occur at km s-1, but not at higher or lower . While both circumstances cannot be ruled out (see e.g. Oman et al., 2017), they would point toward some sort of conspiracy for which observational errors mimick the presence of a DM core exactly in the range where we expect DM cores from theoretical models.
We conclude that DM halo expansion within a standard CDM cosmological framework is a viable explanation for the diversity of observed dwarf galaxy RCs.
Acknowledgements
The authors thank the referee Kyle Oman for a critical review of this manuscript. They also thank Federico Lelli for providing the SPARC data in electronic format and for fruitful discussions. Computational resources were provided by the High Performance Computing at NYUAD, the theo cluster at MPIA and the hydra clusters at Rechenzentrum in Garching. This work was partially supported by MINECO/FEDER (Spain) grant AYA2015-63810-P. ADC is supported by the Karl Schwarzschild independent fellowship program. CBB thanks MINECO/FEDER grant AYA2015-63810-P and the Ramon y Cajal fellowship. AD is supported by grants ISF 124/12, BSF 2014-273.
References
- Agertz & Kravtsov (2015) Agertz O., Kravtsov A. V., 2015, ApJ, 804, 18
- Annibali et al. (2003) Annibali F., Greggio L., Tosi M., Aloisi A., Leitherer C., 2003, AJ, 126, 2752
- Beckmann et al. (2017) Beckmann R. S. et al., 2017, ArXiv e-prints
- Binney & Tremaine (2008) Binney J., Tremaine S., 2008, Galactic Dynamics: Second Edition. Princeton University Press
- Bradford et al. (2015) Bradford J. D., Geha M. C., Blanton M. R., 2015, ApJ, 809, 146
- Bradford et al. (2016) Bradford J. D., Geha M. C., van den Bosch F. C., 2016, ApJ, 832, 11
- Brook (2015) Brook C. B., 2015, MNRAS, 454, 1719
- Brook & Di Cintio (2015) Brook C. B., Di Cintio A., 2015, MNRAS, 453, 2133
- Brook et al. (2016) Brook C. B., Santos-Santos I., Stinson G., 2016, MNRAS, 459, 638
- Brook et al. (2012) Brook C. B., Stinson G., Gibson B. K., Wadsley J., Quinn T., 2012, MNRAS, 424, 1275
- Brooks et al. (2017) Brooks A. M., Papastergis E., Christensen C. R., Governato F., Stilp A., Quinn T. R., Wadsley J., 2017, ArXiv e-prints
- Buck et al. (2017) Buck T., Macciò A. V., Obreja A., Dutton A. A., Domínguez-Tenreiro R., Granato G. L., 2017, MNRAS, 468, 3628
- Burkert et al. (2010) Burkert A. et al., 2010, ApJ, 725, 2324
- Butsky et al. (2016) Butsky I. et al., 2016, MNRAS, 462, 663
- Carignan & Puche (1990) Carignan C., Puche D., 1990, AJ, 100, 394
- Catinella et al. (2006) Catinella B., Giovanelli R., Haynes M. P., 2006, ApJ, 640, 751
- Chan et al. (2015) Chan T. K., Kereš D., Oñorbe J., Hopkins P. F., Muratov A. L., Faucher-Giguère C.-A., Quataert E., 2015, MNRAS, 454, 2981
- Cloet-Osselaer et al. (2014) Cloet-Osselaer A., De Rijcke S., Vandenbroucke B., Schroyen J., Koleva M., Verbeke R., 2014, MNRAS, 442, 2909
- Creasey et al. (2017) Creasey P., Sameie O., Sales L. V., Yu H.-B., Vogelsberger M., Zavala J., 2017, MNRAS, 468, 2283
- de Blok (2010) de Blok W. J. G., 2010, Advances in Astronomy, 2010, 789293
- de Blok & Bosma (2002) de Blok W. J. G., Bosma A., 2002, A&A, 385, 816
- de Blok et al. (2008) de Blok W. J. G., Walter F., Brinks E., Trachternach C., Oh S.-H., Kennicutt, Jr. R. C., 2008, AJ, 136, 2648
- Del Popolo (2012) Del Popolo A., 2012, MNRAS, 419, 971
- Deo et al. (2007) Deo R. P., Crenshaw D. M., Kraemer S. B., Dietrich M., Elitzur M., Teplitz H., Turner T. J., 2007, ApJ, 671, 124
- Di Cintio et al. (2017) Di Cintio A., Brook C. B., Dutton A. A., Macciò A. V., Obreja A., Dekel A., 2017, MNRAS, 466, L1
- Di Cintio et al. (2014a) Di Cintio A., Brook C. B., Dutton A. A., Macciò A. V., Stinson G. S., Knebe A., 2014a, MNRAS, 441, 2986
- Di Cintio et al. (2014b) Di Cintio A., Brook C. B., Macciò A. V., Stinson G. S., Knebe A., Dutton A. A., Wadsley J., 2014b, MNRAS, 437, 415
- Di Teodoro & Fraternali (2015) Di Teodoro E. M., Fraternali F., 2015, MNRAS, 451, 3021
- Dicaire et al. (2008) Dicaire I., Carignan C., Amram P., Marcelin M., Hlavacek-Larrondo J., de Denus-Baillargeon M.-M., Daigle O., Hernandez O., 2008, AJ, 135, 2038
- Dutton et al. (2016a) Dutton A. A. et al., 2016a, MNRAS, 461, 2658
- Dutton et al. (2016b) Dutton A. A., Macciò A. V., Frings J., Wang L., Stinson G. S., Penzo C., Kang X., 2016b, MNRAS, 457, L74
- Dutton et al. (2017) Dutton A. A. et al., 2017, MNRAS, 467, 4937
- El-Badry et al. (2017) El-Badry K. et al., 2017, ArXiv e-prints
- Flores & Primack (1994) Flores R. A., Primack J. R., 1994, ApJ, 427, L1
- Fry et al. (2015) Fry A. B. et al., 2015, MNRAS, 452, 1468
- Governato et al. (2010) Governato F. et al., 2010, Nature, 463, 203
- Governato et al. (2012) Governato F. et al., 2012, MNRAS, 422, 1231
- Guo et al. (2016a) Guo H. et al., 2016a, MNRAS, 459, 3040
- Guo et al. (2016b) Guo H. et al., 2016b, ApJ, 831, 3
- Gutcke et al. (2017) Gutcke T. A., Stinson G. S., Macciò A. V., Wang L., Dutton A. A., 2017, MNRAS, 464, 2796
- Haardt & Madau (1996) Haardt F., Madau P., 1996, ApJ, 461, 20
- Hopkins et al. (2014) Hopkins P. F., Kereš D., Oñorbe J., Faucher-Giguère C.-A., Quataert E., Murray N., Bullock J. S., 2014, MNRAS, 445, 581
- Hopp & Schulte-Ladbeck (1991) Hopp U., Schulte-Ladbeck R. E., 1991, A&A, 248, 1
- Hunter et al. (1982) Hunter D. A., Gallagher J. S., Rautenkranz D., 1982, ApJS, 49, 53
- Iorio et al. (2017) Iorio G., Fraternali F., Nipoti C., Di Teodoro E., Read J. I., Battaglia G., 2017, MNRAS, 466, 4159
- Izotov et al. (2016) Izotov Y. I., Guseva N. G., Fricke K. J., Henkel C., 2016, MNRAS
- Kamada et al. (2016) Kamada A., Kaplinghat M., Pace A. B., Yu H.-B., 2016, ArXiv e-prints
- Katz et al. (2017) Katz H., Lelli F., McGaugh S. S., Di Cintio A., Brook C. B., Schombert J. M., 2017, MNRAS, 466, 1648
- Keller et al. (2014) Keller B. W., Wadsley J., Benincasa S. M., Couchman H. M. P., 2014, MNRAS, 442, 3013
- Klypin et al. (2016) Klypin A., Yepes G., Gottlöber S., Prada F., Heß S., 2016, MNRAS, 457, 4340
- Kuzio de Naray et al. (2006) Kuzio de Naray R., McGaugh S. S., de Blok W. J. G., Bosma A., 2006, ApJS, 165, 461
- Lelli et al. (2014a) Lelli F., Fraternali F., Verheijen M., 2014a, A&A, 563, A27
- Lelli et al. (2016a) Lelli F., McGaugh S. S., Schombert J. M., 2016a, AJ, 152, 157
- Lelli et al. (2016b) Lelli F., McGaugh S. S., Schombert J. M., 2016b, ApJ, 816, L14
- Lelli et al. (2014b) Lelli F., Verheijen M., Fraternali F., 2014b, A&A, 566, A71
- Lelli et al. (2014c) Lelli F., Verheijen M., Fraternali F., 2014c, MNRAS, 445, 1694
- Macciò et al. (2012) Macciò A. V., Stinson G., Brook C. B., Wadsley J., Couchman H. M. P., Shen S., Gibson B. K., Quinn T., 2012, ApJ, 744, L9
- Macciò et al. (2016) Macciò A. V., Udrescu S. M., Dutton A. A., Obreja A., Wang L., Stinson G. R., Kang X., 2016, MNRAS, 463, L69
- Martin (2005) Martin C. L., 2005, ApJ, 621, 227
- McCarthy et al. (2010) McCarthy I. G. et al., 2010, MNRAS, 406, 822
- McGaugh & Schombert (2015) McGaugh S. S., Schombert J. M., 2015, ApJ, 802, 18
- McQuinn et al. (2015) McQuinn K. B. W., Lelli F., Skillman E. D., Dolphin A. E., McGaugh S. S., Williams B. F., 2015, MNRAS, 450, 3886
- McQuinn et al. (2010) McQuinn K. B. W. et al., 2010, ApJ, 721, 297
- McQuinn et al. (2009) McQuinn K. B. W., Skillman E. D., Cannon J. M., Dalcanton J. J., Dolphin A., Stark D., Weisz D., 2009, ApJ, 695, 561
- McQuinn et al. (2012) McQuinn K. B. W., Skillman E. D., Dalcanton J. J., Cannon J. M., Dolphin A. E., Holtzman J., Weisz D. R., Williams B. F., 2012, ApJ, 759, 77
- Moore (1994) Moore B., 1994, Nature, 370, 629
- Munshi et al. (2013) Munshi F. et al., 2013, ApJ, 766, 56
- Navarro et al. (1996) Navarro J. F., Eke V. R., Frenk C. S., 1996, MNRAS, 283, L72
- Navarro et al. (1997) Navarro J. F., Frenk C. S., White S. D. M., 1997, ApJ, 490, 493
- Nulsen et al. (2007) Nulsen P. E. J., Jones C., Forman W. R., David L. P., McNamara B. R., Rafferty D. A., Bîrzan L., Wise M. W., 2007, in Heating versus Cooling in Galaxies and Clusters of Galaxies, Böhringer H., Pratt G. W., Finoguenov A., Schuecker P., eds., p. 210
- Obreja et al. (2016) Obreja A., Stinson G. S., Dutton A. A., Macciò A. V., Wang L., Kang X., 2016, MNRAS, 459, 467
- Oh et al. (2008) Oh S.-H., de Blok W. J. G., Walter F., Brinks E., Kennicutt, Jr. R. C., 2008, AJ, 136, 2761
- Oh et al. (2015) Oh S.-H. et al., 2015, AJ, 149, 180
- Oman et al. (2017) Oman K. A., Marasco A., Navarro J. F., Frenk C. S., Schaye J., Benítez-Llambay A., 2017, ArXiv e-prints
- Oman et al. (2015) Oman K. A. et al., 2015, MNRAS, 452, 3650
- Oman et al. (2016) Oman K. A., Navarro J. F., Sales L. V., Fattahi A., Frenk C. S., Sawala T., Schaller M., White S. D. M., 2016, MNRAS, 460, 3610
- Pakull et al. (2010) Pakull M. W., Soria R., Motch C., 2010, Nature, 466, 209
- Peñarrubia et al. (2012) Peñarrubia J., Pontzen A., Walker M. G., Koposov S. E., 2012, ApJ, 759, L42
- Penzo et al. (2014) Penzo C., Macciò A. V., Casarini L., Stinson G. S., Wadsley J., 2014, MNRAS, 442, 176
- Pineda et al. (2017) Pineda J. C. B., Hayward C. C., Springel V., Mendes de Oliveira C., 2017, MNRAS, 466, 63
- Planck Collaboration et al. (2014) Planck Collaboration et al., 2014, A&A, 571, A16
- Pontzen & Governato (2012) Pontzen A., Governato F., 2012, MNRAS, 421, 3464
- Read et al. (2016a) Read J. I., Agertz O., Collins M. L. M., 2016a, MNRAS, 459, 2573
- Read & Gilmore (2005) Read J. I., Gilmore G., 2005, MNRAS, 356, 107
- Read et al. (2016b) Read J. I., Iorio G., Agertz O., Fraternali F., 2016b, MNRAS, 462, 3628
- Rocha et al. (2013) Rocha M., Peter A. H. G., Bullock J. S., Kaplinghat M., Garrison-Kimmel S., Oñorbe J., Moustakas L. A., 2013, MNRAS, 430, 81
- Rodríguez-Torres et al. (2016) Rodríguez-Torres S. A. et al., 2016, MNRAS, 460, 1173
- Sales et al. (2017) Sales L. V. et al., 2017, MNRAS, 464, 2419
- Sánchez-Cruces et al. (2015) Sánchez-Cruces M., Rosado M., Rodríguez-González A., Reyes-Iturbide J., 2015, ApJ, 799, 231
- Schaye et al. (2015) Schaye J. et al., 2015, MNRAS, 446, 521
- Shapley et al. (2003) Shapley A. E., Steidel C. C., Pettini M., Adelberger K. L., 2003, ApJ, 588, 65
- Shen et al. (2010) Shen S., Wadsley J., Stinson G., 2010, MNRAS, 407, 1581
- Sicotte & Carignan (1997) Sicotte V., Carignan C., 1997, AJ, 113, 609
- Stinson et al. (2006) Stinson G., Seth A., Katz N., Wadsley J., Governato F., Quinn T., 2006, MNRAS, 373, 1074
- Stinson et al. (2013) Stinson G. S., Brook C., Macciò A. V., Wadsley J., Quinn T. R., Couchman H. M. P., 2013, MNRAS, 428, 129
- Stinson et al. (2015) Stinson G. S. et al., 2015, MNRAS, 454, 1105
- Swaters et al. (2009) Swaters R. A., Sancisi R., van Albada T. S., van der Hulst J. M., 2009, A&A, 493, 871
- Teyssier et al. (2013) Teyssier R., Pontzen A., Dubois Y., Read J. I., 2013, MNRAS, 429, 3068
- Tollet et al. (2016) Tollet E. et al., 2016, MNRAS, 456, 3542
- Valenzuela et al. (2007) Valenzuela O., Rhee G., Klypin A., Governato F., Stinson G., Quinn T., Wadsley J., 2007, ApJ, 657, 773
- van der Wel et al. (2011) van der Wel A. et al., 2011, ApJ, 742, 111
- van Zee et al. (1997) van Zee L., Haynes M. P., Salzer J. J., Broeils A. H., 1997, AJ, 113, 1618
- Verbeke et al. (2017) Verbeke R., Papastergis E., Ponomareva A. A., Rathi S., De Rijcke S., 2017, ArXiv e-prints
- Verbeke et al. (2015) Verbeke R., Vandenbroucke B., De Rijcke S., 2015, ApJ, 815, 85
- Verheijen (2001) Verheijen M. A. W., 2001, ApJ, 563, 694
- Wadsley et al. (2004) Wadsley J. W., Stadel J., Quinn T., 2004, New A, 9, 137
- Wang et al. (2017) Wang L., Dutton A. A., Stinson G. S., Macciò A. V., Gutcke T., Kang X., 2017, MNRAS, 466, 4858
- Wang et al. (2015) Wang L., Dutton A. A., Stinson G. S., Macciò A. V., Penzo C., Kang X., Keller B. W., Wadsley J., 2015, MNRAS, 454, 83
- Weisz et al. (2014) Weisz D. R., Dolphin A. E., Skillman E. D., Holtzman J., Gilbert K. M., Dalcanton J. J., Williams B. F., 2014, ApJ, 789, 147
- Weisz et al. (2009) Weisz D. R., Skillman E. D., Cannon J. M., Walter F., Brinks E., Ott J., Dolphin A. E., 2009, ApJ, 691, L59
- Wetzel et al. (2013) Wetzel A. R., Tinker J. L., Conroy C., van den Bosch F. C., 2013, MNRAS, 432, 336