The Radial Distribution of Mono-Metallicity Populations in the Galactic Disk as Evidence for Two-Phase Disk Formation
Abstract
Recent determinations of the radial distributions of mono-metallicity populations (MMPs, i.e., stars in narrow bins in [Fe/H] within wider [/Fe] ranges) by the SDSS-III/APOGEE DR12 survey cast doubts on the classical thin - thick disk dichotomy. The analysis of these observations lead to the non-/Fe] enhanced populations splitting into MMPs with different surface densities according to their [Fe/H]. By contrast, /Fe] enhanced (i.e., old) populations show an homogeneous behaviour. We analyze these results in the wider context of disk formation within non-isolated halos embedded in the Cosmic Web, resulting in a two-phase mass assembly. By performing hydrodynamical simulations in the context of the model, we have found that the two phases of halo mass assembly (an early, fast phase, followed by a slow one, with low mass assembly rates) are very relevant to determine the radial structure of MMP distributions, while radial mixing has only a secondary role, depending on the coeval dynamical and/or destabilizing events. Indeed, while the frequent dynamical violent events occuring at high redshift remove metallicity gradients, and imply efficient stellar mixing, the relatively quiescent dynamics after the transition keeps [Fe/H] gaseous gradients and prevents newly formed stars to suffer from strong radial mixing. By linking the two-component disk concept with the two-phase halo mass assembly scenario, our results set halo virialization (the event marking the transition from the fast to the slow phases) as the separating event marking periods characterized by different physical conditions under which thick and thin disk stars were born.
1 Introduction
Recently, the spectra of some 70,000 red giant stars from SDSS-III/APOGEE DR12 (Majewski et al., 2015) have been obtained in the H-band, where the dust effects are not important, providing the element chartography of the Milky Way (MW) over an unprecedented large volume and including for the first time the Galactic plane. This very recent data opened up the possibility to study in more detail the processes occuring along the Milky Way (MW) assembly and evolution, through the imprints they have left into the stellar space distributions.
It has long been known that the stellar populations of spiral galaxies have two main components: a dynamically hot spheroid and a cold disk. A third component, originally detected in the Milky Way through stellar counts (Gilmore & Reid, 1983), has shown up as an ubiquitous excess of red flux at large galactic latitudes in external spiral galaxies (Dalcanton & Bernstein, 2002; Yoachim & Dalcanton, 2006). Detailed kinematic and chemical studies (e.g. Fuhrmann, 1998; Bensby et al., 2003; Soubiran et al., 2003; Bensby et al., 2005; Reddy et al., 2006) confirmed that such excess was due to a distinct component, the thick disk. Later on, statistics studies of thick disks in the local Universe suggests that they are ubiquous in galaxies (Comerón et al., 2011).
Observations (Gilmore et al., 1989, 1995; Fuhrmann, 1998; Bensby et al., 2003; Soubiran et al., 2003; Reddy et al., 2006; Ivezić et al., 2012) indicate that the differences between the thin and thick disks involve: i) shape: the vertical scale-length is smaller for the thin disk than for the thick one (e.g. Dalcanton & Bernstein, 2002; Yoachim & Dalcanton, 2006), ii) kinematics: the thin disk is colder in all velocity components, and it is more rotationally supported than the thick disk (Soubiran et al., 2003), iii) age: thick disk stars are older on average (Gilmore et al., 1995), iv) metallicity: thin disk stars are more metal rich than thick disk ones (Fuhrmann, 1998), and v) /Fe]: the thick disk has enhanced -elements compared to thin disk populations of similar [Fe/H] abundances (e.g. Fuhrmann, 1998; Bensby et al., 2003; Reddy et al., 2006), suggesting shorter star formation time-scales (Fuhrmann, 1998; Ruchti et al., 2010).
These findings have been confirmed by observational studies made within recent or on-going spectroscopic surveys, such as: the RAdial Velocity Experiment (RAVE, Steinmetz et al., 2006), the Sloan Extension for Galactic Understanding and Exploration (SEGUE, Yanny et al., 2009), Gaia-ESO (Gilmore et al., 2012), the Large Sky Area Multi-Object Fiber Spectroscopic Telescope (LAMOST, Cui et al., 2012), Apache Point Observatory Galactic Evolution Experiment (APOGEE, Majewski et al., 2015), Gaia (Gaia Collaboration et al., 2016). The full explotation of these, as well as other planned surveys, such as the GALactic Archeology with Hermes (GALAH, Martell et al., 2017, see also Duong et al. 2017, to be published), or WEAVE, make of this decade a Golden Age for Astroarcheology, where a dramatic advancement in the understanding of the Galaxy is expected.
While authors agree on these distinct properties of thin and thick disks, different methods to assign a given star to the thin or thick populations can be found in literature. A kinematic classification scheme is used extensively in hydrodynamical simulations (e.g. Abadi et al., 2003; Doménech-Moral et al., 2012; Domínguez-Tenreiro et al., 2015), and in observations (Soubiran et al., 2003; Bensby et al., 2003; Kordopatis et al., 2011; Boeche et al., 2013). Other classifications rest on chemical properties such as the [/Fe] vs [Fe/H] (e.g., Bovy et al., 2012b; Adibekyan et al., 2012; Ramírez et al., 2013; Recio-Blanco et al., 2014; Bensby et al., 2014; Hayden et al., 2015; Martell et al., 2017, and references therein), or stellar age (see for example Kubryk et al., 2015). Haywood et al. (2013) use a classification based on the [Si/Fe] vs age relation, where the separation comes from a knee in the two-slope behaviour of this relation that these authors explain in terms of a particular shape for the star formation rate history (SFRH), see Snaith et al. (2014). The two-slope behaviour for [/Fe] - age has been extended to local, early type galaxies by Walcher et al. (2015).
A lot of effort has been so far devoted to understand the origin of the thick disk. Basically two different scenarios exist to explain the thick disk emergence (see reviews in Freeman, 1987; Gilmore et al., 1989; Freeman & Bland-Hawthorn, 2002; Brook et al., 2004; van der Kruit & Freeman, 2011; Ivezić et al., 2012; Feltzing & Chiba, 2013; Minchev, 2017). The first one links thick disks to violent formation processes from turbulent gas prior to thin disk formation. The second scenario assumes a preexisting thin disk that is dynamically heated along secular evolution, with stellar migration (first proposed by Roškar et al., 2008; Schönrich & Binney, 2009; Loebman et al., 2011) or stellar satellite acretion (Abadi et al., 2003) as the main paths.
The first scenarios are supported in particular from cosmological simulations by Brook et al. (2004, 2012b), Stinson et al. (2013), and Bird et al. (2013), see also Scannapieco et al. (2011). Brook et al. (2004) identified a period of fast merging at high where chemically classified thick disk stars form kinematically hot, prior to the formation of thin disk stars. Brook et al. (2012b) confirm the previous scenario and add radial mixing to explain thick disk radial changes. They find that radial mixing has comparatively a minor role in disk thickening and heating. Stinson et al. (2013) extended these results and incorporate the metallicity disk structure to their analysis.
Scannapieco et al. (2011) find that young (old) stars define thin (thick) disk structures, with kinematic and chemical properties reminescent of those of observed thin (thick) disks.
Bird et al. (2013) analyze the radial profiles of surface mass density and kinematics of mono-age stellar populations, aided by a kinematical separation of their simulated galaxy components. They find that most of the kinematically defined thick disk stars form within the first 4 Gyr after the Big Bang, in a dynamically violent period. Their (kinematically defined) thin disk stars formed that early would be members of a chemically thick disk population, recovering in this way Brook et al. (2012b) results that thick disk stars are born early and hot, while thin disk stars are not. They also agree on the role radial mixing has on disk heating and thickening.
The ability of radially migrated inner stars to cause thick, dyanmically hot extended disks is carefully analyzed in Minchev et al. (2012), using both cosmological simulations and pre-prepared ones. In both cases, they also conclude that this process does little for disk heating and thickening, but can change the spatial chemical structure of the disks as shown by Kubryk et al. (2013). These changes, however, do not wash out the chemical imprints left by disk formation according to the pre-prepared simulation results of Curir et al. (2014). Similar results on the effects of radial migration along secular evolution have been presented by Vera-Ciro et al. (2014).
Some observational results suggest or are consistent with the previous scenario. For example, Haywood et al. (2013), Snaith et al. (2014) and Haywood et al. (2015), who, from an analysis of the chemical properties of a set of solar vicinity FKG stars (Adibekyan et al., 2012), combined with a careful determination of their age, conclude that the thick disk stars have formed at early times out of a turbulent gas, setting the chemical conditions for a latter thin disk formation in a more quiescent situation.
Different results from different surveys point in this direction. For example, Kordopatis et al. (2015) found, in their analyses of data from the Gaia-ESO survey, that the mixing of metals in the young Galaxy (e.g. turbulent gas in disks or radial stellar migration) was more efficient at early times before the (current) thin disk started forming (see also Mikolaitis et al., 2014). Other authors also prefer this scenario on the basis of their results on radial and/or vertical abundance gradientes from different surveys (see, for example Cheng et al., 2012; Xiang et al., 2015, from RAVE and LAMOST data, respectively) or consider this possibility (Boeche et al., 2014). Comerón et al. (2015) present the first Integral Field Unit spectroscopy of an edge-on galaxy, ESO 533-4, with enough depth and quality to study the thick disk. Even if not conclusive, their results suggest that the thick disk of ESO 533-4 formed in a relatively short event prior to the thin disk.
As for the second scenario, authors highlight different processes acting on a preexisting thin disk as the origin of the thick disk: radial migration (Roškar et al., 2008; Schönrich & Binney, 2009; Loebman et al., 2011), stars accreted through satellites and dragged into the plane of a pre-existing disk (Abadi et al., 2003; Meza et al., 2005), heating of a pre-existing disk by satellite accretion (Quinn et al., 1993) and later on confirmed by other authors (see, e.g. Hayashi & Chiba, 2006; Kazantzidis et al., 2008; Villalobos & Helmi, 2008; Bekki & Tsujimoto, 2011; Qu et al., 2011) and more recently by Moetazedian & Just (2016) and Ruiz-Lara et al. (2016). The secular thickening of a disk embedded in a fluctuating potential has also been investigated (Fouvry et al., 2016a, b), as well as the effects of early massive clump formation in unstable gas-rich disks (e.g. Noguchi, 1999; Bournaud et al., 2007; Agertz et al., 2009; Ceverino et al., 2010), see however Buck et al. (2016) or the popping of stellar clusters (Kroupa, 2002; Assmann et al., 2011) on disk thickening. These two last scenarios link thickening to formation processes rather than to the heating of a pre-existing thin disk.
We see that there is currently a living debate on the origin of the thick disk. The metallicity cartography of the Galactic disk provided by the APOGEE project contribute new very interesting possibilities therein.
Of particular interest for studies on the thin and thick disk are mono-metallicity populations (MMPs, i.e., stars in narrow bins in [Fe/H] within wider [/Fe] ranges). Analyzing the red giant sample from SDSS-III/APOGEE DR12, Bovy et al. (2016) present a careful determination of their radial structure, and show that radial MMPs distributions show a bimodal behaviour according to their [/Fe] content: i) MMPs with enhanced [/Fe] show disk radial surface densities, (Rcyl), that are well described by single exponential distributions, with a unique scale length no matter the MMP, confirming, with a much better statistics and radial coverage, previuos results by Bovy et al. (2012c) in the SDSS/SEGUE survey, see also Kordopatis et al. (2012). ii) MMPs with low-[/Fe] show a more complex behaviour, with their respective MMP radial surface densities exhibiting continuously varying shapes, more centrally concentrated as [Fe/H] increases, and whose overall envelope is an exponential disk.
Taking enhanced and low-[/Fe] stellar populations as thick and thin disk populations, respectively, Bovy et al. (2016) maintain that the results above cast doubts on the classical thin - thick disk dichotomy, because of the complexity of thin disk splitting into MMPs with different surface densities. This issue has not yet received a complete answer so far (but see Haywood et al., 2016; Minchev et al., 2017), in particular when a cosmological context is envisaged. The aim of this paper is to analyze this question within the wider context of disk formation inside non-isolated halos, more particularly whithin the two-phase assembly scenario of halo formation. Analytical models as well as N-body simulations show that two different phases can be distinguished along the halo mass assembly, as first proposed by Wechsler et al. (2002); Zhao et al. (2003); Brook et al. (2005); Salvador-Solé et al. (2005), see also Griffen et al. (2016) for recent results. These are: i) first a violent rapid phase with high mass aggregation rates, resulting from collapse-like events in the Cosmic Web environment, implying high merger rates, and ii) later on a slow phase with lower mass aggregation rates. Small box hydrodynamical simulations (Domínguez-Tenreiro et al., 2006) as well as larger box ones (Oser et al., 2010; Domínguez-Tenreiro et al., 2011) confirmed this scenario, as well as its implications on a possible scenario for thick disk formation (Brook et al., 2004), elliptical properties at low redshift (Cook et al., 2009), and on classical bulges (Obreja et al., 2013).
In this paper we employ hydrodynamical simulations in a cosmological context in order to address the question: to what extent can the two-phase halo assembly scenario determine the detailed MMP disk chartography, now available, in terms of the thin versus thick disk differentiation ? To answer to this question, we need to find out the physical basis of the thin versus thick disk differentiation within the two-phases scenario, an issue addressed in depth in this work.
The paper is organized as follows. In Section 2 we describe the codes and the simulated galaxies. The occurrence of a two-phase mass assembly for these galaxies is examined in 3, where the separating event between the phases is identified as halo virialization, defining a timescale tvir. In this section we propose a classification scheme for stars into thick and thin populations based on tvir and in 4 we study its relationship with a chemical classification based on age. In 5 we confirm that this classificaction scheme leads indeed to thin and thick disk populations whose properties differ in agreement with observational data. The radial MMP distributions for the disks of simulated galaxies are analyzed in 6, where we show that Bovy et al. (2016) results are recovered. To decipher the physical processes underlying this behaviour, the stellar birth places are linked to their birth times and metallicity in 7, and are analyzed in terms of the gas metallicity structure before and after tvir. With these findings in mind, we come back to the two-phase galaxy assembly in 8, and analyze the effects each phase has on the physical conditions for star formation, gas metallicity gradients maintenance and removal, and the matching of the MMP distributions at stellar birth to those observed at z=0. The summary, discussion and conclusions are presented in 9.
2 Codes and Simulations
Accurate conservation of angular momentum, a detailed implementation of chemical evolution, and the effects of discrete energy injection by stellar physics are fundamental issues in cosmological hydrodynamical simulations. Comparisons of results using different codes is advisable, because we are looking for effects coming from a generic and fundamental level of physical description. In view of these considerations, in this paper we present results of simulations run with two different SPH codes: P-DEVA and GASOLINE.
P-DEVA (Martínez-Serrano et al., 2008) is an entropy conserving AP3M-SPH code where the main concern in its design was angular momentum conservation. Chemical evolution implementation makes use of the Qij formalism (Talbot & Arnett, 1973), which relates each nucleosynthetic product to all its different sources. Ejecta from SNe as well as from low and intermediate mass stars have been taken into account. The stellar evolution data described in Gavilán et al. (2005) have been used for low and intermediate mass stars, and those in Woosley & Weaver (1995) for high-mass stars. SNIa rates were computed according to Ruiz-Lapuente et al. (2000) and their element production according to Iwamoto et al. (1999). We have considered the evolution of the following elements: H, He4, C12, C13, N14, O16, Ne20, Mg24, Si28, S32, Ca40, and Fe56. Stellar feedback is implicitly implemented through (inefficient) star formation parameters, as discussed in Agertz et al. (2011).
In GASOLINE (Wadsley et al., 2004) SNe feedback is implemented using the blastwave-formalism (Stinson et al., 2006). In the MaGGIC runs (Brook et al., 2012a) feedback from massive stars is also taken into account (Stinson et al., 2013a). The chemical evolution implementation follows Raiteri et al. (1996), and we track nine elements: H, He4, C12, N14, O16, Ne20, Mg24, Si28, and Fe56. Metals are ejected from SNII, SNIa, and the stellar winds driven from asymptotic giant branch (AGB) stars, using literature yields for SNIa (Nomoto et al., 1997). Each SN releases 1051 erg, and the cooling is delayed for 4 Myr for the neighbouring gas particles. Ejected mass, metals and thermal energy from SNe are distributed to the nearest neighbour gas particles using the smoothing kernel (Stinson et al., 2006).
In both codes the star formation recipe follows a Kennincutt – Schmidt- like law with a given density threshold, , and star formation efficiency c∗. In both codes it is assumed that stars more massive than 8 M⊙ produce type II supernovae (SNII), and the yields of Woosley & Weaver (1995), with the Fe ejecta divided by two according to Timmes et al. (1995), have been adopted. Also stars take and retain their progenitor gas particle abundances. The abundance increments synthetyzed by a given stellar particle within an integration timestep are transferred to its nearest gas particle allowing stars to share their yields with the surrounding interstellar medium.
In both codes, abundance diffusion within the gas is included based on (unresolved) turbulent mixing (see, for example, Scalo & Elmegreen, 2004), ensuring that gas abundance increment reaches farther away from the stellar position and explosion sites. This metal mixing tends to equilibrate the element content of spatially close gas particles,
| Object | Mbar | hsoft | c∗ | IMF | M∗ | Mgas | tchem | Lbox | |
|---|---|---|---|---|---|---|---|---|---|
| 105M⊙ | h-1kpc | cm-3 | % | 1010M⊙ | 1010M⊙ | Gyr | Mpc | ||
| g1536-L | 1.90 | 0.15 | 9.4 | 3.3 | Chab03 | 2.32 | 1.97 | 8.0 | 34 |
| HD-5004A | 3.94 | 0.20 | 6.0 | 1.0 | Salp55 | 3.26 | 0.67 | 7.7 | 10 |
| HD-5101A | 3.79 | 0.20 | 12.0 | 0.8 | Salp55 | 1.29 | 0.33 | 7.2 | 10 |
A zoom-in simulation technique has been used, with initial baryon particle masses Mbar, minimal smoothing length hsoft, and periodic box length Lbox given in Table 1, where we also give the star formation efficiency c∗, and density threshold parameters. We explore two P-DEVA galaxies (HD-5004A and LD-5101A) and one GASOLINE - MaGICC galaxy (g1536-L∗). Their stellar and gaseous masses are given in Table 1. The main difference between the two P-DEVA galaxies is that, by construction, HD-5004A forms and evolves in a dense environment, while LD-5101A lives in a lower density one. For the g1536-L∗ galaxy the halo to be zoomed-in has been chosen to have low merging activity.
These P-DEVA galaxies have been studied by Doménech-Moral et al. (2012) at z=0, who analyze some of their thin versus thick population properties, GASOLINE ones by Brook et al. (2012b), Stinson et al. (2013) and Obreja et al. (2014). In addition, Obreja et al. (2013) who addressed bulge formation, Domínguez-Tenreiro et al. (2014) who analyzed their HI and H2 content and panchromatic SEDs, and Miranda et al. (2016) who studied abundance gradients, included galaxies run using both codes. In all these cases the consistency with observational data is very satisfactory, including the differences between the thin and thick disk described in 1 analyzed in these papers.
3 A two-phase mass assembly ?
A key issue in this paper is to elucidate if the halos of the analyzed systems had their mass assembled through a two-phase process, as argued in 1.
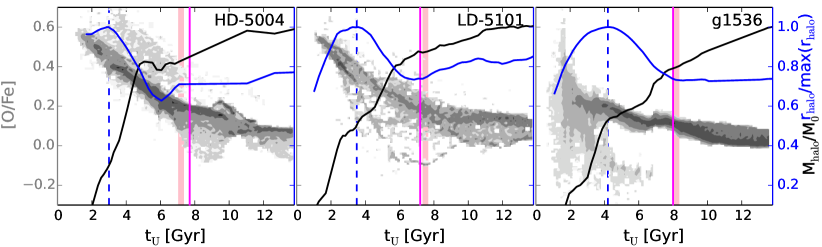
The answers lie in Figure 1, where the evolution of the halo mass assembly is illustrated through the plot of the halo virial mass, Mhalo(tU), as a function of time (black curves). In this figure mergers appear as discontinuities, Mhalo(tU), spanning their respective merger time interval. Expectedly (see 1), we see that two phases clearly stand out, a fast one, where the rate of mass assembly (i.e., the curve slope at given times) is very fast (high slopes), and a slow one, when this rate is low or very low (low slopes), see, i.e. Griffen et al. (2016) for a recent similar result. Note also that, at high redshifts, mergers have their respective merger time intervals superimposed in some cases (resulting in a rather continuous slope), with Mhalo(tU) showing a wide range of values. In the slow phase the discontinuities are less frequent and tend to be smaller, with no major mergers in any of the three galaxies. An analysis of these curves in detail, taking into account the cosmological context, indicates that the frequent mergers at early times are but the effects of the collapse of the region surrounding the halo111Therefore collapse and high redshift mergers have similar meaning.. This explains the violence of the mass-building events at high redshift, and is the basis for the so-called two-phase formation scenario.
As a second proof of the two-phase behaviour shown by haloes, in each of the three panels of Figure 1 we plot the radii, rhalo(tU), that enclose the particles forming the respective z=0 haloes at different tU (blue curves). The radii have been normalized to their respective maximum values. We see that these radii first increase, until they reach a maximum (turn-around) and then they decrease, until they come to a quasi-equilibrium value retained up to z=0. This rhalo(tU) behaviour indicates that at high redshift, after expansion and turn-around, we witness halo collapse and virialization in consistency with the spherical collapse model predictions, see Padmanabhan (1993), followed by a slower period of evolution. In each panel of this figure the short time interval separating the decreasing from the quasi-equilibrium behaviour of rhalo(tU) curve (marked with a pink band) is close to, and in some cases rather coinciding with, the short time interval separating the halo mass assembly rates from fast to slow. This is expected because both dynamical timescales mark halo virialization. Therefore, only a dynamical timescale tvir, based on the pink bands, is considered in this paper.
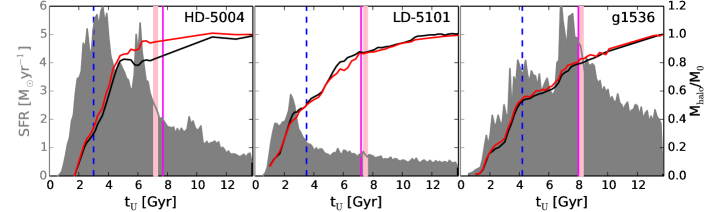
This two-phase halo mass assembly translates into a two-phase baryon mass assembly at the galactic scale. This is illustrated in Figure 2, where we plot again Mhalo(tU) (black curves) and Mbar(tU), the baryon mass in the galactic object along the evolution (red curves). We see that Mbar(tU) roughly follows Mhalo(tU), and it also shows a two-phase behaviour, with no major mergers along the slow phase in any of the three panels. For more details, see for example Figure 3 in Obreja et al. (2013), where the mass aggregation tracks along the main branch of the merger tree (MATs) are given at different fixed radii, both for its cold baryons and stars. The Mhalo(tU) curves are also plot and a correspondence between the mass increments (i.e., merger events) at both scales, halo and galaxy, clearly stands out 222It is worth noticing that the shapes of these stellar MATs are qualitatively consistent with those of the cumulative stellar mass curves as a function of the redshift, for the MW and MW-like galaxies (van Dokkum et al., 2013; Snaith et al., 2014)..
Therefore we can conclude that not only do our simulated galaxies show a two-phase halo mass assembly, but the baryon mass assembly of the whole disk galaxy shows a two-phase behaviour too, closely linked to that of its respective halo.
Let us stress that the physical conditions for star formation are very different before and after tvir. Before virialization, stellar activity, either star formation (Figure 2), winds or SNe explosions, is very high. The many fast mergers inject mechanical energy into the early galactic system, and together with the energy from discrete sources (i.e., energy feedback), they increase the gas turbulence. At the same time, the systems experiences high rates of infall of low metallicity gas. The mixing of infalling with in-situ gas, aided by turbulence, is an effective way to remove metallicity gradients. In addition, in this violent phase the gravitational potential is time-dependent, and therefore scattering of the already-formed stellar populations can be expected too. Thus, the spatial distribution of stars can change considerably along the fast phase relative to that at their birthtime.
In contrast with this situation, during the slow assembly phase the potential at the halo scale is nearly spheroidal and axial at galactic scales. Axial symmetry can occasionally be broken, for example owing to disk disruption caused by satellites or when a bar develops. On the other hand, gas turbulence is expected to be low during this phase, because energy injection events are now scarce at any scale.
The expected imprints of these different conditions on the properties of the stellar populations born before and after virialization are in line with the properties of the thick and thin disk stars, respectively, properties highlighted on the basis of an classification. In section 5 we show that this is indeed the case. However, the timescale tvir is not an observable. In order to make the comparison to observations possible, we need first to find out an timescale that is linked to tvir to classify disk stars. In the next section we show that there is a chemical timescale that matches this requirement.
4 Component Classification of Stellar Populations
To identify three components in the simulations we proceed in two steps. First, stars are split into their spheroid (bulge and stellar halo) and disk components, using the -means method in the space of kinematical variables (see Doménech-Moral et al., 2012; Dhillon et al., 2004). The following kinematical variables are used: energy , eccentricity , and , where and are the projections of a given particle angular momentum on the disk axis and plane, respectively, and is the angular momentum of the circular orbit with energy. With this method, the spheroid and disk star properties found in observations are recovered (Doménech-Moral et al., 2012; Obreja et al., 2013; Domínguez-Tenreiro et al., 2015). A similar kinematic selection is made for the GASOLINE galaxy.
In a second step, disk stars have to be assigned to either the thin or the thick disk, based on an empirical timescale linked to tvir. As said in 1, the empirical classification methods resting on a timescale take advantage of the two-slope behaviour of the [/Fe] - age relation, based on solar-neighborhhod stellar data and recently extended to early type galaxies.
The SFRH for the whole galaxies333We need this complete information because disk stars form out of gas enriched by the ejecta of the explosions and winds of all the co-spatial stars belonging to any component. are given in Figure 2. We see that early SFRs are high (i.e., they show a low characteristic timescale for SF) and then they decrease to low values at later times. For the g1536-L∗ galaxy, the SF timescale contrast between early and late SFRs is less marked than for the other two galaxies.
The chemical [O/Fe]-age relation for disks are drawn in Figure 1, where we can see that they show a two-slope behaviour (rather steep at high z and much flatter at low z), as their zeroth order shape444[Mg/Fe] vs age plots show a two-slope behaviour similar to that of [O/Fe]-age.. The slope contrast is less marked for g1536-L∗ galaxy than for the other two (because the SF timescales contrast between early and late SFRs is less important here), and in addition it shows a lurch around t 7 Gyrs, i.e., when its SFRH (Figure 2) shows an excess after a dip (see Figure 10 in Snaith et al., 2015, for an explanation).
This global two-slope behaviour can be used to define a chemical scale separating the thin from the thick disk populations. The simplest option is to make a two-slope fit to the [O/Fe] - age plot. Among the different possible solutions, we have chosen the solution tchem that is the closest to tvir. The tchem values are observational proxies for tvir. Their values for the simulated galaxies are given in Table 1, and are marked as vertical magenta lines in Figures 1 and 2.
The next task is to make sure that the stellar populations classified as belonging to the thick and thin disks (i.e., older and younger than tchem respectively) do show different elemental abundance distributions as well as different kinematics, and indeed different trends in kinematics with age, with metallicity and with [/Fe], similar to those found in observational data, see 1.
5 Thin and Thick Disk Properties
A detailed analysis of the different properties shown by stars in the thick and thin disk components in a sample of P-DEVA galaxies can be found in Doménech-Moral et al. (2012). These authors have analyzed the respective sizes and shapes, as well as the age, [/Fe] and [Fe/H] distributions of the different galaxy components according to different classification schemes. Their conclusions are that the properties shown by thin and thick disk stars in this simulated sample of galaxies are nicely consistent with observations, irrespective of the classification scheme used. Similar analyses has been performed for GASOLINE g1536-L∗ galaxy (see, for example Stinson et al., 2013).
In what follows we go deeper into these different properties, focusing into the different trends in three dimensional kinematics with age, metallicity and [/Fe] shown by the disks, and their comparison to observational data. It is worth to note that detailed data for stellar populations are currently only available for the MW, while our simulations have been run from random, i.e., non-constrained, initial conditions. Therefore, only qualitative consistency between the former and the later can so far be required to pass the validation test, with quantitative agreements adding further strenghths, but not being strictly necessary.
The particle velocity field is usually expressed in cylindrical coordinates (the symbols Vϕ, Vz, and VR will hereafter be used for the tangential, vertical, and radial velocities, respectively, and , , and for their corresponding dispersions). The velocities are calculated relative to the galaxy center of mass, and the system is oriented such that the z-axis at tU is parallel to the angular momentum of the gaseous disk at the same epoch. All the results shown in this section refer to the 3 kpc Rcyl 20 kpc disk shells, where Rcyl is the radial distance in the cylindrical coordinate system. Results for the 6 kpc Rcyl 10 kpc galaxy shells, somewhat similar to the MW solar neighborhood in its geometric characterization, show no remarkable differences but a higher statistical noise. For this reason, we present only the results in 3 to 20 kpc cylindrical shells.
5.1 Kinematics versus stellar age
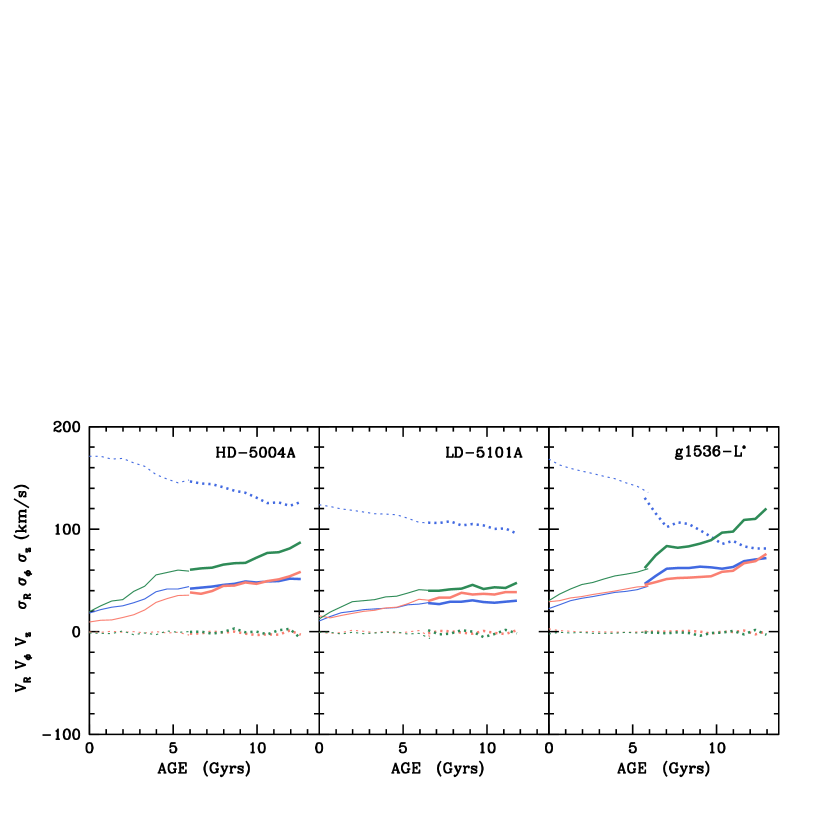
Figure 3 shows the tangential, Vϕ(age), vertical, Vz(age), and radial, VR(age), velocities (dotted lines) and their respective velocity dispersions (solid lines) for the three simulated galaxies. Curves corresponding to the thick (thin) disk components are plotted using thick (thin) line types. The horizontal axis bin sizes are 0.66 Gyr. No qualitative changes result when using half this value.
We see that in all the cases, as expected, the thin disk appears to be more rotationally supported than the thick one. The differences at equal Rcyl (not drawn) are in the range 35 - 15 km s-1, consistent with Veltz et al. (2008), who find an asymmetric drift of Vlag = 33 2 km s-1 for the Galactic thick disk. Similar values were found for example by Chiba & Beers (2000) and Dambis (2009). The Vϕ(age) curves show a decreasing behaviour with increasing age, in consistency with Haywood et al. (2013), see their Figure 16555Note that the yellow points in Figure 16 of Haywood et al. (2013) belong to the thick disk as defined in this paper.. The g1536-L∗ galaxy shows a remarkable decrement due to major mergers around t 7 Gyr, that changes the ordered radial velocity into velocity dispersion. Therefore, our simulated galaxies recover the qualitative behaviour of local stars regarding Vϕ(age).
The deviations of the Vz and VR curves from zero are a measure of the misalignments of the stellar disk plane from the cold gaseous one at each tU. No remarkable differences show up, except for weak fluctuations that in some cases become more important in the old age end, where disks are not well defined yet. It is worth noticing that these curves inform about stellar disks occurrence as early as 12 Gyr ago.
Concerning the velocity dispersions, the (age), (age), and (age) curves show that the thick disk has always higher velocity dispersion values than the thin one. More specifically, the (age) and (age) curves (blue and green solid lines) show up common shape patterns as we go from young to old stellar populations (patterns not found in LD-5101A). After a slow increase with age for young stars, a marked dispersion increase within a short age interval is apparent, followed, again, by a low slope or even flat behaviour. Even if the issue is beyond the scope of this paper, we note that these g1536-L∗ and HD-5004A abrupt velocity dispersion increments occur at ages when the disks suffer a particularly violent and/or destabilizing dynamical event. These are: major mergers around tU 7 Gyr (age 6.5 Gyr) for g1536-L∗, see Figure 1, or a loss of axial symmetry around tU 9.5 Gyr (age 4.0 Gyr) for galaxy HD-5004A, see Figure 9. Galaxy LD-5101A is not involved in any such a kind of events, and, consequently, it does not show such remarkable slope changes either.
The vertical velocity dispersion (solid red curves) tends to increase with age too. However, the changes of slope are less important and less abrupt than the in-plane dispersions.
These patterns are consistent with Haywood et al. (2013) results, see the velocity dispersions curves shown in their Figures 11 and 12, where an almost flat behaviour at the young age end, followed by a fast increase, stand out.
Comparing Figure 3 with the MW values of these dispersions listed in Table 2, we can see that not only the trends but also the numerical values of the dispersions are satisfactorily consistent with observational data. To assess the degree of consistency, we should keep in mind that the LD-5101A galaxy is less massive that the MW, and that the g1536-L∗ galaxy has suffered a major merger near tvir. Also, at the old age end (say age older than 10 Gyr) the stellar disk of g1536-L∗ galaxy is poorly populated.
| (km s-1) | (km s-1) | (km s-1) | Reference | |
|---|---|---|---|---|
| Low age end | 25 | - | 10 | Haywood et al. 2013 |
| 25 2 | 20 4 | 10 1 | Vallenari et al. 2006 | |
| Old age end | 70 | - | 45 | Haywood et al. 2013 |
| 74 11 | 50 7 | 38 7 | Vallenari et al. 2006 | |
| 63 6 | 39 4 | 39 4 | Soubiran et al. 2003 |
5.2 Kinematics versus [/Fe]
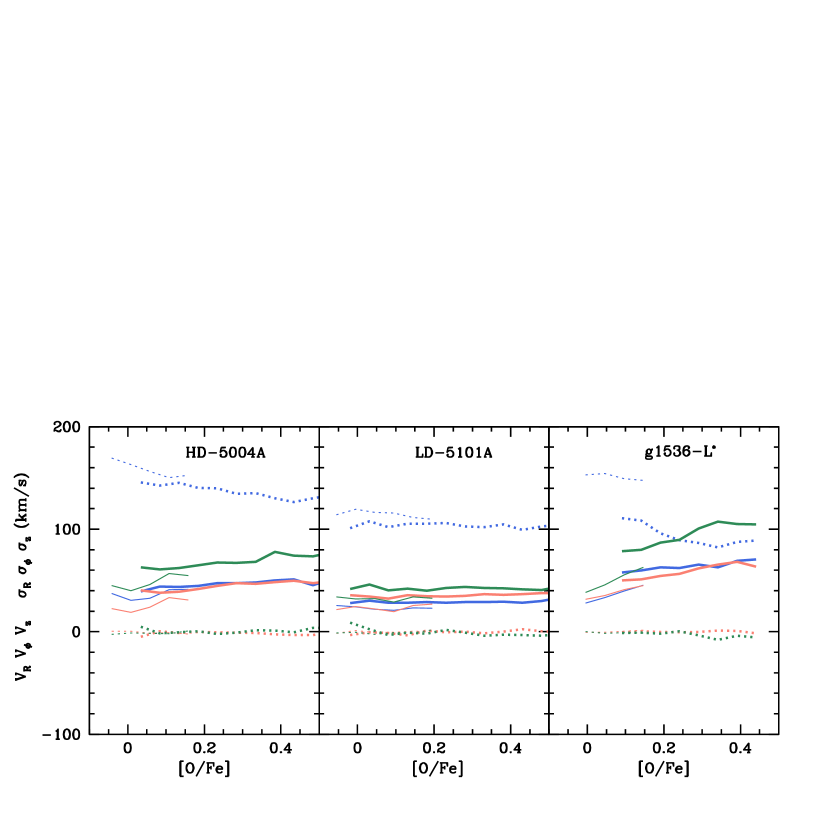
The kinematics versus [O/Fe] relations are drawn in Figure 4 for the three simulated galaxies, where the horizontal bin sizes are 0.05 dex. No significant changes occur when using a bin size of 0.025 dex. We see that the disk tangential velocities, Vϕ (dotted blue curves) for thick disks are always lower than those corresponding to thin disks. They tend to decrease with increasing enrichment, in consistency with Recio-Blanco et al. (2014) for chemically classified thin-thick disk stars from GAIA-Giraffe data, see their Figure 18. It is worth noticing that a gap exists between thin and thick populations rotations Vϕ([/Fe]), even in the [/Fe] ranges where both populations have similar values, recovering observational trends found by Haywood et al. (2013) (their Figure 14).
Thick disks vertical and radial dispersion curves, and respectively, are flat or very slowly increasing in Figure 4. Thin populations curves increase for [O/Fe] higher than 0.0 dex in two galaxies. Thick disk populations are always dynamically hotter than the corresponding thin ones.
Lee et al. (2011) have analyzed the kinematics - [/Fe] relations in the SEGUE G-dwarf sample. By ploting dispersions versus [/Fe] with no thin-thick disk splitting, they show that the relation is flat at lower [/Fe], and then it increases. The same behavior is shown in particular by HD-5004A galaxy when no classification of stars is taken into account. They also found that the dispersions at the low /Fe] end (mostly young stars, that is, not affected by specific dynamical events) increase from ([/Fe]) to ([/Fe]), and further to ([/Fe]), in consistency with our findings. The numerical values are also consistent for HD-5004A. Similar trends have been found in RAVE data (Steinmetz et al., 2006) by Minchev et al. (2014).
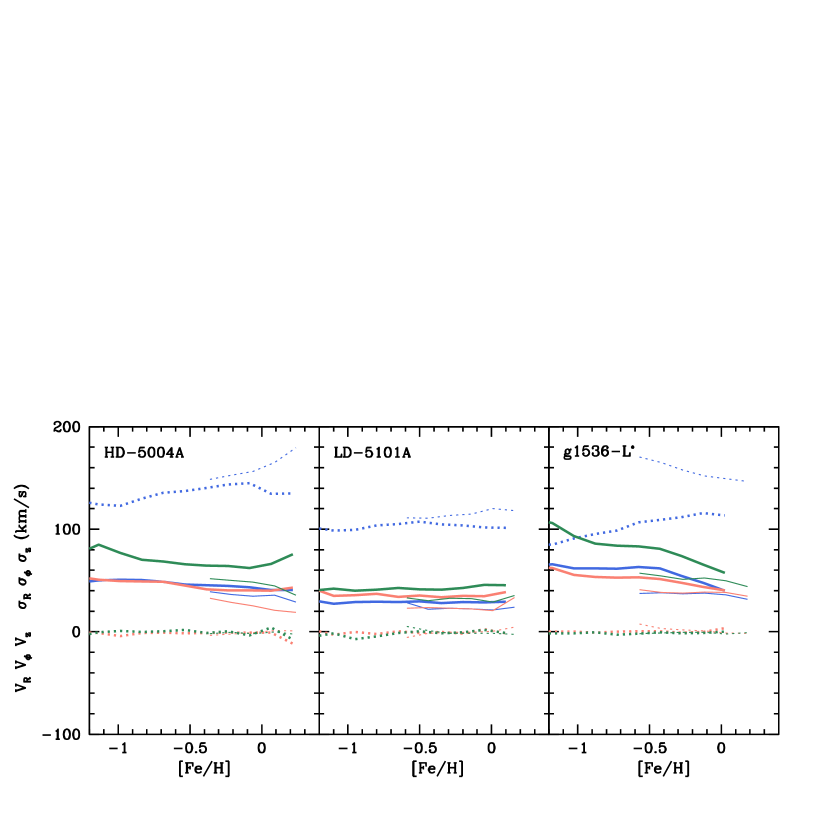
5.3 Kinematics versus [Fe/H]
In Figure 5 we plot the kinematic curves versus [Fe/H]. We used a horizontal bin size of 0.15 dex and results are stable when e.g. halving this value. In this figure, the tangential velocity curves, Vϕ([Fe/H]), for the thick disks of HD-5004A and g1536-L∗ (thick dotted blue lines) increase with [Fe/H]. The tangential velocity thin disk curve is clearly decreasing for g1536-L∗. In any case, the thin disk Vϕ([Fe/H]) curves show a gap relative to the thick disk ones in the [Fe/H] intervals populated by both thin and thick disk stars. These patterns of the tangential velocity curves are consistent with the findings of Lee et al. (2011), their Figure 3; Haywood et al. (2013), their Figure 14; Recio-Blanco et al. (2014), their Figure 17; Allende Prieto et al. (2016) from GAIA DR1 data combined with APOGEE, their Figure 3.
As for the dispersions in our simulated galaxies, their shapes for the thick disks are rather flat, except for g1536-L∗ whose ([Fe/H]) (thick solid blue lines) and ([Fe/H]) (thick solid green lines) are slightly decreasing for [Fe/H] -0.5 dex. Thin disk dispersions decrease with [Fe/H] for HD-5004A and are rather flat in the other two cases. A gap in the velocity dispersiond between thin and thick populations is found for the three galaxies, with those corresponding to the thick disk always higher than those corresponding to the thin one. The highest dispersions are always in the radial direction. These behaviours are consistent with Recio-Blanco et al. (2014) results, see their Figure 20.
To summarize, the well-established fact that thin- and thick-disc stars show different kinematics, and indeed different trends in kinematics with stellar age, metallicity and [/Fe], is nicely recovered by our simulated galaxies. This completes previous results on thick vs thin disk star properties. We therefore have thin and thick disks in our simulated galaxies, with the correct behavior as expected from observations. Thus, our simulations can be used as a testbed to analyze the origin of the thin versus thick disk differentiation, as well as the origin of the MMP radial distributions found by Bovy et al. (2016). This is the aim of this paper, and the next sections are devoted to study this issue.
6 MMP Distributions
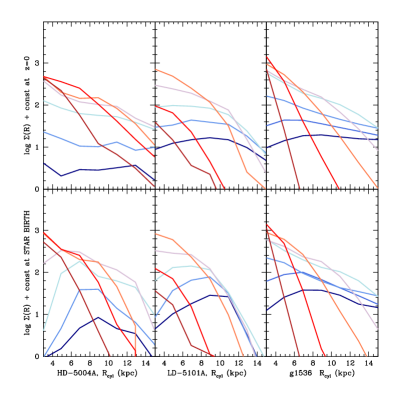
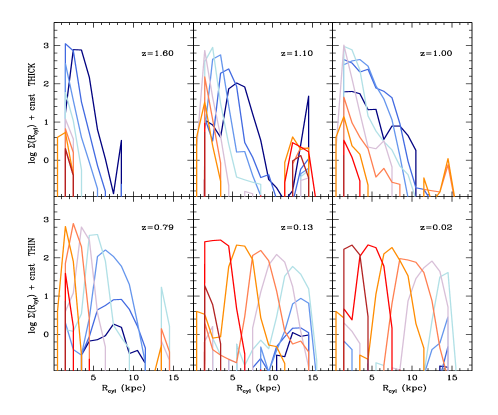
The star surface number densities (Rcyl) have been calculated for MMPs, and depicted in the first row of Figure 6 for the thin (left) and the thick (right) disk stars, respectively. Colors stand for different [Fe/H] bins, which for thin disks are navy blue [Fe/H] -0.4 and brick color for [Fe/H] 0.2 ( [Fe/H] 0.3), for HD-5004A and LD-5101A (g1536-L∗), the other colors stand for 5 (6) intermediate 1 dex wide [Fe/H] bins. For the thick disks, color bins are: pale green [Fe/H] -0.8, sky blue for [Fe/H] -0.25, the other colors stand for 3 intermediate, 2 dex wide bins.
The MMP surface number densities show a dichotomy: i) the (Rcyl) for thick disks have similar scalelengths no matter the MMP (except for the most metal rich one in g1536-L∗), and no breaks (see Stinson et al., 2013, for similar results), ii) for the thin disks, (Rcyl) have different shapes depending on the MMP: those corresponding to high [Fe/H] bins peak at low Rcyl, while those corresponding to low [Fe/H] values are rather flat. Moreover, some slope changes appear that tend to be placed at increasing Rcyl for lower [Fe/H]. Qualitatively, we recover the APOGEE results for the Galactic MMP radial structure, for high and low [/Fe] populations (a proxy for old and young populations, respectively).
7 Star Birth Places and Gas Metallicity Structure
To decipher the physical processes underlying this behaviour, the birth places for each star belonging to either the thin or the thick disks have been determined. In the bottom panels of Figure 6 we plot the surface number densities the thin (left) and thick (right) disks would have if stars had not moved away from their birth places. The [Fe/H] bins are the same as those corresponding to their respective upper panels. These plots indicate that different MMPs are preferentially born at different locations, characterized by an increasing Rcyl as the metallicity decreases, the effect being much more marked for the thin than for the thick disk populations. We can also see that thick disks had their stars diffused outwards between their birth time and z=0.
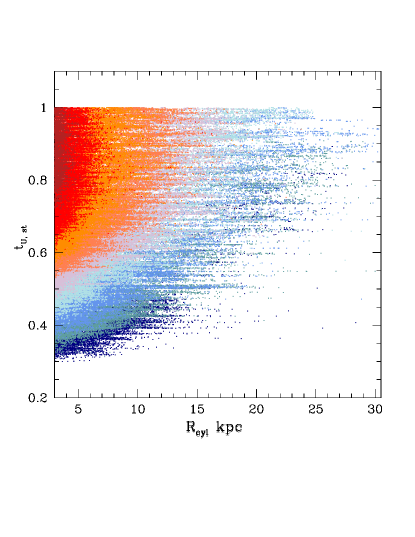
Different MMPs are also preferentially born at different epochs, tU, as Figure 7 shows for the disk of g1536-L∗, see color code at the caption. Note that they are not mono-age populations, see Minchev et al. (2017) for similar results. 666The paucity of disk stars born outside the disk seen in Figure 7 is a result of the g1536-L∗ galaxy construction. Remember that in this case the halo to be zoomed-in has been chosen to have low merging activity. Results for HD-5004A and LD-5101A show a higher fraction, in consistency with other author´s findings (e.g., Abadi et al., 2003; Scannapieco et al., 2011; Tissera et al., 2012). At fixed times, i.e., horizontal cuts in this figure, stars reflect the gas metallicity structure at their birth.
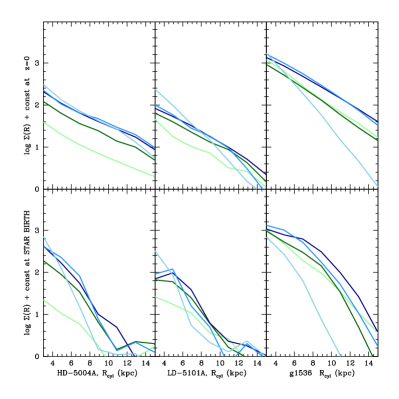
The gas distributions at different times, tU, are shown in Figure 8 for HD-5004A, within the range of thick and thin disk formation ages (top and bottom rows, respectively). Colors stand for different [Fe/H] bins, with the same color code as in Figure 7. In this figure we can see a segregation in galactocentric distance, according to gas metallicity in the thin disk. This segregation is not removed by metal enrichment due to stellar evolution. This segregation and its preservation across time implies that thin disk stars belonging to different MMPs are born at preferential times and disk locations.
Regarding the thick disk, in the early period when its stars are born, the gas Rcyl segregation due to metallicity is not as important as later on. In fact, this segregation does not appear until z 1.5, and once it appears, it is almost removed each time a dynamically violent event occurs (because they favour metals mixing, see 3). These sequences of order-disorder can be appreciated in the top row of Figure 8. Similar situations arise for the other two simulated galaxies. As a consequence, the stellar MMPs differentiation at birth for thick disk stars are not that marked as in the case of the thin disk.
8 Two-phase Mass Assemblies Again
Violent dynamical events occur much often at early times than later on, along the thin disk formation period, because of the two-phase characteristic of mass assembly. This has been proven and discussed in 3. We now focus on how the dichotomy fast / slow rates of mass assembly affect the characteristics of thin / thick disk stellar populations and, particularly, those of their MMPs radial distributions.
As stated in Sections 3 and 4, the thin disk begins to form once the galaxy halo reaches its virial equilibrium, becoming, to a first approximation, a quasi-stationary system with almost spherical symmetry at the halo scale, and an axial symmetry at the galaxy scale. We have found that, in this situation, gaseous disks form inside out and chemical evolution proceeds within them, building up element gradients as a consequence of stellar evolution. These gradients show up as the gas Rcyl segregation we see in the second row of Figure 8.
In contrast, the thick disk forms its stars while the galaxy halo is still in its fast assembly phase, when the halo has a time dependent potential. In this period, many fast mass increments occur, carrying with them matter (dark matter, gas and some stars) either diffuse or clumpy, and energy. In this unstable situation, the chemical gradient is built and removed, as we see in the sequence plotted in the top panels of Figure 8. Gradients removal occur not only due to the in-falling gas mixing with the local disk gas, but presumably also helped by an increase in turbulent diffusion caused by the injection of dynamical and stellar feedback energy into the system.
Finally we explore why the Rcyl distributions of stellar disk birth places do not match the current distributions at z=0, either for the thin or the thick disks. To see this, in Figure 6 we compare the first with the second rows on the left (right) panels, for the thin (thick) disks. These differences must be due to stellar radial mixing (blurring, radial migration or scattering777Blurring refers to stellar orbit epicyclic oscillations around a fixed guiding radius. Churning or radial migration implies a change in the guiding center due to an angular momentum change without dynamical heating. Scattering involves an increase of random energy., see e.g. Sellwood & Binney (2002) and Halle et al. (2015)).
Even if the precise distinction of these mechanisms is beyond the scope of this paper, the importance of radial mixing and its correlation with destabilizing dynamical events is not difficult to asses.
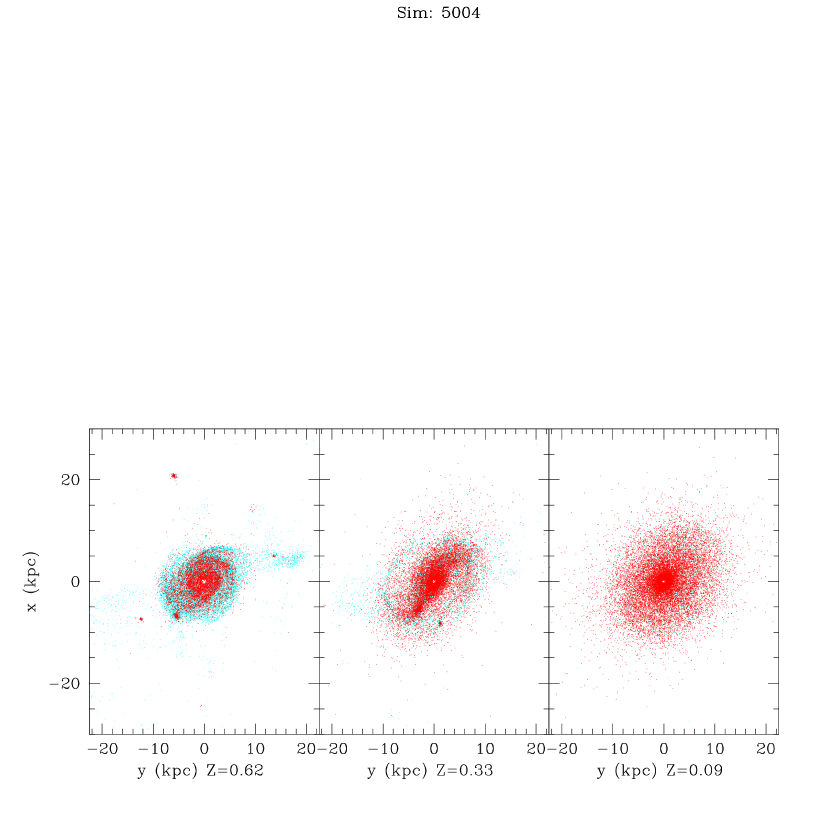
For the thin disk, Figure 6 indicates that the radial mixing decreases from HD-5004A to LD-5101A to g1536-L∗. An analysis of the HD-5004A evolution along the slow phase, shown in Figures 1 and 2, indicates that a burst of star formation occurs around tU 9.5 Gyr. Within the same time interval this galaxy develops a non-axial configuration, that stands out at z=0.33 in Figure 9, where we can also see that the destabilizing agent is a double minor merger. In this way, thin disk stars suffer an important radial migration.
Regarding LD-5101A, no important breaking of axial symmetry appears along the slow phase. Therefore, radial migration and its effects are milder than in the previuos case. The effects of radial migration are even milder in the case of g1536-L∗ galaxy.
The different unstability patterns shown by the three simulated galaxies along their slow phase can be understood in terms of their respective environments. Indeed, while HD-5004A lives in a dense environment, LD-5101A lives in a lower density one. Also, the host halo for the g1536-L∗ has low merging activity at late times.
These correlations strongly suggest that radial mixing in the slow phase is an effect of disk instabilities, caused by dynamical activity which temporarily breaks the axial symmetry of the system. Hence, we can say that the final MMP Rcyl distributions of the thin disk is shaped by disk instabilities. As for the thick disk stars, their formation in a time-varying potential implies a high degree of dynamical scattering, explaining the uniformity of their Rcyl distributions, no matter the MMPs.
9 Summary, Discussion and Conclusions
It this paper we address the issue of the physical processes underlying the origin of the thick disk relative to the thin disk. Recent results on radial distributions of mono-metallicity populations (MMPs, i.e., stars in narrow bins in [Fe/H] within wider [/Fe] ranges) in the Galactic disk by Bovy et al. (2016) had cast doubt on the classical bimodality thin versus thick disk. Our work aims at explaining such MMPs radial distributions in terms of these physical processes. We show that these distributions are straightforward consequences of the two-phase mass assembly scenario for disks.
It is important to note that in this work similar results have been obtained from the analyses of galaxies simulated using two very different codes, placing our results on the level of fundamental physical processes beyond particular code implementations.
9.1 Summary of results
-
1.
Dynamical timescales vs chemical timescales
-
•
We confirm that halos of simulated disk galaxies have their mass assembled through a two-phase process: first a fast one, corresponding to halo collapse, when the mass assembly occurs at high rates, and a later one, with much lower rates, once the halo reaches virial quasi-equilibrium.
-
•
This two-phase halo assembly causes a two-phase baryon assembly at galaxy scales, either in the gas component or in the stellar populations. Seen from the assemblying system, a lot of dynamic activity (in particular frequent major mergers) occurs along the collapsing phase, while it is much less important, or even just continuos accretion in some cases, once the halo virializes.
-
•
Halo virialization defines a (non-observable) time scale, tvir, separating two very different physical conditions for star formation. Before it, the rates of low metallicity gas infall are very high, the gas is expectedly turbulent and the gravitational potential is time-dependent. After it, mass infall is scarce, star formation occurs in a quiet disk (except for minor mergers and non-axisymmetric perturbations), with a close to axial symmetry, and where the gas turbulence is expected to be low.
-
•
A generic two-slope behaviour in the [/Fe]-age correlation at early and late tUs has been found, providing us with an observable, operationally defined chemical timescale, tchem, an observational proxy for tvir. This time, tchem, has been used to classify the stellar populations in thick and thin (born before and after tchem, respectively).
Summing up, confirming previous findings, we have found that halo mass assembly proceeds through two well defined phases. Its imprint on chemical evolution at galactic scales has been used to classify stellar populations of simulated galaxies into either thick or thin disk populations.
-
•
-
2.
A detailed analysis reveals that the properties of these two populations recover observational trends of kinematics with age, [Fe/H] and [/Fe]. Toghether with results from previous analyses by Doménech-Moral et al. (2012) for P-DEVA galaxies, and by Stinson et al. (2013) for g1536-L∗ galaxy, allows us to assert that our simulated disk galaxies do have thin and thick disk stellar populations, when classified using chemical timescales.
- 3.
-
4.
We have found that different MMPs were preferentially born at different locations, characterized by an increasing galactocentric distance as [Fe/H] decreases, the effect being much more important for thin disk stars than for thick disk ones. Different MMPs were also preferentially born within different Universe age () intervals.
-
5.
The gas metallicity structure at a given determines the metallicity distributions of stars born at . The radial structure of MMP gas elements has been found to be segregated in metallicity after tchem (except for periods of important mixing activity, owing to destabilizing events), and rather homogeneous before tchem (due to element abundance mixing with low metallicity infalling gas, as well as to turbulent diffusion).
-
6.
This structure of star birth places for different MMPs (poorly differentiated for the thick disk, segregated for thin disk stars) explains the properties of the radial distribution of stellar MMPs, R, at birthtime. We note the character of the variations of the thin disk Rcyl) scale lengths with metallicity, an effect also found by Bird et al. (2013) for mono-age populations.
-
7.
It has been found that the radial distribution of MMPs at stellar birth time do not match those found at z=0. An analysis of the simulated galaxies along the slow phase indicates that disks can be destabilized, leading to axial symmetry loses that cause radial migration. It is this late activity that drives the importance of radial mixing to determine the final MMP structure in the thin disk.
Regarding thick disks, the formation of their stars in a time-varying potential (fast phase) implies a high degree of dynamical scattering after their formation. Together with the lack of important gas metallicity gradients at their birth times, this explains their Rcyl) uniformity no matter the MMP.
9.2 Discussion
Scenarios to explain the thick versus thin disk differentiation have to explain two different points: i) when, where, under which physical conditions and with which properties did their respective populations form, and ii) how did these populations attain their current (i.e., z=0) properties, in particular their spatial configurations. The results summarized above allow us to infer aspects of the thick disk origin.
Basically two different scenarios exist to explain the thick disk emergence: (see 1 and references therein): those that link it to violent formation processes prior to thin disk formation, from a turbulent gas (see reviews in Gilmore et al., 1989; Brook et al., 2004), and those that assume a preexisting thin disk that is dynamically heated and/or receives external stellar contributions. By linking the two-component disk concept with the two-phase halo mass assembly scenario, our results support the first ones, and in particular results obtained by Brook et al. (2004, 2012b), Stinson et al. (2013), and Bird et al. (2013), from cosmological simulations.
As said in 1, different observational results suggest or are consistent with the previous scenario. We are close to the Haywood et al. (2013), Snaith et al. (2014) and Haywood et al. (2015) proposal, that the thick disk stars have formed at early times out of a turbulent gas, setting the chemical conditions for a latter thin disk formation in a more quiescent situation, as well as to different results from different surveys (see 1).
Taking into account the halo environment, cosmological evolution implies a two-phase mass assembly process because when the cosmological constant becomes dynamically important, a new repulsive force comes into play. This force causes a slowing down of the merger / mass accretion activity at the scale of galaxy halos as Figures 1 and 2 show, (see also, for example Lahav et al., 1991; Lokas & Hoffman, 2001; Salvador-Solé et al., 2005). A tendency towards freezing-out of the Cosmic Web evolution also shows up (Robles et al., 2015) because , the linear density growth factor, becomes constant at large times. From this point of view, a two-phase mass assembly cannot be avoided within the CDM precision cosmology.
According to the two-phase scenario, the fast phase involves the collapse of the region surrounding the halo. Seen from the assemblying system, a lot of merging activity takes place, including stellar satellite accretions. We have found that their stellar debris are incorporated into the host thick disk if the satellite angular momentum is approximatelly parallel to the disk axis (plannar incorporations), and into the spheroid otherwise, as found by Abadi et al. (2003), Meza et al. (2005), Scannapieco et al. (2011) and Tissera et al. (2012), see also Domínguez-Tenreiro et al. (2015).
This two-phase assembly scenario is consistent with a rather continuous variation of some parameters, as we have obtained, for example, for the scale lengths of the MMP surface mass densities in the thin disks. Resuts from other simulations (see, e.g. Bird et al., 2013; Minchev et al., 2017) or observational works (see, for example Bovy et al., 2012a; Kordopatis et al., 2012; Bovy et al., 2016), also emphasize this behaviour. It is worth stressing that it is the distinct physical conditions prevailing at thick and thin stellar populations formation that makes the difference between these two components.
The two-phase scenario answers to the question of the generic different physical conditions under which the stellar populations of the thin and thick disk were born, their ensuing properties, and when and where this occurs. Regarding the question of how did these populations attain their current configurations, the time-dependent potential in the fast phase also explains an early scattering of thick disk stars. Radial migration in the slow phase could have been a key process to match MMP distributions at birthtime to those currently observed in the thin disk.
9.3 Conclusions
The occurrence of two distinct phases in halo mass assembly explains the bimodal behaviour radial MMPs distributions show according to their [Fe] content (a proxy for stellar age). Indeed, while the frequent dynamical violent events occuring at high redshift remove metallicity gradients at early times, and imply efficient stellar mixing once the stars are formed, the relatively quiescent dynamics after the transition keeps [Fe/H] gaseous gradients and prevents newly formed stars to suffer from strong radial mixing.
In conclusion, the MMP radial chartography results, as revealed by APOGEE, do not disprove the two-component disk concept, but they rather reinforce it when analyzed in the wider context of disk formation inside a non-isolated halo embedded in its cosmological neighbourhood. This new scope reveals that it is the unavoidable emergence of the -induced force that is the underlying physical engine driving the two-phase scenario. And that when an age classification is used, the stars of the thick disk have formed under completely different physical conditions than those of the thin disk.
To finish, let us remark that, up to now, no significant separating event for the thick and thin disk formation had been identified yet. Our results indicate that this event is halo virialization, the event marking the transition from the fast to the slow phase of its mass assembly. This is an important result because it provides a time scale which would even allow predictions to be made from pure Dark Matter simulations, as well as semi-analytic models, linking thick disk/thin disk transition to particular time scales.
References
- Abadi et al. (2003) Abadi, M. G., Navarro, J. F., Steinmetz, M., & Eke, V. R. 2003, ApJ, 597, 21
- Adibekyan et al. (2012) Adibekyan, V. Z., Sousa, S. G., Santos, N. C., et al. 2012, A&A, 545, A32
- Agertz et al. (2009) Agertz, O., Teyssier, R., & Moore, B. 2009, MNRAS, 397, L64
- Agertz et al. (2011) —. 2011, MNRAS, 410, 1391
- Allende Prieto et al. (2016) Allende Prieto, C., Kawata, D., & Cropper, M. 2016, A&A, 596, A98
- Assmann et al. (2011) Assmann, P., Fellhauer, M., Kroupa, P., Brüns, R. C., & Smith, R. 2011, MNRAS, 415, 1280
- Bekki & Tsujimoto (2011) Bekki, K., & Tsujimoto, T. 2011, ApJ, 738, 4
- Bensby et al. (2003) Bensby, T., Feltzing, S., & Lundström, I. 2003, A&A, 410, 527
- Bensby et al. (2005) Bensby, T., Feltzing, S., Lundström, I., & Ilyin, I. 2005, A&A, 433, 185
- Bensby et al. (2014) Bensby, T., Feltzing, S., & Oey, M. S. 2014, A&A, 562, A71
- Bird et al. (2013) Bird, J. C., Kazantzidis, S., Weinberg, D. H., & et al. 2013, ApJ, 773, 43
- Boeche et al. (2013) Boeche, C., Chiappini, C., Minchev, I., et al. 2013, A&A, 553, A19
- Boeche et al. (2014) Boeche, C., Siebert, A., Piffl, T., et al. 2014, A&A, 568, A71
- Bournaud et al. (2007) Bournaud, F., Elmegreen, B. G., & Elmegreen, D. M. 2007, ApJ, 670, 237
- Bovy et al. (2012a) Bovy, J., Rix, H.-W., Hogg, D. W., et al. 2012a, ApJ, 755, 115
- Bovy et al. (2012b) Bovy, J., Rix, H.-W., Liu, C., et al. 2012b, ApJ, 753, 148
- Bovy et al. (2012c) —. 2012c, ApJ, 753, 148
- Bovy et al. (2016) Bovy, J., Rix, H.-W., Schlafly, E. F., et al. 2016, ApJ, 823, 30
- Brook et al. (2005) Brook, C. B., Gibson, B. K., Martel, H., & Kawata, D. 2005, ApJ, 630, 298
- Brook et al. (2004) Brook, C. B., Kawata, D., Gibson, B. K., & Freeman, K. C. 2004, ApJ, 612, 894
- Brook et al. (2012a) Brook, C. B., Stinson, G., Gibson, B. K., Wadsley, J., & Quinn, T. 2012a, MNRAS, 424, 1275
- Brook et al. (2012b) Brook, C. B., Stinson, G. S., Gibson, B. K., et al. 2012b, MNRAS, 426, 690
- Buck et al. (2016) Buck, T., Macciò, A. V., Obreja, A., et al. 2016, ArXiv e-prints
- Ceverino et al. (2010) Ceverino, D., Dekel, A., & Bournaud, F. 2010, MNRAS, 404, 2151
- Cheng et al. (2012) Cheng, J. Y., Rockosi, C. M., Morrison, H. L., et al. 2012, ApJ, 746, 149
- Chiba & Beers (2000) Chiba, M., & Beers, T. C. 2000, AJ, 119, 2843
- Comerón et al. (2015) Comerón, S., Salo, H., Janz, J., Laurikainen, E., & Yoachim, P. 2015, A&A, 584, A34
- Comerón et al. (2011) Comerón, S., Elmegreen, B. G., Knapen, J. H., et al. 2011, ApJ, 741, 28
- Cook et al. (2009) Cook, M., Lapi, A., & Granato, G. L. 2009, MNRAS, 397, 534
- Cui et al. (2012) Cui, X.-Q., Zhao, Y.-H., Chu, Y.-Q., et al. 2012, Research in Astronomy and Astrophysics, 12, 1197
- Curir et al. (2014) Curir, A., Serra, A. L., Spagna, A., et al. 2014, ApJ, 784, L24
- Dalcanton & Bernstein (2002) Dalcanton, J. J., & Bernstein, R. A. 2002, AJ, 124, 1328
- Dambis (2009) Dambis, A. K. 2009, MNRAS, 396, 553
- Dhillon et al. (2004) Dhillon, I., Guan, Y., & Kulis, B. 2004, Tech. Rep. TR-04-25, University of Texas at Austin, Department of Computer Sciences
- Doménech-Moral et al. (2012) Doménech-Moral, M., Martínez-Serrano, F. J., Domínguez-Tenreiro, R., & Serna, A. 2012, MNRAS, 2503
- Domínguez-Tenreiro et al. (2011) Domínguez-Tenreiro, R., Oñorbe, J., Martínez-Serrano, F., & Serna, A. 2011, MNRAS, 413, 3022
- Domínguez-Tenreiro et al. (2006) Domínguez-Tenreiro, R., Oñorbe, J., Sáiz, A., Artal, H., & Serna, A. 2006, ApJ, 636, L77
- Domínguez-Tenreiro et al. (2015) Domínguez-Tenreiro, R., Obreja, A., Brook, C. B., et al. 2015, ApJ, 800, L30
- Domínguez-Tenreiro et al. (2014) Domínguez-Tenreiro, R., Obreja, A., Granato, G. L., et al. 2014, MNRAS, 439, 3868
- Feltzing & Chiba (2013) Feltzing, S., & Chiba, M. 2013, New A Rev., 57, 80
- Fouvry et al. (2016a) Fouvry, J.-B., Pichon, C., & Chavanis, P.-H. 2016a, ArXiv e-prints
- Fouvry et al. (2016b) Fouvry, J.-B., Pichon, C., & Monk, L. 2016b, ArXiv e-prints
- Freeman & Bland-Hawthorn (2002) Freeman, K., & Bland-Hawthorn, J. 2002, ARA&A, 40, 487
- Freeman (1987) Freeman, K. C. 1987, ARA&A, 25, 603
- Fuhrmann (1998) Fuhrmann, K. 1998, A&A, 338, 161
- Gaia Collaboration et al. (2016) Gaia Collaboration, Brown, A. G. A., Vallenari, A., et al. 2016, A&A, 595, A2
- Gavilán et al. (2005) Gavilán, M., Buell, J. F., & Mollá, M. 2005, A&A, 432, 861
- Gilmore & Reid (1983) Gilmore, G., & Reid, N. 1983, MNRAS, 202, 1025
- Gilmore et al. (1995) Gilmore, G., Wyse, R. F. G., & Jones, J. B. 1995, AJ, 109, 1095
- Gilmore et al. (1989) Gilmore, G., Wyse, R. F. G., & Kuijken, K. 1989, ARA&A, 27, 555
- Gilmore et al. (2012) Gilmore, G., Randich, S., Asplund, M., et al. 2012, The Messenger, 147, 25
- Griffen et al. (2016) Griffen, B. F., Ji, A. P., Dooley, G. A., et al. 2016, ApJ, 818, 10
- Halle et al. (2015) Halle, A., Di Matteo, P., Haywood, M., & Combes, F. 2015, A&A, 578, A58
- Hayashi & Chiba (2006) Hayashi, H., & Chiba, M. 2006, PASJ, 58, 835
- Hayden et al. (2015) Hayden, M. R., Bovy, J., Holtzman, J. A., et al. 2015, ApJ, 808, 132
- Haywood et al. (2013) Haywood, M., Di Matteo, P., Lehnert, M. D., Katz, D., & Gómez, A. 2013, A&A, 560, A109
- Haywood et al. (2015) Haywood, M., Di Matteo, P., Snaith, O., & Lehnert, M. D. 2015, A&A, 579, A5
- Haywood et al. (2016) Haywood, M., Lehnert, M. D., Di Matteo, P., et al. 2016, A&A, 589, A66
- Ivezić et al. (2012) Ivezić, Ž., Beers, T. C., & Jurić, M. 2012, ARA&A, 50, 251
- Iwamoto et al. (1999) Iwamoto, K., Brachwitz, F., Nomoto, K., et al. 1999, ApJS, 125, 439
- Kazantzidis et al. (2008) Kazantzidis, S., Bullock, J. S., Zentner, A. R., Kravtsov, A. V., & Moustakas, L. A. 2008, ApJ, 688, 254
- Kordopatis et al. (2011) Kordopatis, G., Recio-Blanco, A., de Laverny, P., et al. 2011, A&A, 535, A107
- Kordopatis et al. (2012) Kordopatis, G., Recio-Blanco, A., de Laverny, P., et al. 2012, in Astronomical Society of the Pacific Conference Series, Vol. 458, Galactic Archaeology: Near-Field Cosmology and the Formation of the Milky Way, ed. W. Aoki, M. Ishigaki, T. Suda, T. Tsujimoto, & N. Arimoto, 175
- Kordopatis et al. (2015) Kordopatis, G., Wyse, R. F. G., Gilmore, G., et al. 2015, A&A, 582, A122
- Kroupa (2002) Kroupa, P. 2002, MNRAS, 330, 707
- Kubryk et al. (2013) Kubryk, M., Prantzos, N., & Athanassoula, E. 2013, MNRAS, 436, 1479
- Kubryk et al. (2015) —. 2015, A&A, 580, A126
- Lahav et al. (1991) Lahav, O., Lilje, P. B., Primack, J. R., & Rees, M. J. 1991, MNRAS, 251, 128
- Lee et al. (2011) Lee, Y. S., Beers, T. C., An, D., et al. 2011, ApJ, 738, 187
- Loebman et al. (2011) Loebman, S. R., Roškar, R., Debattista, V. P., et al. 2011, ApJ, 737, 8
- Lokas & Hoffman (2001) Lokas, E. L., & Hoffman, Y. 2001, in Identification of Dark Matter, ed. N. J. C. Spooner & V. Kudryavtsev, 121–126
- Majewski et al. (2015) Majewski, S. R., Schiavon, R. P., Frinchaboy, P. M., Allende Prieto, C., & et al. 2015, ArXiv e-prints
- Martell et al. (2017) Martell, S. L., Sharma, S., Buder, S., et al. 2017, MNRAS, 465, 3203
- Martínez-Serrano et al. (2008) Martínez-Serrano, F. J., Serna, A., Domínguez-Tenreiro, R., & Mollá, M. 2008, MNRAS, 388, 39
- Meza et al. (2005) Meza, A., Navarro, J. F., Abadi, M. G., & Steinmetz, M. 2005, MNRAS, 359, 93
- Mikolaitis et al. (2014) Mikolaitis, Š., Hill, V., Recio-Blanco, A., et al. 2014, A&A, 572, A33
- Minchev (2017) Minchev, I. 2017, ArXiv e-prints
- Minchev et al. (2012) Minchev, I., Famaey, B., Quillen, A. C., & et al. 2012, A&A, 548, A127
- Minchev et al. (2017) Minchev, I., Steinmetz, M., Chiappini, C., et al. 2017, ApJ, 834, 27
- Minchev et al. (2014) Minchev, I., Chiappini, C., Martig, M., et al. 2014, ApJ, 781, L20
- Miranda et al. (2016) Miranda, M. S., Pilkington, K., Gibson, B. K., et al. 2016, A&A, 587, A10
- Moetazedian & Just (2016) Moetazedian, R., & Just, A. 2016, MNRAS, 459, 2905
- Noguchi (1999) Noguchi, M. 1999, ApJ, 514, 77
- Nomoto et al. (1997) Nomoto, K., Hashimoto, M., Tsujimoto, T., et al. 1997, Nuclear Physics A, 616, 79
- Obreja et al. (2014) Obreja, A., Brook, C. B., Stinson, G., et al. 2014, MNRAS, 442, 1794
- Obreja et al. (2013) Obreja, A., Domínguez-Tenreiro, R., Brook, C., et al. 2013, ApJ, 763, 26
- Oser et al. (2010) Oser, L., Ostriker, J. P., Naab, T., Johansson, P. H., & Burkert, A. 2010, ApJ, 725, 2312
- Padmanabhan (1993) Padmanabhan, T. 1993, Structure Formation in the Universe, 499
- Qu et al. (2011) Qu, Y., Di Matteo, P., Lehnert, M. D., & van Driel, W. 2011, A&A, 530, A10
- Quinn et al. (1993) Quinn, P. J., Hernquist, L., & Fullagar, D. P. 1993, ApJ, 403, 74
- Raiteri et al. (1996) Raiteri, C. M., Villata, M., & Navarro, J. F. 1996, A&A, 315, 105
- Ramírez et al. (2013) Ramírez, I., Allende Prieto, C., & Lambert, D. L. 2013, ApJ, 764, 78
- Recio-Blanco et al. (2014) Recio-Blanco, A., de Laverny, P., Kordopatis, G., et al. 2014, A&A, 567, A5
- Reddy et al. (2006) Reddy, B. E., Lambert, D. L., & Allende Prieto, C. 2006, MNRAS, 367, 1329
- Robles et al. (2015) Robles, S., Domínguez-Tenreiro, R., Oñorbe, J., & Martínez-Serrano, F. J. 2015, MNRAS, 451, 486
- Roškar et al. (2008) Roškar, R., Debattista, V. P., Quinn, T. R., Stinson, G. S., & Wadsley, J. 2008, ApJ, 684, L79
- Ruchti et al. (2010) Ruchti, G. R., Fulbright, J. P., Wyse, R. F. G., , & et al. 2010, ApJ, 721, L92
- Ruiz-Lapuente et al. (2000) Ruiz-Lapuente, P., Blinnikov, S., Canal, R., et al. 2000, Mem. Soc. Astron. Italiana, 71, 435
- Ruiz-Lara et al. (2016) Ruiz-Lara, T., Few, C. G., Gibson, B. K., et al. 2016, A&A, 586, A112
- Salvador-Solé et al. (2005) Salvador-Solé, E., Manrique, A., & Solanes, J. M. 2005, MNRAS, 358, 901
- Scalo & Elmegreen (2004) Scalo, J., & Elmegreen, B. G. 2004, ARA&A, 42, 275
- Scannapieco et al. (2011) Scannapieco, C., White, S. D. M., Springel, V., & Tissera, P. B. 2011, MNRAS, 417, 154
- Schönrich & Binney (2009) Schönrich, R., & Binney, J. 2009, MNRAS, 396, 203
- Sellwood & Binney (2002) Sellwood, J. A., & Binney, J. J. 2002, MNRAS, 336, 785
- Snaith et al. (2015) Snaith, O., Haywood, M., Di Matteo, P., et al. 2015, A&A, 578, A87
- Snaith et al. (2014) Snaith, O. N., Haywood, M., Di Matteo, P., et al. 2014, ApJ, 781, L31
- Soubiran et al. (2003) Soubiran, C., Bienaymé, O., & Siebert, A. 2003, A&A, 398, 141
- Steinmetz et al. (2006) Steinmetz, M., Zwitter, T., Siebert, A., et al. 2006, AJ, 132, 1645
- Stinson et al. (2006) Stinson, G., Seth, A., Katz, N., et al. 2006, MNRAS, 373, 1074
- Stinson et al. (2013) Stinson, G. S., Bovy, J., Rix, H.-W., Brook, C., & et al. 2013, MNRAS, 436, 625
- Stinson et al. (2013a) Stinson, G. S., Brook, C., Macciò, A. V., et al. 2013a, MNRAS, 428, 129
- Talbot & Arnett (1973) Talbot, Jr., R. J., & Arnett, W. D. 1973, ApJ, 186, 51
- Timmes et al. (1995) Timmes, F. X., Woosley, S. E., & Weaver, T. A. 1995, ApJS, 98, 617
- Tissera et al. (2012) Tissera, P. B., White, S. D. M., & Scannapieco, C. 2012, MNRAS, 420, 255
- van der Kruit & Freeman (2011) van der Kruit, P. C., & Freeman, K. C. 2011, ARA&A, 49, 301
- van Dokkum et al. (2013) van Dokkum, P. G., Leja, J., Nelson, E. J., et al. 2013, ApJ, 771, L35
- Veltz et al. (2008) Veltz, L., Bienaymé, O., Freeman, K. C., Binney, J., & et al. 2008, A&A, 480, 753
- Vera-Ciro et al. (2014) Vera-Ciro, C., D’Onghia, E., Navarro, J., & Abadi, M. 2014, ApJ, 794, 173
- Villalobos & Helmi (2008) Villalobos, Á., & Helmi, A. 2008, MNRAS, 391, 1806
- Wadsley et al. (2004) Wadsley, J. W., Stadel, J., & Quinn, T. 2004, New A, 9, 137
- Walcher et al. (2015) Walcher, C. J., Coelho, P. R. T., Gallazzi, A., et al. 2015, A&A, 582, A46
- Wechsler et al. (2002) Wechsler, R. H., Bullock, J. S., Primack, J. R., Kravtsov, A. V., & Dekel, A. 2002, ApJ, 568, 52
- Woosley & Weaver (1995) Woosley, S. E., & Weaver, T. A. 1995, ApJS, 101, 181
- Xiang et al. (2015) Xiang, M.-S., Liu, X.-W., Yuan, H.-B., et al. 2015, Research in Astronomy and Astrophysics, 15, 1209
- Yanny et al. (2009) Yanny, B., Rockosi, C., Newberg, H. J., Knapp, G. R., & et al. 2009, AJ, 137, 4377
- Yoachim & Dalcanton (2006) Yoachim, P., & Dalcanton, J. J. 2006, AJ, 131, 226
- Zhao et al. (2003) Zhao, D. H., Mo, H. J., Jing, Y. P., & Börner, G. 2003, MNRAS, 339, 12