Bayesian Analysis of Censored Spatial Data Based on a Non-Gaussian Model

Vahid Tadayon1
Abstract.

In this paper, we suggest using a skew Gaussian-log Gaussian model for the analysis of spatial censored data from a Bayesian point of view. This approach furnishes an extension of the skew log Gaussian model to accommodate to both skewness and heavy tails and also censored data. All of the characteristics mentioned are three pervasive features of spatial data. We utilize data augmentation method and Markov chain Monte Carlo (MCMC) algorithms to do posterior calculations. The methodology is illustrated using simulated data, as well as applying it to a real data set.

Key words and phrases:
Censored Data, Data Augmentation, Non-Gaussian Spatial Models, Outlier, Unified Skew Gaussian
MSC 2010: 62H11, 62F15.
11footnotetext:  Department of Statistics, Eghlid Higher Education Institute, Eghid, Iran.
Email: vahidtadayon24@gmail.com

1. Introduction

The customary approach to spatial data modeling is to accept that the random field of interest is Gaussian. Nevertheless, this assumption always is threatened by the existence of non-Gaussianity features (such as: heavier tails or skewness) in data sets. Moreover, wrong Gaussian assumptions affect the accuracy of spatial predictions and cause bias in the resulting parameter estimates as well. So, the acceptance of the Gaussianity could be overly restrictive to interpret the quantity of interest. Therefore, there is a demand for a more flexible class of sampling models to perform efficient inference and spatial prediction in the resulting models.

For modeling only skewed spatial data without heavy tails, the most commonly adopted strategy is to use the previous model after data transformation (Tadayon and Khaledi, 2015). Even so, an appropriate transformation if there exist, may not easy to obtain (see, e.g., De Oliveira et al., 1997; Tadayon and Rasekh, 2018; Tadayon and Torabi, 2018). Kim and Mallick (2004) developed the skew Gaussian random field based on the skew normal distribution which has been introduced by Azzalini and Capitanio (1999). Zhang and El-Shaarawi (2010) recently introduced a new class of stationary process with skew normal marginal distributions. Using generalized skew Gaussian spatial field is also one of the other strategies which has been suggested by Prates et al. (2012). More details on skew spatial can be found in Rimstad and Omre (2014) and Karimi and Mohammadzadeh (2011).

On the other hand, the observed data may contain some isolated or grouped outliers which have extreme values compared to their neighboring observation values. Since these observations could provide additional information and knowledge about the model, they play an important role in the spatial statistics. Measurement error is the mainspring of encountering outlying observations and belonging to a region with larger observational variance relative to the rest, is another reason. Since the non-Gaussian characteristics of the data may be derived from these observations, in order to identify and treat with these regions, Palacios and Steel (2006) proposed a flexible class of sampling models called Gaussian log-Gaussian (GLG). In this model which contains a scale mixed random variable, is assumed that the mixed variable is log-normally distributed. Therefore, observations with small mixed random variable belong to a region with larger observational variance. In addition, to identify individual outliers, Fonseca and Steel (2011) considered a similar mixing in the nugget effect component. However, this approach is suitable only for symmetric heavier tail distributions and will fail to handle the skewed data (Zareifard and Khaledi, 2013; Tadayon, 2018). An interesting extension, therefore, would be to develop models based on mixtures of skew normal, which would yield a highly flexible and computationally tractable parametric model that could accommodate both multimodality and extreme skewness. This extension which is compatible with Genton and Zhang (2012) remedies, is the unified skew Gaussian-log Gaussian (SUGLG) model introduced by Zareifard and Khaledi (2013). They applied the stochastic approximation expectation-maximization (SAEM) algorithm to maximize the likelihood function.

In addition, on account of some limitations of the data collection mechanism, the complete spatial data are not always available and so the quantity of interest may not be exactly observed in some sampling locations. In such setting, often the exact values can be recorded only if they fall within a specified range, which they have been called “censored data”. One of the conventional approaches to deal with these data is to impute the censored values with “artificial data”, such as, the detection limits. However, this leads biased estimates (see, e.g., Fridley and Dixon, 2007; Tadayon, 2018). Dubrule and Kostov (1986) worked on an interpolation method which motivated by the dual formulation of kriging. They also used geostatistical approaches requiring only the second-order specification of the random field which represent a type of censored data. Utilize likelihood-based approaches for the Gaussian random field is another previous work on the analysis of spatial models in the presence of censored data which well done by Militino and Ugarte (1999). De Oliveira (2005) introduced a Bayesian approach for inference and spatial prediction based on censored data while Fridley and Dixon (2007) incorporate the spatial correlation through an unobserved latent spatial process. Rathbun (2006) applied the Robbins-Monro (1951) stochastic approximation algorithm for estimating the parameters of a spatial regression model with left-censored observations. Eventually, Toscas (2010) proposed a modification on Bayesian approach of De Oliveira (2005) to correct the Bayesian bias in estimation and prediction of spatially correlated left-censored observations.

In all aforementioned works the inference was conducted based on the Gaussianity of the random field. However, in practice, we often observe that the exploratory data analysis shows some version of heavier tails than the normal distribution such as skewness or/and outlier region and consequently, it violates the normality assumption. The application of some transformation is the most commonly adopted strategy. However, the existence of an appropriate transformation is one of the most important problems in this setting and the difficulty in interpretation issues is another. Tadayon and Khaledi (2015) developed and implemented a Markov chain Monte Carlo (MCMC) sampling strategy for inference and fitted the skew Gaussian model based on censored data. In this article, we intend to fit the SUGLG model defined by Zareifard and Khaledi (2013) on a set of spatial data which could take both skewness and heavy tails simoltaneously and also contains some censored data.

In the following section we describe the form of spatial censored data which considered in this article. The third section introduces the mixture model and derives some of its properties. Section 4 considers Bayesian estimation of the model parameters and describes data augmentation method as well as Bayesian prediction. Using simulated data, the identifiability of the parameters, sensitivity analysis and the application of the suggested model is studied in Section 5. Section 6 illustrates the usage of the proposed methodology on a real spatial data set which contain values of precipitation. Conclusions are presented in Section 7.

2. Censored Spatial Data

Let 𝐲=(y1,,yn)𝐲superscriptsubscript𝑦1subscript𝑦𝑛{\bf y}=\left(y_{1},\ldots,y_{n}\right)^{\prime} be a realization of 𝐘=(Y(s1),,Y(sn))𝐘superscript𝑌subscript𝑠1𝑌subscript𝑠𝑛{\bf Y}=\left({Y}\left(s_{1}\right),\ldots,{Y}\left(s_{n}\right)\right)^{\prime}, represents the data measured at the sampling locations s1,s2,,snsubscript𝑠1subscript𝑠2subscript𝑠𝑛s_{1},s_{2},\ldots,s_{n} in R𝑅R, where R𝑅R is the region under study. In what follows, we assume that the mechanism that produced the censoring is uninformative, meaning that the censoring process is independent of the spatial process Y()𝑌Y(\cdot), but may be deterministic or random (De Oliveira, 2005). To argue the credibility of this assumption, consider a case in which the censoring time is independent of the survival time (Militino and Ugarte, 1999). Moreover, notice that this assumption is similar to that of data being missing at random. Thus, the observed data consist of exact observations measured at some sampling locations and interval observations measured in the rest as the result of censoring (Tadayon and Khaledi, 2015). In this manner, to avoid some difficulties, we consider that the data of size n, consist of m𝑚m exact observations and nm𝑛𝑚n-m interval observations. A reasonable methodology to define m𝑚m in practice is related to the nature of the data. Therefore, the data would be denoted by

𝒟={Y(skj)=ykj;jJ}{Y(ski)Ai;iI},𝒟formulae-sequence𝑌subscriptssubscript𝑘𝑗subscript𝑦subscript𝑘𝑗𝑗𝐽formulae-sequence𝑌subscriptssubscript𝑘𝑖subscript𝐴𝑖𝑖𝐼\displaystyle\mathscr{D}=\left\{Y\left({\textbf{s}_{k_{j}}}\right)=y_{k_{j}}~{};~{}j\in J\right\}\cup\left\{Y\left({\textbf{s}_{k_{i}}}\right)\in A_{i}~{};~{}i\in I\right\},

such that {ykj;jJ}subscript𝑦subscript𝑘𝑗𝑗𝐽\left\{y_{k_{j}}~{};j\in J\right\} are the observed values and for any iI𝑖𝐼i\in I, Aisubscript𝐴𝑖A_{i} is the interval where Y(ski)𝑌subscriptssubscript𝑘𝑖Y\left(\textbf{s}_{k_{i}}\right) is known to belong. The censored interval Aisubscript𝐴𝑖A_{i} can depend on the sampling situation and it varies from a location to another location.

3. Statistical Model

Let Y()={Y(s);sR}YY𝑠𝑠𝑅{\rm Y}\left(\cdot\right)=\left\{{{\rm Y}\left({{s}}\right)};s\in R\right\} be the random field of interest where Rd𝑅superscriptsuperscript𝑑R\subseteq\mathbb{R}^{d^{*}} and d1superscript𝑑1{d^{*}}\geq 1. Our starting point is the model

Y(s)=μ(s)+W(s)λ(s)+τρ(s),τ0,\displaystyle{\rm Y}\left(s\right)=\mu\left(s\right)+\frac{{\rm W}\left(s\right)}{\sqrt{\lambda\left(s\right)}}+\tau\rho\left(s\right)\quad,\quad\tau\geq 0, (1)

with the mean surface μ(s)𝜇𝑠\mu\left(s\right) and the scale parameter τ+𝜏superscript\tau\in\mathbb{R}^{+}. μ(s)𝜇𝑠\mu\left(s\right) is assumed to be a linear function of 𝐟(s)superscript𝐟𝑠{\bf f}^{\prime}\left(s\right), suchlike μ(s)=𝐟(s)𝜷𝜇𝑠superscript𝐟𝑠𝜷\mu\left(s\right)={\bf f}^{\prime}\left(s\right)\mbox{\boldmath$\beta$\unboldmath} where, 𝐟(s)superscript𝐟𝑠{\bf f}^{\prime}\left(s\right) is a vector of k𝑘k known functions of the spatial coordinate and 𝜷k𝜷superscript𝑘\mbox{\boldmath$\beta$\unboldmath}\in{\mathbb{R}^{k}} is the regression coefficient vector. The term ρ(s)𝜌𝑠\rho\left(s\right) denotes an uncorrelated Gaussian process with mean 0 and unitary variance, modeling the so-called nugget effect, which allows for measurement error and small-scale variation. This Further, the second-order stationary error process W(s)W𝑠{\rm W}\left(s\right), is a unified skew Gaussian random process corresponding to the model defined by Arellano-Valle and Azzalini (2006). On the other hand, for any vector from this random process like 𝐖=(W(s1),,W(sn))𝐖superscriptWsubscript𝑠1Wsubscript𝑠𝑛{\bf W}=\left({\rm W}\left(s_{1}\right),\ldots,{\rm W}\left(s_{n}\right)\right)^{\prime}, we consider that the distribution of vector 𝐖𝐖\bf W is 𝐖=dα𝐔+σ𝐕𝐖superscript𝑑𝛼𝐔𝜎𝐕{\bf W}{\mathop{=}\limits^{d}}\alpha{\bf U}+\sigma{\bf V} in which, 𝐕𝐕{\bf V} and 𝐔𝐔{\bf U} have n-variate normal distribution Nn(𝟎,Cθw)subscriptN𝑛0subscript𝐶subscript𝜃𝑤{{\rm N}_{n}}\left({\bf 0},{C_{\theta_{w}}}\right) and truncated normal distribution TNn(𝟎;𝟎,Cθw)subscriptTN𝑛00subscript𝐶subscript𝜃𝑤{\rm TN}_{n}\left({\bf 0};{\bf 0},{C_{\theta_{w}}}\right) respectively. The (i,j)𝑖𝑗\left(i,j\right)-th element of the n×n𝑛𝑛n\times n correlation matrix Cθwsubscript𝐶subscript𝜃𝑤{C_{\theta_{w}}} is Cθw(sisj)subscript𝐶subscript𝜃𝑤normsubscript𝑠𝑖subscript𝑠𝑗{C_{\theta_{w}}}\left(\|{s_{i}}-{s_{j}}\|\right). Thus, 𝐖𝐖{\bf W} has multivariate unified skew-normal (SUN) distribution111See Appendix C

𝐖SUNn,n(𝟎,(α2+σ2)Cθw,αCθw,0,Cθw).similar-to𝐖subscriptSUN𝑛𝑛0superscript𝛼2superscript𝜎2subscript𝐶subscript𝜃𝑤𝛼subscript𝐶subscript𝜃𝑤0subscript𝐶subscript𝜃𝑤\displaystyle{\bf W}\sim{{\rm SUN}_{n,n}}\left({\bf 0},\left({\alpha^{2}}+{\sigma^{2}}\right){C_{\theta_{w}}},\alpha{C_{\theta_{w}}},0,{C_{\theta_{w}}}\right).

By setting 𝝆=(ρ(s1),,ρ(sn))𝝆superscript𝜌subscript𝑠1𝜌subscript𝑠𝑛\mbox{\boldmath$\rho$\unboldmath}=\left(\rho\left(s_{1}\right),\ldots,\rho\left(s_{n}\right)\right)^{\prime} and Λ=diag(λ1,,λ1)Λ𝑑𝑖𝑎𝑔subscript𝜆1subscript𝜆1\Lambda=diag\left(\lambda_{1},\ldots,\lambda_{1}\right), equation (1) can be written as

𝐘=dX𝜷+αΛ12𝐔+σΛ12𝐕+τ𝝆.𝐘superscript𝑑X𝜷𝛼superscriptΛ12𝐔𝜎superscriptΛ12𝐕𝜏𝝆\displaystyle{\bf Y}{\mathop{=}\limits^{d}}{\rm X}\mbox{\boldmath$\beta$\unboldmath}+\alpha{\Lambda^{-\frac{1}{2}}}{\bf U}+\sigma{\Lambda^{-\frac{1}{2}}}{\bf V}+\tau\mbox{\boldmath$\rho$\unboldmath}.

In addition, like Palacios and Steel (2006) we assume that lnλ(s)𝜆𝑠\ln{\lambda\left(s\right)} is a Gaussian random field with finite-dimensional distributions:

(ln(λ1),,ln(λn))Nn(ν2J,νCθλ),similar-tosuperscriptsubscript𝜆1subscript𝜆𝑛subscriptN𝑛𝜈2J𝜈subscript𝐶subscript𝜃𝜆\displaystyle{\left({\ln\left({{\lambda_{1}}}\right),\ldots,\ln\left({{\lambda_{n}}}\right)}\right)^{\prime}}\sim{{\rm N}_{n}}{\left(-\frac{\nu}{2}{\rm J},\nu{C_{\theta_{\lambda}}}\right)},

for J=(1,,1)n×1superscriptJsubscript11𝑛1{\rm J}^{\prime}=\left(1,\ldots,1\right)_{n\times 1} and ν>0𝜈0\nu>0, which implies a lognormal distribution for each λisubscript𝜆𝑖\lambda_{i}. Clearly, by tending ν𝜈\nu to 0, λisubscript𝜆𝑖\lambda_{i} tends to 1 and so equation (1) reduces to unified skew Gaussian model. For simplicity, we adopt a same correlation matrices for W and 𝝀𝝀\lambda but with different parameters θwsubscript𝜃𝑤\theta_{w} and θλsubscript𝜃𝜆\theta_{\lambda}, respectively, and also we suppose that both W and 𝝀𝝀\lambda have an isotropic exponential correlation function, separately. However, the first assumption might be somewhat restrictive especially in the case of spatial data without temporal replications (as identifiability problem in these parameters, if exist, can affect the estimates of parameters), but we can hope that this problem is possibly solvable when there are many observations in space. Section 5 confirms this claim. Following Palacios and Steel (2006), we set ω2=τ2σ2superscript𝜔2superscript𝜏2superscript𝜎2{\omega^{2}}=\frac{\tau^{2}}{\sigma^{2}} for simplicity and identifiability.

The model (1) is able to accommodate each of individual outliers and areas of the space with an inflated variance relative to the rest, because of observations with small values λisubscript𝜆𝑖\lambda_{i} fall out of the mean surface.

Let η=(𝜷,α,σ2,ω2,ν,θw,θλ)superscript𝜂𝜷𝛼superscript𝜎2superscript𝜔2𝜈subscript𝜃𝑤subscript𝜃𝜆\eta^{\prime}=\left(\mbox{\boldmath$\beta$\unboldmath},\alpha,{\sigma^{2}},{\omega^{2}},\nu,{\theta_{w}},{\theta_{\lambda}}\right) and 𝐲=(yI,yJ)=(y1,,yn)𝐲subscript𝑦𝐼subscript𝑦𝐽subscript𝑦1subscript𝑦𝑛{\bf y}=\left(y_{I},y_{J}\right)=\left(y_{1},\ldots,y_{n}\right) be a single realization of the considered random field with yi=Y(si)subscript𝑦𝑖Ysubscript𝑠𝑖y_{i}={\rm Y}\left(s_{i}\right), then the conditional joint distribution of 𝐲𝐲\bf y given 𝝀=(λ(s1),,λ(sn))𝝀superscript𝜆subscript𝑠1𝜆subscript𝑠𝑛\mbox{\boldmath$\lambda$\unboldmath}=\left(\lambda\left(s_{1}\right),\ldots,\lambda\left(s_{n}\right)\right)^{\prime} and η𝜂\eta is

p(𝐲|𝝀,η)SUNn,n(X𝜷,Σy,αΛ12Cθw,0,Cθw).similar-to𝑝conditional𝐲𝝀𝜂subscriptSUN𝑛𝑛X𝜷subscriptΣ𝑦𝛼superscriptΛ12subscript𝐶subscript𝜃𝑤0subscript𝐶subscript𝜃𝑤\displaystyle p\left({\bf y}\left|\mbox{\boldmath$\lambda$\unboldmath},\eta\right.\right)\sim{{\rm SUN}_{n,n}}\left({\rm X}\mbox{\boldmath$\beta$\unboldmath},{\Sigma_{y}},\alpha{\Lambda^{-\frac{1}{2}}}{C_{\theta_{w}}},0,{C_{\theta_{w}}}\right).

Furthermore, the likelihood function for η𝜂\eta given 𝒟𝒟\mathscr{D} is

L(η|𝒟)=+nniI𝐿conditional𝜂𝒟subscriptsuperscriptsuperscript𝑛subscriptsuperscript𝑛subscriptsubscriptproduct𝑖𝐼\displaystyle L\left({\eta\left|{\mathscr{D}}\right.}\right)=\int\limits_{{{\mathbb{R}^{+^{n}}}}}{\int\limits_{{\mathbb{R}^{{}^{n}}}}{\int\limits_{{\prod\nolimits_{i\in I}}}}} p(YIiIAi|yJ,𝐰,𝝀,η)𝑝subscriptY𝐼conditionalsubscriptproduct𝑖𝐼subscript𝐴𝑖subscript𝑦𝐽𝐰𝝀𝜂\displaystyle p({{\rm{Y}}_{I}}\in{\leavevmode\resizebox{19.91684pt}{}{$\prod\nolimits_{i\in I}$}}{{A_{i}}}\left|{{y_{J}},{\bf{w}},\mbox{\boldmath$\lambda$\unboldmath},\eta}\right.) (2)
×p(yJ|𝐰,𝝀,η)p(𝐰|𝝀,η)absent𝑝conditionalsubscript𝑦𝐽𝐰𝝀𝜂𝑝conditional𝐰𝝀𝜂\displaystyle\vspace{-1cm}\times p\left({{y_{J}}\left|{{\bf w},\mbox{\boldmath$\lambda$\unboldmath},\eta}\right.}\right)p\left({{\bf w}\left|{\mbox{\boldmath$\lambda$\unboldmath},\eta}\right.}\right)
×p(𝝀|η)dyId𝐰d𝝀,absent𝑝conditional𝝀𝜂𝑑subscript𝑦𝐼𝑑𝐰𝑑𝝀\displaystyle\times p\left({\mbox{\boldmath$\lambda$\unboldmath}\left|\eta\right.}\right)d{y_{I}}d{\bf w}d{\mbox{\boldmath$\lambda$\unboldmath}},

where 𝐰=(w(s1),,w(sn))𝐰superscript𝑤subscript𝑠1𝑤subscript𝑠𝑛{\bf w}=\left(w\left(s_{1}\right),\ldots,w\left(s_{n}\right)\right)^{\prime}, Σy=Σw+τ2𝐈nsubscriptΣ𝑦subscriptΣ𝑤superscript𝜏2subscript𝐈𝑛{\Sigma_{y}}={\Sigma_{w}}+{\tau^{2}}{\rm{\bf I}}_{n} and 𝐈nsubscript𝐈𝑛{\rm{\bf I}}_{n} is the identity matrix of dimension n𝑛n. By setting CJJθw=[Cθw(sJisJj)]m×msubscript𝐶𝐽subscript𝐽subscript𝜃𝑤subscriptdelimited-[]subscript𝐶subscript𝜃𝑤normsubscript𝑠subscript𝐽𝑖subscript𝑠subscript𝐽𝑗𝑚𝑚{C_{{JJ}_{\theta_{w}}}}=\left[{C_{\theta_{w}}}\left(\|{s_{J_{i}}}-{s_{J_{j}}}\|\right)\right]_{m\times m}, we can easily see that

𝐘|J𝝀,ηSUNm,m(XJ𝜷,ΣyJ,αΛJ12CJJθw,0,CJJθw)\displaystyle{{\bf Y}{{}_{J}}}{\left|\mbox{\boldmath$\lambda$\unboldmath},\eta\right.}\sim{{\rm SUN}_{m,m}}\left({X_{J}}\mbox{\boldmath$\beta$\unboldmath},{\Sigma_{y_{J}}},\alpha{{\Lambda_{J}}^{-\frac{1}{2}}}{C_{{JJ}_{\theta_{w}}}},0,{C_{{JJ}_{\theta_{w}}}}\right)

and the conditional distributions of interval observations 𝐘|IyJ,𝝀,η{\bf Y}{{}_{I}}\left|{y_{J}},\mbox{\boldmath$\lambda$\unboldmath},\eta\right. can be written as SUNnm,nmiII{yiAi}subscriptSUN𝑛𝑚𝑛𝑚subscriptproduct𝑖𝐼subscript𝐼subscript𝑦𝑖subscript𝐴𝑖{{\rm SUN}_{n-m,n-m}}{\prod\limits_{i\in I}{{I_{\left\{{{y_{i}}\in{A_{i}}}\right\}}}}} in which its parameters are

μyI|yJ,𝝀,η=XI𝜷+A(yJXJ𝜷),subscript𝜇conditionalsubscript𝑦𝐼subscript𝑦𝐽𝝀𝜂subscript𝑋𝐼𝜷Asubscript𝑦𝐽subscript𝑋𝐽𝜷\displaystyle{\mu}_{y_{I}\left|{y_{J}},\mbox{\boldmath$\lambda$\unboldmath},\eta\right.}=X_{I}\mbox{\boldmath$\beta$\unboldmath}+{\rm A}\left({{y_{J}}}-X_{J}\mbox{\boldmath$\beta$\unboldmath}\right),
ΣyI|yJ,𝝀,η=(σ2+α2)ΛI12CIIθwΛI12+τ2InmA(ΛJ12CJIθwΛI12),subscriptΣconditionalsubscript𝑦𝐼subscript𝑦𝐽𝝀𝜂superscript𝜎2superscript𝛼2superscriptsubscriptΛ𝐼12subscript𝐶𝐼subscript𝐼subscript𝜃𝑤superscriptsubscriptΛ𝐼12superscript𝜏2subscript𝐼𝑛𝑚AsuperscriptsubscriptΛ𝐽12subscript𝐶𝐽subscript𝐼subscript𝜃𝑤superscriptsubscriptΛ𝐼12\displaystyle{\Sigma}_{y_{I}\left|{y_{J}},\mbox{\boldmath$\lambda$\unboldmath},\eta\right.}=\left({\sigma^{2}}+{\alpha^{2}}\right){\Lambda_{I}^{-\frac{1}{2}}}{C_{II_{\theta_{w}}}}{\Lambda_{I}^{-\frac{1}{2}}}+{\tau^{2}}{I_{n-m}}-{\rm A}\left({\Lambda_{J}^{-\frac{1}{2}}}{C_{JI_{\theta_{w}}}}{\Lambda_{I}^{-\frac{1}{2}}}\right),
ΓyI|yJ,𝝀,η=ΛI12CIJθwAΛJ12CJJθw,subscriptΓconditionalsubscript𝑦𝐼subscript𝑦𝐽𝝀𝜂superscriptsubscriptΛ𝐼12subscript𝐶𝐼subscript𝐽subscript𝜃𝑤𝐴superscriptsubscriptΛ𝐽12subscript𝐶𝐽subscript𝐽subscript𝜃𝑤\displaystyle{\Gamma}_{y_{I}\left|{y_{J}},\mbox{\boldmath$\lambda$\unboldmath},\eta\right.}={\Lambda_{I}^{-\frac{1}{2}}}{C_{IJ_{\theta_{w}}}}-A{\Lambda_{J}^{-\frac{1}{2}}}{C_{JJ_{\theta_{w}}}},
ΔyI|yJ,𝝀,η=CJJθwα2CJJθwΛJ12ΣyJ1ΛJ12CJJθw,subscriptΔconditionalsubscript𝑦𝐼subscript𝑦𝐽𝝀𝜂subscript𝐶𝐽subscript𝐽subscript𝜃𝑤superscript𝛼2subscript𝐶𝐽subscript𝐽subscript𝜃𝑤superscriptsubscriptΛ𝐽12superscriptsubscriptΣsubscript𝑦𝐽1superscriptsubscriptΛ𝐽12subscript𝐶𝐽subscript𝐽subscript𝜃𝑤\displaystyle{\Delta}_{y_{I}\left|{y_{J}},\mbox{\boldmath$\lambda$\unboldmath},\eta\right.}={C_{JJ_{\theta_{w}}}}-{\alpha^{2}}{C_{JJ_{\theta_{w}}}}{\Lambda_{J}^{-\frac{1}{2}}}{\Sigma_{y_{J}}^{-1}}{\Lambda_{J}^{-\frac{1}{2}}}{C_{JJ_{\theta_{w}}}},

where

A=(σ2+α2)ΛI12CIJθwΛJ12ΣyJ1,Asuperscript𝜎2superscript𝛼2superscriptsubscriptΛ𝐼12subscript𝐶𝐼subscript𝐽subscript𝜃𝑤superscriptsubscriptΛ𝐽12superscriptsubscriptΣsubscript𝑦𝐽1\displaystyle{\rm A}=\left({\sigma^{2}}+{\alpha^{2}}\right){\Lambda_{I}^{-\frac{1}{2}}}{C_{IJ_{\theta_{w}}}}{\Lambda_{J}^{-\frac{1}{2}}}{\Sigma_{y_{J}}^{-1}},
CIJθw=[Cθw(sIisJj)](nm)×msubscript𝐶𝐼subscript𝐽subscript𝜃𝑤subscriptdelimited-[]subscript𝐶subscript𝜃𝑤normsubscript𝑠subscript𝐼𝑖subscript𝑠subscript𝐽𝑗𝑛𝑚𝑚\displaystyle{C_{IJ_{\theta_{w}}}}=\left[{C_{\theta_{w}}}\left(\|{s_{I_{i}}}-{s_{J_{j}}}\|\right)\right]_{\left(n-m\right)\times m}

and the rest is 00. It is necessary to note that I{A}subscript𝐼AI_{\left\{{\rm A}\right\}} shows the indicator function of the set AA\rm A.

4. Bayesian Inference

To complete the Bayesian model specification, we need to select some prior distributions for all unknown parameters. One can then easily see that a convenient strategy of avoiding improper posterior distribution, is to utilize proper (but diffuse) priors. However, in this case, the insignificance of the prediction sensitivity to the hyperparameters should be established. For convenience but not necessary optimal, we assume elements of the parameter vector η𝜂\eta to be independent a priori, which means that

π(η)=π(𝜷)π(α)π(σ2)π(ω2)π(ν)π(θw)π(θλ).𝜋𝜂𝜋𝜷𝜋𝛼𝜋superscript𝜎2𝜋superscript𝜔2𝜋𝜈𝜋subscript𝜃𝑤𝜋subscript𝜃𝜆\displaystyle\pi\left(\eta\right)=\pi\left(\mbox{\boldmath$\beta$\unboldmath}\right)\pi\left(\alpha\right)\pi\left({\sigma^{2}}\right)\pi\left({\omega^{2}}\right)\pi\left(\nu\right)\pi\left({\theta_{w}}\right)\pi\left({\theta_{\lambda}}\right). (3)

The prior distributions adopted are as follows: 𝜷Nk(0,c0Ik)similar-to𝜷subscriptN𝑘0subscript𝑐0subscriptI𝑘\mbox{\boldmath$\beta$\unboldmath}\sim{{\rm N}_{k}}\left({\textbf{0}},{c_{0}}{{\rm{\textbf{I}}}_{k}}\right), αN(0,c1)similar-to𝛼N0subscript𝑐1\alpha\sim{{\rm N}}\left({0},{c_{1}}\right), σ2Gamma(c2,c3)similar-tosuperscript𝜎2Gammasubscript𝑐2subscript𝑐3{\sigma^{-2}}\sim{\rm Gamma}\left({c_{2}},{c_{3}}\right), ω2GIG(0,c4,c5)similar-tosuperscript𝜔2GIG0subscript𝑐4subscript𝑐5{\omega^{-2}}\sim{\rm GIG}\left(0,{c_{4}},{c_{5}}\right), νGIG(0,c6,c7)similar-to𝜈GIG0subscript𝑐6subscript𝑐7\nu\sim{\rm GIG}\left(0,{c_{6}},{c_{7}}\right), θwExp(c8med(d))similar-tosubscript𝜃𝑤Expsubscript𝑐8𝑚𝑒𝑑𝑑{\theta_{w}}\sim{\rm Exp}\left(\frac{c_{8}}{{med}\left({d}\right)}\right) and θλExp(c9med(d))similar-tosubscript𝜃𝜆Expsubscript𝑐9𝑚𝑒𝑑𝑑{\theta_{\lambda}}\sim{\rm Exp}\left(\frac{c_{9}}{{med}\left({d}\right)}\right), where the hyperparameters c1,,c9subscript𝑐1subscript𝑐9{c_{1}},\ldots,{c_{9}} are chosen to reflect vague prior information and med(d)𝑚𝑒𝑑𝑑{{med}\left({d}\right)} is the median of all distance between the data locations. Moreover, the closed form of generalized inverse-Gaussian (GIG) distribution and some justification for utilizing the above priors can be found in Palacios and Steel (2006).

Now, we try to derive the posterior distribution of the parameters by combining the likelihood function (2) and the prior distribution (3). Since a direct Bayesian analysis of the model is computationally impractical because of multiple integrals in posterior distribution, we adopt the data augmentation method and use the latent variables U and 𝝀𝝀\lambda to produce some samples {(yI(i),u(i),λ(i),η(i))}i=1lsuperscriptsubscriptsuperscriptsubscript𝑦𝐼𝑖superscript𝑢𝑖superscript𝜆𝑖superscript𝜂𝑖𝑖1𝑙\{({y_{I}^{\left(i\right)}},{{u}^{\left(i\right)}},{\lambda^{\left(i\right)}},{\eta^{\left(i\right)}})\}_{i=1}^{l} from the extended model p(yI,𝐔,𝝀,η,|𝒟)p\left({y_{I}},{\bf U},{\mbox{\boldmath$\lambda$\unboldmath}},\eta,{\left|\mathscr{D}\right.}\right) via MCMC methods. Details are given in Appendix A.

It must be noted that in many applications, the prediction of values at unsampled locations is a usual task of interest. The spatial prediction of the response in an unobserved location y0subscript𝑦0y_{0} would be based on the Bayesian predictive distribution:

p(y0|𝐲)=iIAiR+nR+pp(y0|𝐲,𝝍,𝝍0)p(𝝍0|𝐲,𝝍)p(𝝍|𝐲)𝑑𝝍0𝑑𝝍𝑑yI,𝑝conditionalsubscript𝑦0𝐲subscriptsubscriptproduct𝑖𝐼subscript𝐴𝑖subscriptsuperscriptsubscript𝑅𝑛subscriptsuperscriptsubscript𝑅𝑝𝑝conditionalsubscript𝑦0𝐲𝝍subscript𝝍0𝑝conditionalsubscript𝝍0𝐲𝝍𝑝conditional𝝍𝐲differential-dsubscript𝝍0differential-d𝝍differential-dsubscript𝑦𝐼\displaystyle p\left({y_{0}}\left|{\bf y}\right.\right)=\int_{\prod\nolimits_{i\in I}{{A_{i}}}}{\int_{R_{+}^{n}}{\int_{R_{+}^{p}}{p\left({{y_{0}}\left|{{\bf y},\mbox{\boldmath$\psi$\unboldmath},{\mbox{\boldmath$\psi$\unboldmath}_{0}}}\right.}\right)}}}p\left({{\mbox{\boldmath$\psi$\unboldmath}_{0}}\left|{{\bf y},\mbox{\boldmath$\psi$\unboldmath}}\right.}\right)p\left({\mbox{\boldmath$\psi$\unboldmath}\left|{\bf y}\right.}\right)d{\mbox{\boldmath$\psi$\unboldmath}_{0}}d\mbox{\boldmath$\psi$\unboldmath}d{y_{I}},

where 𝝍(s)=ln𝝀(s)𝝍𝑠𝝀𝑠{\mbox{\boldmath$\psi$\unboldmath}}\left(s\right)=\ln\mbox{\boldmath$\lambda$\unboldmath}\left(s\right). Evidently, the full predictive distribution can not be evaluated in closed form but can be approximated using Monte Carlo samples.

5. Simulation Studies

The main aim of this section is to assess the performance of the proposed methodology on detecting two levels of censoring and also represent prediction values at some new unobserved locations. But since the SUGLG model may have a problem to indentify the correlation parameters (see Section 3), so, we first use simulation to evaluate the identifiability of these parameters. Then we present a banal method to revalue the ability of the this model to correctly identify outlying observations as well. Throughout, results are based on every 100th draw from an MCMC chain of length 150,000 with a burn-in of 100,000 which provides enough output for convergence. The spatial sampling points were considered on coordinates of the data file 97data.dat available from GSLIB software (Deutsch and Journel, 1998) in which, 97 locations are taken on a pseudo-regular grid over a bidimensional region 50 by 50 miles.

First of all, we appoint a lattice locations

{12,21,28,40}×{10,20,30,40},1221284010203040\displaystyle\left\{{12,21,28,40}\right\}\times\left\{{10,20,30,40}\right\}, (4)

as a hold-out data set to evaluate the performance of the model in spatial prediction and then data are generated on these 113 locations based on the sampling model
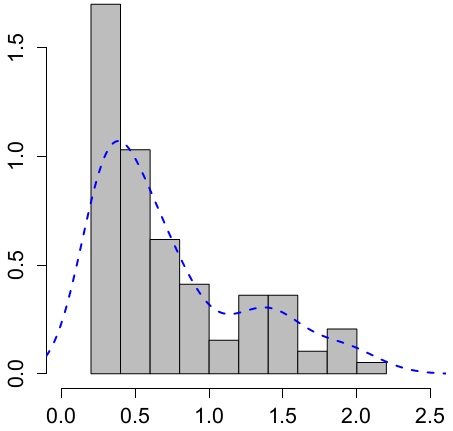
𝐘=β0+α𝐔+σ𝐕+τρ,𝐘subscript𝛽0𝛼𝐔𝜎𝐕𝜏𝜌\displaystyle{\bf Y}={\beta_{0}}+\alpha{\bf U}+\sigma{\bf V}+\tau\rho,

with a constant mean surface β0=0subscript𝛽00\beta_{0}=0, α=3,σ=1,τ=0.1formulae-sequence𝛼3formulae-sequence𝜎1𝜏0.1\alpha=3,\sigma=1,\tau=0.1 and θλ=θw=0.5subscript𝜃𝜆subscript𝜃𝑤0.5{\theta_{\lambda}}={\theta_{w}}=0.5. After that, a cluster of outliers at locations 29, 37, 59, 78 and 84 has been created by imposing two units to the simulated values. Then, by leaving the simulated value in the lattice locations (4), the model will be fitted on the rest (of size 97). For model validation, we now implement two levels of left-censored design, one 17.5%percent\% and other 67%percent\% as a balanced and extreme cases of censoring respectively, such that in the first of them, the 17th ordered observation will be substituted for 1st up to 17th smallest values and in the second, 1st up to 65th smallest observations will be replaced with 65th ordered observation. Fig. 1 shows a schematic description of the region that displays the sampling locations as well as the region with inflated variance and censored locations. As an exploratory analysis, Fig. 2 which shows the histogram with the nonparametric density estimator of generated data, confirm the existence of an outlier region in these data as well as skewness.

Refer to caption
Figure 1. Study region based on balanced case (on the left) and extreme case (on the right) of censoring.
                                                                                                                                                                    \circ 
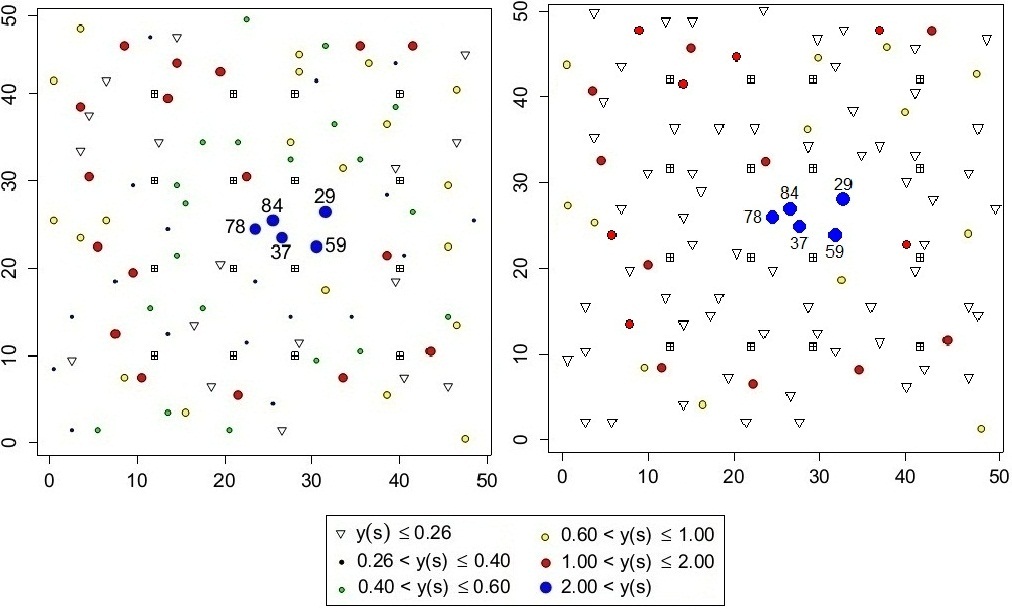
= exact observation.
                                                                                                                                                                    \bigtriangledown = left-censored observation.
                                                                                                                                                                    \boxplus = location which is added to spatial prediction.
Refer to caption
Figure 2. Histogram with the nonparametric density estimator of the generated data.

Since the inference may be challenging in identifying the correlation parameters θwsubscript𝜃𝑤\theta_{w} and θλsubscript𝜃𝜆\theta_{\lambda}, here, we focus on this problem to see what extent information about these parameters can be recovered from data. This study will be done just based on the balanced case of censoring because we do not expect a high ability to identify the parameters in the extreme case. To check the aforementioned problem, three data sets were generated with θw=0.25,1,1.5subscript𝜃𝑤0.2511.5\theta_{w}=0.25,1,1.5 and θλ=0.1,0.7,1.1subscript𝜃𝜆0.10.71.1\theta_{\lambda}=0.1,0.7,1.1 (in which, the other values have been fixed) and the estimate of the model parameters are obtained. However there are quite moderate sample size, the results which are reported in Table 1, indicates that there is no significant problem on the identifying of the correlation parameters and so the data almost allow for acceptable inference on these parameters.

At the moment, we concentrate on the performance of the Bayesian estimation, in which we must do one of these actions: choose some benchmark values for the various hyperparameters used in the priors, using empirical Bayes or employing hierarchical Bayes. To facilitate the computations, we consider the first method. But, we must investigatethe robustness of the posterior results under changes in the prior hyperparameters. It must be noted that we do not expect stability of the posteriors per se, but rather our interest is often in prediction. For this purpose, we employ the relative change criterion, which is the absolute value of the induced change in the marginal posterior mean of each parameter divided by the standard deviation computed under the benchmark prior. Table 2 which lists the alternative prior hyperparameters as well as the maximum relative change recorded for each parameter, shows no significant changes.

Table 1. Identifiability of the correlation parameters based on the balanced case of censoring.
θwsubscript𝜃𝑤\theta_{w} True value 0.2 1 1.5
Estimated value 0.98 1.15 1.41
θλsubscript𝜃𝜆\theta_{\lambda} True value 0.1 0.7 1.1
Estimated value 0.14 0.81 0.98
Table 2. Prior Sensitivity Analysis: Setup of the Experiment and Maximum Relative Change (MRC).
MRC
Hyperparameter Benchmark Alternative values 17.5%percent17.517.5\% 67%percent6767\%
β0subscript𝛽0{\beta_{0}} c0subscript𝑐0c_{0} 104superscript10410^{4} 102superscript102{10^{2}} , 106superscript106{10^{6}} 0.0611 0.0926
α𝛼\alpha c1subscript𝑐1c_{1} 105superscript10510^{5} 103superscript103{10^{3}} , 107superscript107{10^{7}} 0.132 0.1915
σ2superscript𝜎2{\sigma^{2}} (c2,c3)subscript𝑐2subscript𝑐3\left({c_{2}},{c_{3}}\right) (106,106)superscript106superscript106\left({10^{-6}},{10^{-6}}\right) (104,108)superscript104superscript108\left({10^{-4}},{10^{-8}}\right),(108,104)superscript108superscript104\left({10^{-8}},{10^{-4}}\right) 0.1709 0.1135
ω2superscript𝜔2{\omega^{2}} (c4,c5)subscript𝑐4subscript𝑐5\left({c_{4}},{c_{5}}\right) (0.1,9)0.19\left(0.1,9\right) (0.7,1.5)0.71.5\left(0.7,1.5\right) , (0.5,0.7)0.50.7\left(0.5,0.7\right) 0.3147 0.652
θwsubscript𝜃𝑤\theta_{w} c8subscript𝑐8c_{8} 0.70.70.7 0.40.40.4 , 1.41.41.4 0.393 0.4117
θλsubscript𝜃𝜆\theta_{\lambda} c9subscript𝑐9c_{9} 0.70.70.7 0.350.350.35 , 1.601.601.60 0.421 0.4705
ν𝜈\nu (c6,c7)subscript𝑐6subscript𝑐7\left({c_{6}},{c_{7}}\right) (0.5,1.5)0.51.5\left(0.5,1.5\right) (0.30,1.0)0.301.0\left(0.30,1.0\right) , (0.75,0.8)0.750.8\left(0.75,0.8\right) 0.8003 0.96

Therefore, the sensitivity of posterior can be partitioned into three groups: First, the prior on (β0,α,σ2)subscript𝛽0𝛼superscript𝜎2\left({\beta_{0}},\alpha,{\sigma^{2}}\right) which does not play a vital role, (ω2,θw,θλ)superscript𝜔2subscript𝜃𝑤subscript𝜃𝜆\left({\omega^{2}},{\theta_{w}},{\theta_{\lambda}}\right) where the data is reasonably informative on these parameters as the second and the last is ν𝜈\nu by the largest influence of prior changes. Since there is relatively little direct information in the data on ν𝜈\nu, choice of prior is quite important. However, the adoption of hierarchical or empirical Bayes can be helpful.

Table 3 summarizes the results of fitting four models:

  • Gaussian (GAUS): Y(s)=β0+τρ(s)Y𝑠subscript𝛽0𝜏𝜌𝑠{\rm Y}\left(s\right)={\beta_{0}}+\tau\rho\left(s\right),

  • Unified Skew Gaussian (SUG): Y(s)=β0+W(s)+τρ(s)Y𝑠subscript𝛽0W𝑠𝜏𝜌𝑠{\rm Y}\left(s\right)={\beta_{0}}+{\rm W}\left(s\right)+\tau\rho\left(s\right),

  • Gaussian-Log Gaussian (GLG): Y(s)=β0+λ(s)12+τρ(s)Y𝑠subscript𝛽0𝜆superscript𝑠12𝜏𝜌𝑠{\rm Y}\left(s\right)={\beta_{0}}+{{\lambda\left(s\right)}}^{-\frac{1}{2}}+\tau\rho\left(s\right),

  • Unified Skew Gaussian-Log Gaussian (SUGLG):

    Y(s)=β0+W(s)λ(s)+τρ(s).Y𝑠subscript𝛽0W𝑠𝜆𝑠𝜏𝜌𝑠\displaystyle{\rm Y}\left(s\right)={\beta_{0}}+\frac{{\rm W}\left(s\right)}{\sqrt{\lambda\left(s\right)}}+\tau\rho\left(s\right).

According to this table, it is found that the SUGLG model has a better performance. Moreover, to compare four models in prediction, we compute the root of mean-square error of the predicted response values on the determined lattice locations. Table 4 suggets the desirability of using the SUGLG model.

Table 3. The estimation of the parameters in four models: GAUS, SUG, GLG and SUGLG.
β0subscript𝛽0{\beta_{0}} α𝛼\alpha σ2superscript𝜎2{\sigma^{2}} ω2superscript𝜔2{\omega^{2}} θwsubscript𝜃𝑤\theta_{w} θλsubscript𝜃𝜆\theta_{\lambda} ν𝜈\nu
True value 0 3 1 0.1 0.5 0.5 1
Estimated values GAUS 17.5%percent17.517.5\% 1.67 - 2.17 0.9 0.38 0.15 -
67%percent6767\% 2.03 - 1.86 0.91 0.46 0.4 -
SUG 17.5%percent17.517.5\% 1.21 2.03 1.68 0.83 0.45 0.12 -
67%percent6767\% 1.42 1.35 1.4 0.71 0.58 0.39 -
GLG 17.5%percent17.517.5\% 0.98 - 1.74 0.66 0.22 0.34 0.51
67%percent6767\% 1.5 - 1.38 0.59 0.55 0.59 1.23
SUGLG 17.5%percent17.517.5\% 0.05 2.77 1.33 0.2 0.56 0.45 1.12
67%percent6767\% 0.8 2.13 1.15 0.23 0.46 0.53 0.92
Table 4. The root of mean square error (RMSE) of the predicted response values based on GAUS, SUG, GLG and SUGLG models.
GAUS SUG GLG SUGLG
RMSE 17.5%percent17.517.5\% 0.191 0.083 0.095 0.031
67%percent6767\% 0.211 0.187 0.166 0.102

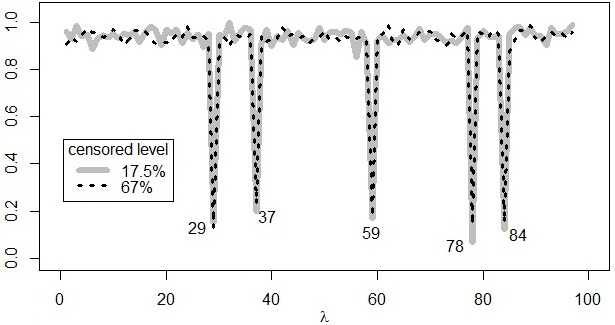
Finally, by plotting the Bayesian estimate of λisubscript𝜆𝑖\lambda_{i}’s for i=1,,n𝑖1𝑛i=1,\ldots,n, it can be seen that how posterior values of λisubscript𝜆𝑖\lambda_{i}’s might be used to identify outliers (because of the effect of small values of λisubscript𝜆𝑖\lambda_{i}’s in the denominator, see equation (1)). Fig. 3 which shows mean of the posterior values λisubscript𝜆𝑖\lambda_{i}’s for i=1,,97𝑖197i=1,\ldots,97, confirms the existence of an outlier region in the clustered locations 29, 37, 59, 78 and 84.

Refer to caption
Figure 3. Mean of the posterior values λisubscript𝜆𝑖\lambda_{i}’s for i=1,,97𝑖197i=1,\ldots,97. Small values of λisubscript𝜆𝑖\lambda_{i}’s lead to large prediction in response.

6. Rainfall Data Analysis

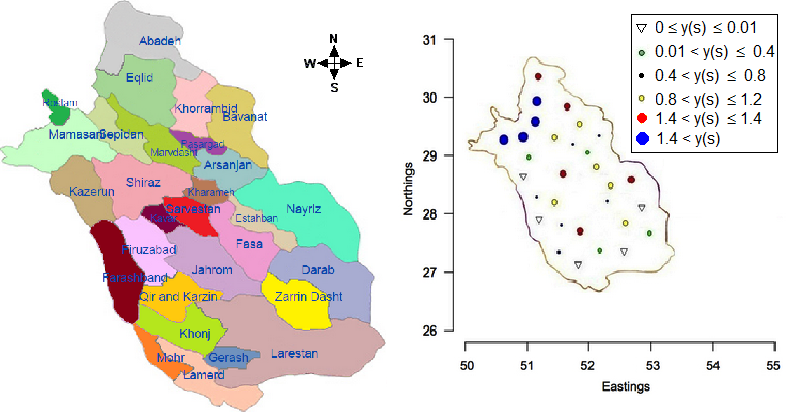
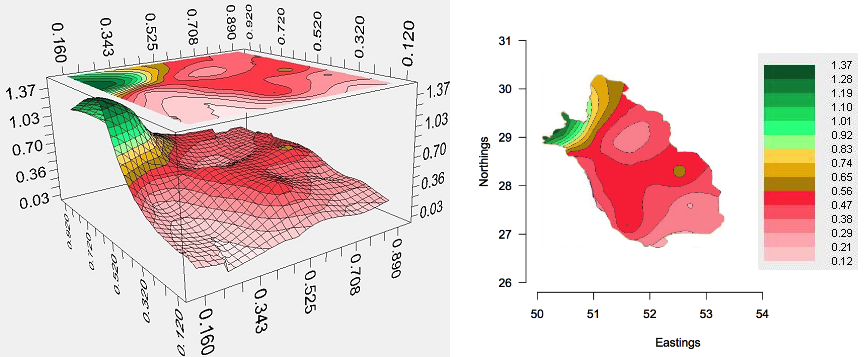
The analyzed data set is comprised of rainfall amounts, measured in inch and accumulated on the first and coldest Wednesday in December 2012 at 30 stations located in Fars province of Iran. A schematic description of the region, the stations and rainfall amounts is shown in Fig. 4. In this figure it can be seen that there is a region with larger observation relative to the rest, along the north-eastern of the study region. In this data set (which are presented in Appendix B), the zero values are reported for five stations. Nevertheless, since the nonzero values are reported for the countrysides of these stations by residents and the stations operators, we consider their values as censored with censored intervals [0,0.01)00.01\left[0,0.01\right), where the value 0.01 is the least value of precipitation in their countrysides. These locations are indicated by ”\bigtriangledown” as a left-censored observations in Fig. 4.

Refer to caption
Figure 4. Position of the 30 stations and their respective rainfall amounts.

First of all, we performed the exploratory data analysis (EDA) such as the histogram, Q-Q plot, the Shapiro-Wilk’s test, the empirical semivariogram and the Haining (1991) method to detect outlier observations. Some of those results are presented in Fig. 5.

Refer to caption
(a)
Refer to caption
(b)
Refer to caption
(c)
Refer to caption
(d)
Figure 5. Exploratory data analysis (EDA) of rainfall dataset: (a) Histogram with the nonparametric density estimator of generated data, (b) Q-Q plot, (c) Empirical Semivariogram, (d) The Haining limitations.

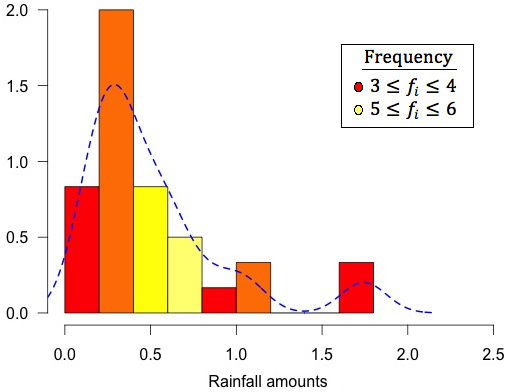
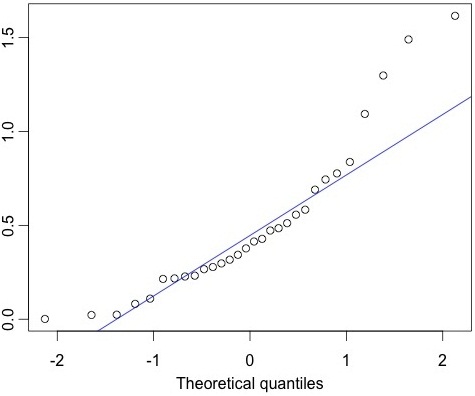
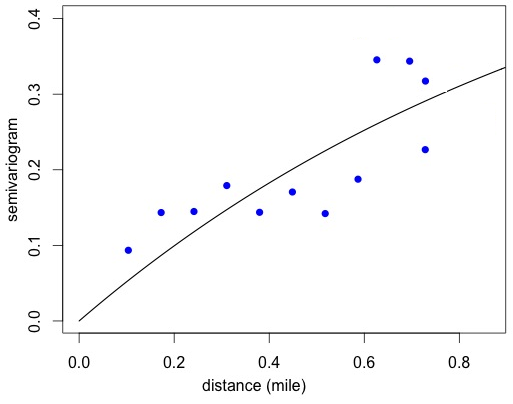
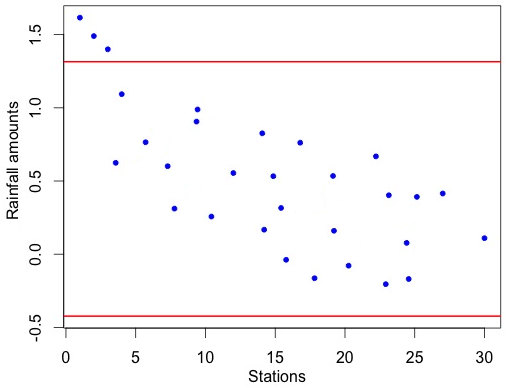
The histogram and Q-Q plot suggest that the data set has moderately right-skewed distribution which was confirmed by using the Shapiro-Wilk test where reported in Table 5. In addition, comparing the Haining bounds and the response values, indicate a region in the northings of studying space with larger observational variance relative to the rest, where we observed large amounts of precipitation. Finally, it is clear from the empirical semivariograms that there exists a strong spatial correlation as well as a nugget effect in the data set.

Table 5. Shapiro-Wilk’s normality test.
Shapiro-Wilk P-value
0.87650.87650.8765 0.0023430.0023430.002343

Before starting to compute estimations and spatial predictions, we mention that, since explanatory analysis of the data did not show any significant relation between response value and the spatial locations, the mean function is assumed to be constant, so we have just β0subscript𝛽0\beta_{0} and thus k=1𝑘1k=1. This exploratory data analysis suggests that SUGLG model is a suitable option for doing the analysis. To perform Bayesian inference, benchmark values of the hyperparameter have chosen same as the given values in Table 2. The results is represented in Table 6. Although the DIC and the LMPL (=i=1nlog(CPOi)absentsuperscriptsubscript𝑖1𝑛𝐶𝑃subscript𝑂𝑖=\sum\nolimits_{i=1}^{n}{\log\left({CP{O_{i}}}\right)})222The conditional predictive ordinate (CPO): The CPO model comparison is a Bayesian cross-validation approach (e.g., Geisser, 1993) criterion present a versus results in comparison between two SUG and GLG models in some situations, but both of them confirm the better performance of the SUGLG model.

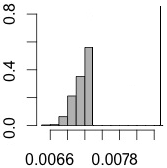
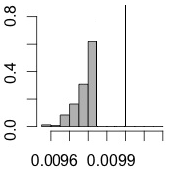
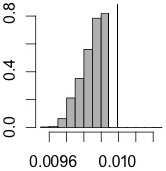
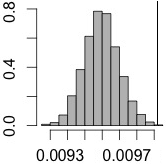
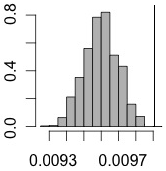
Morover, the prediction of rainfall amounts in the five mentioned stations, is presented in Table 7. One of the attractive feature of the Bayesian approach of course, is that it allows to make inference about the censored values, and in particular to quantify uncertainty about them. Fig. 6 displays the histograms of the posterior samples of the censored values, where vertical lines are placed at their respective censoring limits. It is clear that for some of these locations there is a lot of uncertainty about the true value, while for others the respective censoring limit is a poor estimate of the true value.

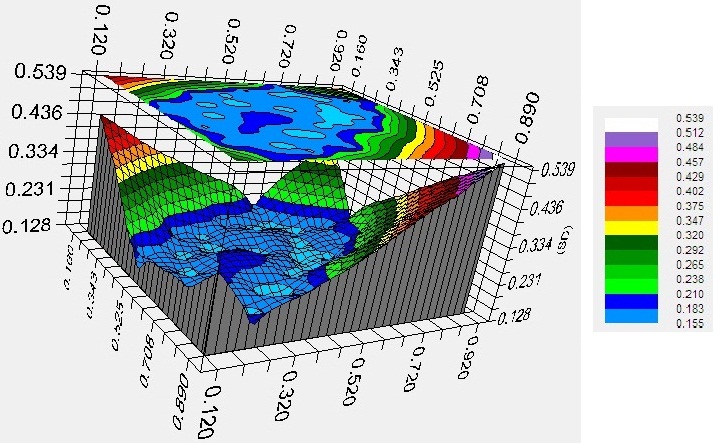
Finally, the contour map corresponding to the predictive mean surface under the SUGLG case, is shown in Fig. 7 which are computed from the predictive distribution over a regular grid of 20×20202020\times 20. According to this figure, the predictions are highest in the area of inflated variance that contains the aforementioned observations. Fig. 8 presents the standard deviation surfaces for the SUGLG case as well.

Table 6. Estimation (Est) and Standard deviation (SD) of the parameters in four models: GAUS, SUG, GLG and SUGLG with the DIC and the LPML criterion to comparison these models.
β0subscript𝛽0{\beta_{0}} α𝛼\alpha σ2superscript𝜎2{\sigma^{2}} ω2superscript𝜔2{\omega^{2}} θwsubscript𝜃𝑤\theta_{w} θλsubscript𝜃𝜆\theta_{\lambda} ν𝜈\nu DIC LPML
GAUS Est 0.006 - 2.13 0.291 0.036 0.521 - 57.3 19.4
SD 1.71 - 1.03 0.84 2.17 1.97 -
SUG Est 0.043 2.76 1.98 0.284 0.251 0.56 - 40.7 31.1
SD 1.65 1.19 1.11 0.761 2.061 2.01 -
GLG Est 0.044 - 1.9 0.276 0.232 0.473 0.32 39.6 30
SD 1.13 - 1.86 0.874 1.81 1.68 0.24
SUGLG Est 0.011 2.22 1.4 0.197 0.461 0.465 2.61 11.4 43.7
SD 0.33 0.95 0.41 0.29 0.925 0.71 0.13
Table 7. Bayesian spatial prediction of rainfall values in five stations.
Observed value Predicted value
Darab 0 0.0070121
Firuzabad 0 0.009761
Lamerd 0 0.0099013
Larestan 0 0.0095678
Qir-o-Karzin 0 0.0095411

7. Conclusions

In this article we have considered a unified skew Gaussian-log Gaussian model to analyze of non-Gaussian random fields based on censored data. Overall, the Bayesian framework, data augmentation method and MCMC algorithms have been extended for parameter estimation. However, using this algorithm entail more complication in the computations, recently, some studies have been performed to find replacing framework and it has led to some new methods such as Variational Bayes’ method (Ren et al. 2011). Although this method requires more complex theoretic calculations, it could increase the speed of calculations. So, assessing the performance of this method in Bayesian inference of Non-Gaussian random fields in the presence of censored values is an interesting area to investigate in further research.

Refer to caption
(a)
Refer to caption
(b)
Refer to caption
(c)
Refer to caption
(d)
Refer to caption
(e)
Figure 6. Estimates of the posterior distribution of Y(si)Ysubscript𝑠𝑖{\rm Y}\left({s_{i}}\right) for five censored observations. Vertical lines are placed at the respective censoring limits. (a) to (e) correspond to Darab, Firuzabad, Lamerd, Larestan and Qir-o-Karzin, respectively.
Refer to caption
Figure 7. The contour map corresponding to the predictive mean for rainfall dataset.
Refer to caption
Figure 8. Topographic data: standard deviation surface of predictive mean.

Appendix A: The Full Conditional Distributions

In sequel, we try to present the full conditional distributions of all unknown quantities p(yI,𝐔,𝝀,η,|𝒟)p\left({y_{I}},{\bf U},{\mbox{\boldmath$\lambda$\unboldmath}},\eta,{\left|\mathscr{D}\right.}\right) in the Gibbs sampler framework. Moreover, to facilitate the computations we put the notation ηϕsubscript𝜂italic-ϕ{\eta_{-\phi}} to show the vector η𝜂\eta without the element ϕitalic-ϕ\phi and set Z=𝐲X𝜷𝑍𝐲𝑋𝜷Z={\bf y}-X\mbox{\boldmath$\beta$\unboldmath}.

  • \bullet

    Full conditional distribution of censored values
    By considering the partition of 𝐮=(uI,uJ)𝐮subscript𝑢𝐼subscript𝑢𝐽{\bf u}=\left(u_{I},u_{J}\right) we have

    𝐘|I𝐮,v,𝝀,η,𝒟Nnm(μ,Σ)iII{yiAi},\displaystyle{\bf Y}{{}_{I}}\left|{\bf u},{v},\mbox{\boldmath$\lambda$\unboldmath},\eta,\mathscr{D}\right.\sim{{\rm N}_{n-m}}\left({\mu^{*}},{\Sigma^{*}}\right){\prod\limits_{i\in I}{{I_{\left\{{{y_{i}}\in{A_{i}}}\right\}}}}},

    where,

    μsuperscript𝜇\displaystyle{\mu^{*}} =\displaystyle= XI𝜷+αΛI12uI+ΣyIyJΣyJyJ1(yJXJ𝜷αΛJ12uJ),subscript𝑋𝐼𝜷𝛼superscriptsubscriptΛ𝐼12subscript𝑢𝐼subscriptΣsubscript𝑦𝐼subscript𝑦𝐽superscriptsubscriptΣsubscript𝑦𝐽subscript𝑦𝐽1subscript𝑦𝐽subscript𝑋𝐽𝜷𝛼superscriptsubscriptΛ𝐽12subscript𝑢𝐽\displaystyle{X_{I}}\mbox{\boldmath$\beta$\unboldmath}+\alpha{\Lambda_{I}^{-\frac{1}{2}}}{{u}_{I}}+{\Sigma_{{y_{I}}{y_{J}}}}{\Sigma_{{y_{J}}{y_{J}}}^{-1}}\left({y_{J}}-{X_{J}}\mbox{\boldmath$\beta$\unboldmath}-\alpha{\Lambda_{J}^{-\frac{1}{2}}}{u_{J}}\right),
    ΣsuperscriptΣ\displaystyle{\Sigma^{*}} =\displaystyle= ΣyIyIΣyIyJΣyJyJ1ΣyJyI.subscriptΣsubscript𝑦𝐼subscript𝑦𝐼subscriptΣsubscript𝑦𝐼subscript𝑦𝐽superscriptsubscriptΣsubscript𝑦𝐽subscript𝑦𝐽1subscriptΣsubscript𝑦𝐽subscript𝑦𝐼\displaystyle{\Sigma_{{y_{I}}{y_{I}}}}-{\Sigma_{{y_{I}}{y_{J}}}}{\Sigma_{{y_{J}}{y_{J}}}^{-1}}{\Sigma_{{y_{J}}{y_{I}}}}.

    which is a (nm)𝑛𝑚(n-m)-variate truncated normal distribution and so it can easily generated by standard algorithm.

  • \bullet

    Full conditional distribution of latent variable 𝐔𝐔{\bf U}

    p(𝐔|𝐲,𝝀,η)𝑝conditional𝐔𝐲𝝀𝜂\displaystyle p\left({{\bf U}\left|{{\bf y},\mbox{\boldmath$\lambda$\unboldmath},\eta}\right.}\right) proportional-to\displaystyle\propto p(𝐲|𝐮,𝝀,η)p(𝐔|𝝀,η)π(𝝀|η)𝑝conditional𝐲𝐮𝝀𝜂𝑝conditional𝐔𝝀𝜂𝜋conditional𝝀𝜂\displaystyle p\left({{\bf y}\left|{{\bf u},\mbox{\boldmath$\lambda$\unboldmath},\eta}\right.}\right)p\left({{\bf U}\left|{\mbox{\boldmath$\lambda$\unboldmath},\eta}\right.}\right)\pi\left({\mbox{\boldmath$\lambda$\unboldmath}\left|\eta\right.}\right)
    proportional-to\displaystyle\propto exp{12(ZαΛ12𝐔)Σy1(ZαΛ12𝐔)}12superscript𝑍𝛼superscriptΛ12𝐔superscriptsubscriptΣ𝑦1𝑍𝛼superscriptΛ12𝐔\displaystyle\exp\left\{{-\frac{1}{2}{{\left({Z-\alpha{\Lambda^{-\frac{1}{2}}}{\bf U}}\right)}^{\prime}}\Sigma_{y}^{-1}\left({Z-\alpha{\Lambda^{-\frac{1}{2}}}{\bf U}}\right)}\right\}
    ×\displaystyle\times exp{12𝐔Cθw1𝐔}12superscript𝐔superscriptsubscript𝐶subscript𝜃𝑤1𝐔\displaystyle\exp\left\{{-\frac{1}{2}{\bf U}^{\prime}C_{\theta_{w}}^{-1}{\bf U}}\right\}
    proportional-to\displaystyle\propto exp{12(𝐔(Cθw1+α2Λ12Σy1Λ12)𝐔+2α𝐔Λ12Σy1Z)},12superscript𝐔superscriptsubscript𝐶subscript𝜃𝑤1superscript𝛼2superscriptΛ12superscriptsubscriptΣ𝑦1superscriptΛ12𝐔2𝛼superscript𝐔superscriptΛ12superscriptsubscriptΣ𝑦1𝑍\displaystyle\exp\left\{{-\frac{1}{2}\left({{\bf U}^{\prime}\left({C_{\theta_{w}}^{-1}+{\alpha^{2}}{\Lambda^{-\frac{1}{2}}}\Sigma_{y}^{-1}{\Lambda^{-\frac{1}{2}}}}\right){\bf U}+2\alpha{\bf U}^{\prime}{\Lambda^{-\frac{1}{2}}}\Sigma_{y}^{-1}{Z}}\right)}\right\},

    which means that 𝐔|𝐲,𝝀,ηTNn(𝟎;μu,Hu1)similar-toconditional𝐔𝐲𝝀𝜂subscriptTN𝑛0superscriptsubscript𝜇𝑢superscriptsubscript𝐻𝑢1{\bf U}\left|{{\bf y},\mbox{\boldmath$\lambda$\unboldmath},\eta}\right.\sim{{\rm TN}_{n}}\left({\bf 0};{\mu_{u}^{*}},{H_{u}^{-1}}\right) by

    μusuperscriptsubscript𝜇𝑢\displaystyle{\mu_{u}^{*}} =\displaystyle= Hu1(Λ12Σy1)Z,superscriptsubscript𝐻𝑢1superscriptΛ12superscriptsubscriptΣ𝑦1𝑍\displaystyle{H_{u}^{-1}}\left({\Lambda^{-\frac{1}{2}}}{\Sigma_{y}^{-1}}\right)Z,
    Husubscript𝐻𝑢\displaystyle{H_{u}} =\displaystyle= 1α2Cθw1+Λ12Σy1Λ12.1superscript𝛼2superscriptsubscript𝐶subscript𝜃𝑤1superscriptΛ12superscriptsubscriptΣ𝑦1superscriptΛ12\displaystyle\frac{1}{\alpha^{2}}{C_{\theta_{w}}^{-1}}+{\Lambda^{-\frac{1}{2}}}{\Sigma_{y}^{-1}}{\Lambda^{-\frac{1}{2}}}.
  • \bullet

    Full conditional distribution of regression coefficients

    π(𝜷|yI,𝐮,𝝀,η𝜷,𝒟)𝜋conditional𝜷subscript𝑦𝐼𝐮𝝀subscript𝜂𝜷𝒟\displaystyle\pi\left({\mbox{\boldmath$\beta$\unboldmath}\left|{{y_{I}},{\bf u},\mbox{\boldmath$\lambda$\unboldmath},{\eta_{-\mbox{\boldmath$\beta$\unboldmath}}},\mathscr{D}}\right.}\right) proportional-to\displaystyle\propto π(𝜷|𝐲,𝐮,𝝀,η𝜷)𝜋conditional𝜷𝐲𝐮𝝀subscript𝜂𝜷\displaystyle\pi\left({\mbox{\boldmath$\beta$\unboldmath}\left|{{\bf y},{\bf u},\mbox{\boldmath$\lambda$\unboldmath},{\eta_{-\mbox{\boldmath$\beta$\unboldmath}}}}\right.}\right)
    proportional-to\displaystyle\propto p(𝐲|𝐮,𝝀,η)π(𝜷)𝑝conditional𝐲𝐮𝝀𝜂𝜋𝜷\displaystyle p\left({{\bf y}\left|{{\bf u},\mbox{\boldmath$\lambda$\unboldmath},\eta}\right.}\right)\pi\left(\mbox{\boldmath$\beta$\unboldmath}\right)
    proportional-to\displaystyle\propto exp{12[𝐲Σy1X𝜷𝜷XΣy1𝐲+𝜷XΣy1X𝜷\displaystyle\exp\left\{{-\frac{1}{2}\left[{{\bf y}^{\prime}\Sigma_{y}^{-1}X\mbox{\boldmath$\beta$\unboldmath}-\mbox{\boldmath$\beta$\unboldmath}X^{\prime}\Sigma_{y}^{-1}{\bf y}+\mbox{\boldmath$\beta$\unboldmath}^{\prime}X^{\prime}\Sigma_{y}^{-1}X\mbox{\boldmath$\beta$\unboldmath}}\right.}\right.
    +𝜷XΣy1αΛ12𝐮+α𝐮Λ12Σy1X𝜷superscript𝜷superscript𝑋superscriptsubscriptΣ𝑦1𝛼superscriptΛ12𝐮𝛼superscript𝐮superscriptΛ12superscriptsubscriptΣ𝑦1𝑋𝜷\displaystyle\hskip 20.77039pt+\mbox{\boldmath$\beta$\unboldmath}^{\prime}X^{\prime}\Sigma_{y}^{-1}\alpha{\Lambda^{-\frac{1}{2}}}{\bf u}+\alpha{\bf u}^{\prime}{\Lambda^{-\frac{1}{2}}}\Sigma_{y}^{-1}X\mbox{\boldmath$\beta$\unboldmath}
    +𝜷(c0Ik)1𝜷]}\displaystyle\hskip 20.77039pt\left.{+\mbox{\boldmath$\beta$\unboldmath}^{\prime}{{\left({{c_{0}}{I_{k}}}\right)}^{-1}}\left.\mbox{\boldmath$\beta$\unboldmath}\right]}\right\}
    proportional-to\displaystyle\propto exp{12[𝜷(XΣy1X+(c0Ik)1)𝜷\displaystyle\exp\left\{{-\frac{1}{2}\left[{\mbox{\boldmath$\beta$\unboldmath}^{\prime}\left({X^{\prime}\Sigma_{y}^{-1}X+{{\left({{c_{0}}{I_{k}}}\right)}^{-1}}}\right)\mbox{\boldmath$\beta$\unboldmath}}\right.}\right.
    2𝜷XΣy1(𝐲αΛ12𝐮)]}.\displaystyle\hskip 20.77039pt\left.{\left.{-2\mbox{\boldmath$\beta$\unboldmath}^{\prime}X^{\prime}\Sigma_{y}^{-1}\left({{\bf y}-\alpha{\Lambda^{-\frac{1}{2}}}{\bf u}}\right)}\right]}\right\}.

    So, 𝜷|𝐲,𝐮,𝝀,η𝜷Nk(μ𝜷,𝐇𝜷1)similar-toconditional𝜷𝐲𝐮𝝀subscript𝜂𝜷subscriptN𝑘superscriptsubscript𝜇𝜷superscriptsubscript𝐇𝜷1\mbox{\boldmath$\beta$\unboldmath}\left|{\bf y},{\bf u},{\mbox{\boldmath$\lambda$\unboldmath}},{\eta_{-\mbox{\boldmath$\beta$\unboldmath}}}\right.\sim{{\rm N}_{k}}\left({\mu_{\mbox{\boldmath$\beta$\unboldmath}}^{*}},{{\bf H}_{\mbox{\boldmath$\beta$\unboldmath}}^{-1}}\right) with

    μ𝜷=𝐇𝜷1XΣy1(𝐲αΛ12𝐮),superscriptsubscript𝜇𝜷superscriptsubscript𝐇𝜷1superscript𝑋superscriptsubscriptΣ𝑦1𝐲𝛼superscriptΛ12𝐮\displaystyle{\mu_{\mbox{\boldmath$\beta$\unboldmath}}^{*}}={{\bf H}_{\mbox{\boldmath$\beta$\unboldmath}}^{-1}}{X^{\prime}}{\Sigma_{y}^{-1}}\left({\bf y}-\alpha{\Lambda^{-\frac{1}{2}}}{\bf u}\right),
    𝐇𝜷=XΣy1+1c0Ik.subscript𝐇𝜷superscript𝑋superscriptsubscriptΣ𝑦11subscript𝑐0subscriptI𝑘\displaystyle{{\bf H}_{\mbox{\boldmath$\beta$\unboldmath}}}={X^{\prime}}{\Sigma_{y}^{-1}}+\frac{1}{c_{0}}{{\rm I}_{k}}.
  • \bullet

    Full conditional distribution of parameter α𝛼\alpha

    π(α|yI,𝐮,𝝀,ηα,𝒟)𝜋conditional𝛼subscript𝑦𝐼𝐮𝝀subscript𝜂𝛼𝒟\displaystyle\pi\left({\alpha\left|{{y_{I}},{\bf u},\mbox{\boldmath$\lambda$\unboldmath},{\eta_{-\alpha}},\mathscr{D}}\right.}\right) proportional-to\displaystyle\propto π(α|𝐲,𝐮,λ,ηα)𝜋conditional𝛼𝐲𝐮𝜆subscript𝜂𝛼\displaystyle\pi\left({\alpha\left|{{\bf y},{\bf u},\lambda,{\eta_{-\alpha}}}\right.}\right)
    proportional-to\displaystyle\propto p(𝐲|𝐮,𝝀,η)π(α)𝑝conditional𝐲𝐮𝝀𝜂𝜋𝛼\displaystyle p\left({{\bf y}\left|{{\bf u},\mbox{\boldmath$\lambda$\unboldmath},\eta}\right.}\right)\pi\left(\alpha\right)
    proportional-to\displaystyle\propto exp{12[𝐲Σy1αΛ12𝐮+𝜷XΣy1αΛ12𝐮\displaystyle\exp\left\{{-\frac{1}{2}\left[{-{\bf y}^{\prime}\Sigma_{y}^{-1}\alpha{\Lambda^{-\frac{1}{2}}}{\bf u}+\mbox{\boldmath$\beta$\unboldmath}^{\prime}X^{\prime}\Sigma_{y}^{-1}\alpha{\Lambda^{-\frac{1}{2}}}{\bf u}}\right.}\right.
    𝐮Λ12αΣy1𝐲+α𝐮Λ12Σy1X𝜷superscript𝐮superscriptΛ12𝛼superscriptsubscriptΣ𝑦1𝐲𝛼superscript𝐮superscriptΛ12superscriptsubscriptΣ𝑦1𝑋𝜷\displaystyle\hskip 20.77039pt-{\bf u}^{\prime}{\Lambda^{-\frac{1}{2}}}\alpha\Sigma_{y}^{-1}{\bf y}+\alpha{\bf u}^{\prime}{\Lambda^{-\frac{1}{2}}}\Sigma_{y}^{-1}X\mbox{\boldmath$\beta$\unboldmath}
    +α2𝐮Λ12Σy1Λ12𝐮+1c1α2]}\displaystyle\hskip 20.77039pt\left.{\left.{+{\alpha^{2}}{\bf u}^{\prime}{\Lambda^{-\frac{1}{2}}}\Sigma_{y}^{-1}{\Lambda^{-\frac{1}{2}}}{\bf u}+\frac{1}{{{c_{1}}}}{\alpha^{2}}}\right]}\right\}
    proportional-to\displaystyle\propto exp{12[α2(𝐮Λ12Σy1Λ12𝐮+1c1)\displaystyle\exp\left\{{-\frac{1}{2}\left[{{\alpha^{2}}\left({{\bf u}^{\prime}{\Lambda^{-\frac{1}{2}}}\Sigma_{y}^{-1}{\Lambda^{-\frac{1}{2}}}{\bf u}+\frac{1}{{{c_{1}}}}}\right)}\right.}\right.
    2α𝐮Λ12Σy1Z]}.\displaystyle\hskip 20.77039pt\left.{\left.{-2\alpha{\bf u}^{\prime}{\Lambda^{-\frac{1}{2}}}\Sigma_{y}^{-1}Z}\right]}\right\}.

    Thus, α|𝐲,𝐮,𝝀,ηαN(μα,hα1)similar-toconditional𝛼𝐲𝐮𝝀subscript𝜂𝛼Nsuperscriptsubscript𝜇𝛼superscriptsubscript𝛼1{\alpha}\left|{\bf y},{\bf u},{\mbox{\boldmath$\lambda$\unboldmath}},{\eta_{-\alpha}}\right.\sim{\rm N}\left({\mu_{\alpha}^{*}},{h_{\alpha}^{-1}}\right) where,

    μα=hα1𝐮Λ12Σy1Z,superscriptsubscript𝜇𝛼superscriptsubscript𝛼1superscript𝐮superscriptΛ12superscriptsubscriptΣ𝑦1𝑍\displaystyle{\mu_{\alpha}^{*}}={h_{\alpha}^{-1}}{{\bf u}^{\prime}}{\Lambda^{-\frac{1}{2}}}{\Sigma_{y}^{-1}}Z,
    hα=𝐮Λ12Σy1Λ12𝐮+1c1.subscript𝛼superscript𝐮superscriptΛ12superscriptsubscriptΣ𝑦1superscriptΛ12𝐮1subscript𝑐1\displaystyle{h_{\alpha}}={{\bf u}^{\prime}}{\Lambda^{-\frac{1}{2}}}{\Sigma_{y}^{-1}}{\Lambda^{-\frac{1}{2}}}{\bf u}+\frac{1}{c_{1}}.
  • \bullet

    Full conditional distribution of parameter σ2superscript𝜎2{\sigma^{2}}
    By assume that 𝐛=𝐲X𝜷αΛ12𝐮=ZαΛ12𝐮𝐛𝐲𝑋𝜷𝛼superscriptΛ12𝐮𝑍𝛼superscriptΛ12𝐮{\bf b}={\bf y}-X\mbox{\boldmath$\beta$\unboldmath}-\alpha{\Lambda^{-\frac{1}{2}}}{\bf u}=Z-\alpha{\Lambda^{-\frac{1}{2}}}{\bf u} and 𝐁=Λ12CθwΛ12+ω2In𝐁superscriptΛ12subscript𝐶subscript𝜃𝑤superscriptΛ12superscript𝜔2subscriptI𝑛{\bf B}={\Lambda^{-\frac{1}{2}}}{C_{\theta_{w}}}{\Lambda^{-\frac{1}{2}}}+{\omega^{2}}{{\rm I}_{n}} we have

    π(σ2|yI,𝐮,𝝀,ησ2,𝒟)𝜋conditionalsuperscript𝜎2subscript𝑦𝐼𝐮𝝀subscript𝜂superscript𝜎2𝒟\displaystyle\pi\left({{\sigma^{2}}\left|{{y_{I}},{\bf u},\mbox{\boldmath$\lambda$\unboldmath},{\eta_{-{\sigma^{2}}}},\mathscr{D}}\right.}\right) proportional-to\displaystyle\propto π(σ2|𝐲,𝐮,𝝀,ησ2)𝜋conditionalsuperscript𝜎2𝐲𝐮𝝀subscript𝜂superscript𝜎2\displaystyle\pi\left({{\sigma^{2}}\left|{{\bf y},{\bf u},\mbox{\boldmath$\lambda$\unboldmath},{\eta_{-{\sigma^{2}}}}}\right.}\right)
    proportional-to\displaystyle\propto p(𝐲|𝐮,𝝀,η)π(σ2)𝑝conditional𝐲𝐮𝝀𝜂𝜋superscript𝜎2\displaystyle p\left({{\bf y}\left|{{\bf u},\mbox{\boldmath$\lambda$\unboldmath},\eta}\right.}\right)\pi\left({\sigma^{2}}\right)
    proportional-to\displaystyle\propto exp{12σ2𝐛𝐁1𝐛}|σ2𝐁|1212superscript𝜎2superscript𝐛superscript𝐁1𝐛superscriptsuperscript𝜎2𝐁12\displaystyle\exp\left\{-\frac{1}{2{\sigma^{2}}}{{\bf b}^{\prime}}{{\bf B}^{-1}}{\bf b}\right\}{\left|{\sigma^{2}}{\bf B}\right|^{-\frac{1}{2}}}
    ×\displaystyle\times (1σ2)c21exp{c3σ2}.superscript1superscript𝜎2subscript𝑐21subscript𝑐3superscript𝜎2\displaystyle{\left(\frac{1}{\sigma^{2}}\right)^{{c_{2}}-1}}\exp\left\{-\frac{c_{3}}{\sigma^{2}}\right\}.

    Since this full conditional distribution does not have any standard form, we use the Metropolis-Hastings method.

  • \bullet

    Full conditional distribution of parameter ω2superscript𝜔2{\omega^{2}}
    By recalling 𝐛𝐛\bf b and 𝐁𝐁\bf B from the above item, we also have

    π(ω2|yI,𝐮,𝝀,ηω2,𝒟)𝜋conditionalsuperscript𝜔2subscript𝑦𝐼𝐮𝝀subscript𝜂superscript𝜔2𝒟\displaystyle\pi\left({{\omega^{2}}\left|{{y_{I}},{\bf u},\mbox{\boldmath$\lambda$\unboldmath},{\eta_{-{\omega^{2}}}},\mathscr{D}}\right.}\right) proportional-to\displaystyle\propto π(ω2|𝐲,𝐮,λ,ηω2)𝜋conditionalsuperscript𝜔2𝐲𝐮𝜆subscript𝜂superscript𝜔2\displaystyle\pi\left({{\omega^{2}}\left|{{\bf y},{\bf u},\lambda,{\eta_{-{\omega^{2}}}}}\right.}\right)
    proportional-to\displaystyle\propto p(𝐲|𝐮,λ,η)π(ω2)𝑝conditional𝐲𝐮𝜆𝜂𝜋superscript𝜔2\displaystyle p\left({{\bf y}\left|{{\bf u},\lambda,\eta}\right.}\right)\pi\left({{\omega^{2}}}\right)
    proportional-to\displaystyle\propto exp{12σ2𝐛𝐁1𝐛}|σ2𝐁|1212superscript𝜎2superscript𝐛superscript𝐁1𝐛superscriptsuperscript𝜎2𝐁12\displaystyle\exp\left\{-\frac{1}{2{\sigma^{2}}}{{\bf b}^{\prime}}{{\bf B}^{-1}}{\bf b}\right\}{\left|{\sigma^{2}}{\bf B}\right|^{-\frac{1}{2}}}
    ×\displaystyle\times ω2exp{12[c42ω2+c52ω2]}superscript𝜔212delimited-[]superscriptsubscript𝑐42superscript𝜔2superscriptsubscript𝑐52superscript𝜔2\displaystyle{\omega^{-2}}\exp\left\{{-\frac{1}{2}\left[{c_{4}^{2}{\omega^{-2}}+c_{5}^{2}{\omega^{2}}}\right]}\right\}

    and hence ω2|𝐲,𝐮,𝝀,ηω2GIG(n2,c42+𝐛𝐁1𝐛σ2,c5)similar-toconditionalsuperscript𝜔2𝐲𝐮𝝀subscript𝜂superscript𝜔2GIG𝑛2superscriptsubscript𝑐42superscript𝐛superscript𝐁1𝐛superscript𝜎2subscript𝑐5{\omega^{2}}\left|{\bf y},{\bf u},\mbox{\boldmath$\lambda$\unboldmath},{\eta_{-\omega^{2}}}\right.\sim{\rm GIG}\left(-\frac{n}{2},\sqrt{{c_{4}^{2}}+\frac{{{\bf b}^{\prime}}{{\bf B}^{-1}}{{\bf b}}}{\sigma^{2}}},{c_{5}}\right).

  • \bullet

    Full conditional distribution of parameter ν𝜈\nu

    π(ν|yI,𝐮,𝝀,ην,𝒟)𝜋conditional𝜈subscript𝑦𝐼𝐮𝝀subscript𝜂𝜈𝒟\displaystyle\pi\left({\nu\left|{{y_{I}},{\bf u},\mbox{\boldmath$\lambda$\unboldmath},{\eta_{-\nu}},\mathscr{D}}\right.}\right) proportional-to\displaystyle\propto π(ν|𝐲,𝐮,𝝀,ην)𝜋conditional𝜈𝐲𝐮𝝀subscript𝜂𝜈\displaystyle\pi\left({\nu\left|{{\bf y},{\bf u},\mbox{\boldmath$\lambda$\unboldmath},{\eta_{-\nu}}}\right.}\right)
    proportional-to\displaystyle\propto p(𝐲|𝐮,𝝀,η)π(𝝀|𝐮,η)π(ν)𝑝conditional𝐲𝐮𝝀𝜂𝜋conditional𝝀𝐮𝜂𝜋𝜈\displaystyle p\left({{\bf y}\left|{{\bf u},\mbox{\boldmath$\lambda$\unboldmath},\eta}\right.}\right)\pi\left({\mbox{\boldmath$\lambda$\unboldmath}\left|{{\bf u},\eta}\right.}\right)\pi\left(\nu\right)
    proportional-to\displaystyle\propto π(𝝀|η)π(ν)𝜋conditional𝝀𝜂𝜋𝜈\displaystyle\pi\left({\mbox{\boldmath$\lambda$\unboldmath}\left|\eta\right.}\right)\pi\left(\nu\right)
    proportional-to\displaystyle\propto exp{12(𝝍+ν2J)(νCθλ)1(𝝍+ν2J)}12superscript𝝍𝜈2𝐽superscript𝜈subscript𝐶subscript𝜃𝜆1𝝍𝜈2𝐽\displaystyle\exp\left\{{-\frac{1}{2}{{\left({\mbox{\boldmath$\psi$\unboldmath}+\frac{\nu}{2}J}\right)}^{\prime}}{{\left({\nu{C_{{\theta_{\lambda}}}}}\right)}^{-1}}\left({\mbox{\boldmath$\psi$\unboldmath}+\frac{\nu}{2}J}\right)}\right\}
    ×\displaystyle\times 1ν1+n2exp{12[c62ν1+c72ν]}.1superscript𝜈1𝑛212delimited-[]superscriptsubscript𝑐62superscript𝜈1superscriptsubscript𝑐72𝜈\displaystyle\frac{1}{{{\nu^{1+\frac{n}{2}}}}}\exp\left\{{-\frac{1}{2}\left[{c_{6}^{2}{\nu^{-1}}+c_{7}^{2}\nu}\right]}\right\}.

    In this case, the Metropolis-Hastings method can be used for sampling from this full conditional as well. Recall that this full conditional also can be represent in terms of 𝐚=ln𝝀+ν2J=𝝍+ν2J𝐚𝝀𝜈2J𝝍𝜈2J{\bf a}=\ln\mbox{\boldmath$\lambda$\unboldmath}+\frac{\nu}{2}{\rm J}=\mbox{\boldmath$\psi$\unboldmath}+\frac{\nu}{2}{\rm J} in the penultimate line which is used in the next item. Therefore,

    π(ν|yI,𝐮,𝝀,ην,𝒟)1ν1+n2exp{12[c62ν1+c72ν+𝐚(νCθλ)1𝐚]}.proportional-to𝜋conditional𝜈subscript𝑦𝐼𝐮𝝀subscript𝜂𝜈𝒟1superscript𝜈1𝑛212delimited-[]superscriptsubscript𝑐62superscript𝜈1superscriptsubscript𝑐72𝜈superscript𝐚superscript𝜈subscript𝐶subscript𝜃𝜆1𝐚\displaystyle\pi\left({\nu\left|{{y_{I}},{\bf u},\mbox{\boldmath$\lambda$\unboldmath},{\eta_{-\nu}},\mathscr{D}}\right.}\right)\propto\frac{1}{{{\nu^{1+\frac{n}{2}}}}}\exp\left\{{-\frac{1}{2}\left[{c_{6}^{2}{\nu^{-1}}+c_{7}^{2}\nu+{{\bf{a}}^{\prime}}{{\left({\nu{C_{{\theta_{\lambda}}}}}\right)}^{-1}}{\bf{a}}}\right]}\right\}.
  • \bullet

    Full conditional distributions of the correlation parameters θλsubscript𝜃𝜆{\theta_{\lambda}} and θwsubscript𝜃𝑤\theta_{w}
    In terms of 𝐚𝐚\bf a, 𝐛𝐛\bf b and 𝐁𝐁\bf B, we have

    p(θw|𝐲,𝐮,𝝀,ηθw)exp{c8med(d)θw}proportional-to𝑝conditionalsubscript𝜃𝑤𝐲𝐮𝝀subscript𝜂subscript𝜃𝑤subscript𝑐8𝑚𝑒𝑑𝑑subscript𝜃𝑤\displaystyle p\left({\theta_{w}}\left|{\bf y},{\bf u},\mbox{\boldmath$\lambda$\unboldmath},{\eta_{-{\theta_{w}}}}\right.\right)\propto\exp\left\{-\frac{c_{8}}{{med}\left(d\right)}{{\theta_{w}}}\right\}
    ×exp{12σ2𝐛𝐁1𝐛}|σ2𝐁|12absent12superscript𝜎2superscript𝐛superscript𝐁1𝐛superscriptsuperscript𝜎2𝐁12\displaystyle\hskip 56.9055pt\times\exp\left\{-\frac{1}{2{\sigma^{2}}}{{\bf b}^{\prime}}{{\bf B}^{-1}}{\bf b}\right\}{\left|{\sigma^{2}}{\bf B}\right|^{-\frac{1}{2}}}
    ×exp{12𝐮Cθw1𝐮}absent12superscript𝐮superscriptsubscript𝐶subscript𝜃𝑤1𝐮\displaystyle\hskip 56.9055pt\times\exp\left\{-\frac{1}{2}{{\bf u}^{\prime}}{C_{\theta_{w}}^{-1}}{\bf u}\right\}

    and

    p(θλ|𝐲,𝐮,𝝀,ηθλ)exp{c9med(d)θλ}proportional-to𝑝conditionalsubscript𝜃𝜆𝐲𝐮𝝀subscript𝜂subscript𝜃𝜆subscript𝑐9𝑚𝑒𝑑𝑑subscript𝜃𝜆\displaystyle p\left({\theta_{\lambda}}\left|{\bf y},{\bf u},\mbox{\boldmath$\lambda$\unboldmath},{\eta_{-{\theta_{\lambda}}}}\right.\right)\propto\exp\left\{-\frac{c_{9}}{{med}\left(d\right)}{\theta_{\lambda}}\right\}
    ×exp{12𝐚(νCθλ)1𝐚}.absent12superscript𝐚superscript𝜈subscript𝐶subscript𝜃𝜆1𝐚\displaystyle\hskip 56.9055pt\times\exp\left\{-\frac{1}{2}{{\bf a}^{\prime}}{\left(\nu{C_{\theta_{\lambda}}}\right)^{-1}}{\bf a}\right\}.

    These full conditional distributions are of nonstandard form, so a Metropolis-Hastings step would be used.

Appendix B: Rainfall Data

Table 8. Rainfall amounts of Fars province measured in inch, geographical locations, and elevation in meter.
station precipitation longitude latitude elevation
Abadeh 1.09345684 52.40 31.11 2030
Arsanjan 0.48489401 53.16 29.56 1703
Bavanat 0.21459461 53.40 30.28 2231
Darab 0 54.17 28.47 1098
Eqlid 1.29816493 52.38 30.54 2300
Estahban 0.41391564 54.02 29.05 1609
Farashband 0.37737203 52.06 28.48 782
Fasa 0.47246634 53.41 28.56 1288
Firuzabad 0 52.33 28.53 1362
Gerash 0.29725655 54.15 27.69 403
Jahrom 0.21737661 53.32 28.29 1082
Kavar 0.27805494 52.65 29.16 651
Kazerun 0.31700190 51.39 29.36 860
Kherameh 0.26663226 53.29 29.63 875
Khonj 0.55668826 53.40 27.98 511
Khorrambid 0.77678033 53.09 30.35 2251
Lamerd 0 53.12 27.22 405
Larestan 0 54.17 27.42 792
Mamasani 0.83764997 51.32 30.04 972
Marvdasht 0.51173630 52.54 29.56 1605
Mohr 0.23188202 52.88 27.55 659
Neyriz 0.58328311 54.20 29.12 1632
Pasargad 0.74427868 53.21 30.19 1614
Qir-o-Karzin 0 53.03 28.28 746
Rostam 1.49020491 51.51 30.25 864
Sarvestan 0.42793923 53.21 29.27 719
Sepidan 1.61606073 52.00 30.14 2201
Shiraz 0.68990878 52.36 29.32 1484
Zarghan 0.22756008 52.43 29.47 1596
Zarrindasht 0.34310578 54.25 28.21 1029

Appendix C: Details On the Used Distributions

An n𝑛n-dimensional random vector Y𝑌Y is said to have a multivariate closed skew-normal distribution, denoted by CSNn,m(𝝁,Σ,D,𝐯,Θ)𝐶𝑆subscript𝑁𝑛𝑚𝝁Σ𝐷𝐯ΘCSN_{n,m}\left(\mbox{\boldmath$\mu$\unboldmath},\Sigma,D,{\bf v},\Theta\right), if its density is ϕn(𝐲;𝝁,Σ)Φm(D(𝐲𝝁);𝐯,Θ)/Φm(𝟎;𝐯,Θ+DΣD)subscriptitalic-ϕ𝑛𝐲𝝁ΣsubscriptΦ𝑚𝐷𝐲𝝁𝐯ΘsubscriptΦ𝑚0𝐯Θ𝐷superscriptΣ𝐷\phi_{n}\left({\bf y};\mbox{\boldmath$\mu$\unboldmath},\Sigma\right)\Phi_{m}\left(D\left({\bf y}-\mbox{\boldmath$\mu$\unboldmath}\right);{\bf v},\Theta\right)/\Phi_{m}\left({\bf 0};{\bf v},\Theta+D\Sigma^{\prime}D\right), where 𝝁n𝝁superscript𝑛\mbox{\boldmath$\mu$\unboldmath}\in{\mathbb{R}}^{n}, 𝐯m𝐯superscript𝑚{\bf v}\in{\mathbb{R}}^{m} and Σn×nΣsuperscript𝑛𝑛\Sigma\in{\mathbb{R}}^{n\times n} and Θm×mΘsuperscript𝑚𝑚\Theta\in{\mathbb{R}}^{m\times m} are both covariance matrices, Dm×n𝐷superscript𝑚𝑛D\in{\mathbb{R}}^{m\times n}, ϕn(𝐲;𝝁,Σ)subscriptitalic-ϕ𝑛𝐲𝝁Σ\phi_{n}\left({\bf y};\mbox{\boldmath$\mu$\unboldmath},\Sigma\right) and Φn(𝐲;𝝁,Σ)subscriptΦ𝑛𝐲𝝁Σ\Phi_{n}\left({\bf y};\mbox{\boldmath$\mu$\unboldmath},\Sigma\right) are the probability density function (pdf) and cumulative distribution function (cdf), respectively, of the n𝑛n-dimensional normal distribution with mean vector 𝝁𝝁\mu and covariance matrix ΣΣ\Sigma.

Arellano-Valle and Azzalini (2006) presented a family of skew-normal distributions which unifies a plethora of SN𝑆𝑁SN distributions including CSN𝐶𝑆𝑁CSN with no over-parametrization problem. According to their approach, an n𝑛n-dimensional random vector Y𝑌Y has a multivariate unified skew-normal distribution, denoted by SUNn,m(𝝁,Σ,Γ,𝐯,Δ)𝑆𝑈subscript𝑁𝑛𝑚𝝁ΣΓ𝐯ΔSUN_{n,m}\left(\mbox{\boldmath$\mu$\unboldmath},\Sigma,\Gamma,{\bf v},\Delta\right), if its density is

ϕn(𝐲;𝝁,Σ)Φm(ΓΣ1(𝐲𝝁);𝐯,ΔΓΣ1Γ)/Φm(𝟎;𝐯,Δ),subscriptitalic-ϕ𝑛𝐲𝝁ΣsubscriptΦ𝑚superscriptΓsuperscriptΣ1𝐲𝝁𝐯ΔsuperscriptΓsuperscriptΣ1ΓsubscriptΦ𝑚0𝐯Δ\displaystyle\phi_{n}\left({\bf y};\mbox{\boldmath$\mu$\unboldmath},\Sigma\right)\Phi_{m}\left(\Gamma^{\prime}{\Sigma^{-1}}\left({\bf y}-\mbox{\boldmath$\mu$\unboldmath}\right);{\bf v},\Delta-\Gamma^{\prime}{\Sigma^{-1}}\Gamma\right)/\Phi_{m}\left({\bf 0};{\bf v},\Delta\right),

where Δm×mΔsuperscript𝑚𝑚\Delta\in{\mathbb{R}}^{m\times m} is a correlation matrix, Γn×mΓsuperscript𝑛𝑚\Gamma\in{\mathbb{R}}^{n\times m}. The SUN𝑆𝑈𝑁SUN and CSN𝐶𝑆𝑁CSN classes are equivalent when Δ=Θ+DΣDΔΘ𝐷Σsuperscript𝐷\Delta=\Theta+D\Sigma D^{\prime} and Γ=ΣDΓΣ𝐷\Gamma=\Sigma D.

Let {G(𝐬),sRd}𝐺𝐬𝑠𝑅superscript𝑑\left\{{G\left({\bf s}\right),s\in R\subseteq{\mathbb{R}^{d}}}\right\}, d1𝑑1d\geq 1, be a spatial, ergodic, stationary, zero-mean Gaussian process with stationary covariance function c(𝐡)𝑐𝐡c\left({\bf h}\right) and denoted the covariance matrix of the random vector 𝐆=(G(s1),,G(sn))𝐆superscript𝐺subscript𝑠1𝐺subscript𝑠𝑛{\bf G}={\left({G\left({{s_{1}}}\right),\ldots,G\left({{s_{n}}}\right)}\right)^{\prime}} by ΣΣ\Sigma. Also consider VNn(𝟎,Cθ)similar-to𝑉subscript𝑁𝑛0subscript𝐶𝜃V\sim{N_{n}}\left({\bf 0},{C_{\theta}}\right) and UTNn(𝟎;𝟎,Cθ)similar-to𝑈𝑇subscript𝑁𝑛00subscript𝐶𝜃U\sim{TN_{n}}\left({\bf 0};{\bf 0},{C_{\theta}}\right) are independent in which, TNn(𝐜;𝝁,Σ)𝑇subscript𝑁𝑛𝐜𝝁Σ{TN_{n}}\left({\bf c};\mbox{\boldmath$\mu$\unboldmath},\Sigma\right) denotes the Nn(𝝁,Σ)subscript𝑁𝑛𝝁ΣN_{n}({\mbox{\boldmath$\mu$\unboldmath}},\Sigma) distribution truncated below at a point 𝐜𝐜{\bf c}. Then if 𝐖λ=dαΛ12𝐔+σΛ12𝐕subscript𝐖𝜆superscript𝑑𝛼superscriptΛ12𝐔𝜎superscriptΛ12𝐕{{\bf W}_{\lambda}}\mathop{=}\limits^{d}\alpha{\Lambda^{-\frac{1}{2}}}{\bf U}+\sigma{\Lambda^{-\frac{1}{2}}}{\bf V} and 𝐓𝐓\bf T be a normal vector of dimension n𝑛n, we have

(𝐓𝐆)|𝝀N2n(𝟎,[CθαCθΛ12αΛ12CθΣw]).similar-toconditional𝐓𝐆𝝀subscript𝑁2𝑛0delimited-[]subscript𝐶𝜃𝛼subscript𝐶𝜃superscriptΛ12missing-subexpressionmissing-subexpressionmissing-subexpressionmissing-subexpressionmissing-subexpressionmissing-subexpressionmissing-subexpressionmissing-subexpressionmissing-subexpressionmissing-subexpressionmissing-subexpressionmissing-subexpressionmissing-subexpressionmissing-subexpressionmissing-subexpressionmissing-subexpressionmissing-subexpressionmissing-subexpression𝛼superscriptΛ12subscript𝐶𝜃subscriptΣ𝑤missing-subexpressionmissing-subexpressionmissing-subexpressionmissing-subexpressionmissing-subexpressionmissing-subexpressionmissing-subexpressionmissing-subexpressionmissing-subexpressionmissing-subexpressionmissing-subexpressionmissing-subexpressionmissing-subexpressionmissing-subexpressionmissing-subexpressionmissing-subexpressionmissing-subexpressionmissing-subexpression\displaystyle\left(\begin{array}[]{l}{\bf T}\\ {\bf G}\end{array}\right)\left|{\mbox{\boldmath$\lambda$\unboldmath}\sim{N_{2n}}\left({{\bf 0},\left[{\begin{array}[]{*{20}{c}}{{C_{\theta}}}&{\alpha{C_{\theta}}{\Lambda^{-\frac{1}{2}}}}\\ {\alpha{\Lambda^{-\frac{1}{2}}}{C_{\theta}}}&{{\Sigma_{w}}}\end{array}}\right]}\right)}\right..

Now, we define a SUGLG𝑆𝑈𝐺𝐿𝐺SUGLG process {Wλ(s)}subscript𝑊𝜆𝑠\{W_{\lambda}(s)\} based on the following hierarchical representation:

  1. (1)

    [Wλ(𝐬)|λ(𝐬)]=d[G(𝐬)|𝐓>𝟎,λ(𝐬)]delimited-[]conditionalsubscript𝑊𝜆𝐬𝜆𝐬superscript𝑑𝐺𝐬ket𝐓0𝜆𝐬\left[{{W_{\lambda}}\left({\bf s}\right)\left|{\lambda\left({\bf s}\right)}\right.}\right]\mathop{=}\limits^{d}\left[{G\left({\bf s}\right)\left|{{\bf T}>{\bf 0},\lambda\left({\bf s}\right)}\right.}\right],

  2. (2)

    λ(𝐬)𝜆𝐬{\lambda\left({\bf s}\right)} is a log-Gaussian stochastic process.

References

  • [1] Arellano-Valle, R.B. and Azzalini, A. (2006). On the unification of families of skew-normal distributions. Scandinavian Journal of Statistics, 33, 561-574.
  • [2] Azzalini, A. and Capitanio, A. (1999). Statistical applications of the multivariate skew normal distribution. Journal of the Royal Statistical Society, Soc. B, 61, 579-602.
  • [3] De Oliveira, V. (2005). Bayesian inference and prediction of Gaussian random fields based on censored data. Journal of Computational and Graphical Statistics, 14, 95-115.
  • [4] De Oliveira, V., Kedem, B. and Short, D.A. (1997). Bayesian prediction of transformed Gaussian random fields. Journal of the American Statistical Association, 92, 1422-1433.
  • [5] Deutsch, C.V. and Journel, A.G. (1998). GSLIB: Geostatistical Software Library and Users Guide. New York: Oxford University Press.
  • [6] Dubrule, O. and Kostov, C. (1986). An interpolation method taking into account inequality constraints. Mathematical Geosciences, 18, 33-51.
  • [7] Fonseca, T. and Steel, M. (2011). Non-Gaussian spatiotemporal modelling through scale mixing. Biometrika, 98, 761-774.
  • [8] Fridley, B.L. and Dixon, P. (2007). Data augmentation for a Bayesian spatial model involving censored observations. Environmetrics, 18, 107-123.
  • [9] Geisser, S. (1993). Predictive Inference: An Introduction, London: Chapman & Hall Ltd.
  • [10] Genton, M.G. and Zhang, H. (2012). Identifiability problems in some non-Gaussian spatial random fields. Chilean Journal of Statistics, 3, 171-179.
  • [11] Haining, R. (1991). Spatial data analysis in the social and environmental sciences. Cambridge: Cambridge University Press.
  • [12] Karimi, O. and Mohammadzadeh, M. (2011). Bayesian spatial prediction for discrete closed skew Gaussian random field. Mathematical Geosciences, 43.5: 565-582.
  • [13] Kim, H.M. and Mallik, B.K. (2004). A Bayesian prediction using the skew-Gaussian distribution. Journal of Statistical Planning and Inference, 120, 85-101.
  • [14] Militino, A.F. and Ugarte, M.D. (1999). Analyzing censored spatial data. Mathematical Geosciences, 31, 551-562.
  • [15] Palacios, M. and Steel, M. (2006). Non-Gaussian Bayesian geostatistical modeling. Journal of the American Statistical Association, 101, 604-618.
  • [16] Prates, Marcos, O., Dey K.D. and Lachos, V. H. (2012). A dengue fever study in the state of Rio de Janeiro with the use of generalized skew-normal/independent spatial fields. Chilean Journal of Statistics, 3, 33-45.
  • [17] Rathbun, S. L. (2006). Spatial predictions with left-censored observations. Journal of Agricultural, Biological, and Environmental Statistics, 11, 317-336.
  • [18] Ren, Q., Banerjee, S., Finley, A.O. and Hodges, J.S. (2011). Variational Bayesian methods for spatial data analysis. Computational Statistics &\& Data Analysis, 55, 3197-3217.
  • [19] Rimstad, K. and Omre, H. (2014). Skew-Gaussian random fields. Spatial Statistics, 10: 43-62.
  • [20] Robbins, H. and Monro, S. (1951). A stochastic approximation method. The Annals of Mathematical Statistics, 22, 400–407.
  • [21] Tadayon, V. and Jafari Khaledi, M. (2015). Bayesian analysis of skew Gaussian spatial models based on censored data. Communications in Statistics - Simulation and Computation, 44, 2431-2441.
  • [22] Tadayon, V. and Rasekh, A. (2018). Non-Gaussian covariate-dependent spatial measurement error model for analyzing big spatial data. Journal of Agricultural, Biological and Environmental Statistics, https://doi.org/10.1007/s13253-018-00341-3.
  • [23] Tadayon, V. and Torabi, M. (2018). Spatial models for non-Gaussian data with covariate measurement error. Environmetrics, https://doi.org/10.1002/env.2545.
  • [24] Tadayon, V. (2018). On an extension of stochastic approximation EM algorithm for incomplete data problems. arXiv:1811.08595.
  • [25] Tadayon, V. (2018). Analysis of Gaussian spatial models with covariate measurement error. arXiv:1811.05648.
  • [26] Toscas, P. J. (2010). Spatial modeling of left-censored water quality data. Environmetrics, 21, 632-644.
  • [27] Zareifard, H. and Jafari Khaledi. M. (2013). Non-Gaussian modeling of spatial data using scale mixing of a unified skew-Gaussian process. Journal of Multivariate Analysis, 114, 16-28.
  • [28] Zhang, H. and El-Shaarawi, A. (2010). On spatial skew-Gaussian processes and applications. Environmetrics, 21, 33-47.