Central depression in nucleonic densities: Trend analysis in nuclear density-functional-theory approach
Abstract
- Background
-
The central depression of nucleonic density, i.e., a reduction of density in the nuclear interior, has been attributed to many factors. For instance, bubble structures in superheavy nuclei are believed to be due to the electrostatic repulsion. In light nuclei, the mechanism behind the density reduction in the interior has been discussed in terms of shell effects associated with occupations of -orbits.
- Purpose
-
The main objective of this work is to reveal mechanisms behind the formation of central depression in nucleonic densities in light and heavy nuclei. To this end, we introduce several measures of the internal nucleonic density. Through the statistical analysis, we study the information content of these measures with respect to nuclear matter properties.
- Method
-
We apply nuclear density functional theory with Skyrme functionals. Using the statistical tools of linear least square regression, we inspect correlations between various measures of central depression and model parameters, including nuclear matter properties. We study bivariate correlations with selected quantities as well as multiple correlations with groups of parameters. Detailed correlation analysis is carried out for 34Si for which a bubble structure has been reported recently, 48Ca, and =82, 126, and 184 isotonic chains.
- Results
-
We show that the central depression in medium-mass nuclei is very sensitive to shell effects, whereas for superheavy systems it is firmly driven by the electrostatic repulsion. An appreciable semi-bubble structure in proton density is predicted for 294Og, which is currently the heaviest nucleus known experimentally.
- Conclusion
-
Our correlation analysis reveals that the central density indicators in nuclei below 208Pb carry little information on parameters of nuclear matter; they are predominantly driven by shell structure. On the other hand, in the superheavy nuclei there exists a clear relationship between the central nucleonic density and symmetry energy.
I Introduction
The phenomenon of central depression of nucleonic density, i.e., a reduction of density in the nuclear interior, has been introduced already in 1946 Wilson (1946) and the first quantitative calculations of this effect were performed in in the early 1970s Davies et al. (1972); Campi and Sprung (1973). By now, there exists an appreciable literature devoted to this subject, see, e.g., Refs. Myers and Swiatecki (1969); Friedrich et al. (1986); Möller et al. (1992); Moretto et al. (1996); Royer et al. (1996); Dietrich and Pomorski (1998); Dechargé et al. (1999); Bender (1999); Berger et al. (2001); Nazarewicz et al. (2002); Dechargé et al. (2003); Afanasjev and Frauendorf (2005); Pei et al. (2005); Roca-Maza et al. (2013); Mehta et al. (2015); Todd-Rutel et al. (2004); Grasso et al. (2007); Khan et al. (2008); Grasso et al. (2009); Chu et al. (2010); Wang et al. (2011); Yan-Zhao et al. (2011); Liu et al. (2012); Yao et al. (2012); Nakada et al. (2013); Meucci et al. (2014); Wang et al. (2015); Li et al. (2016); Duguet et al. (2017); Mutschler et al. (2016). For superheavy nuclei, the term “bubble nucleus” was introduced in the context of nuclei with vanishing density at the nuclear interior, or at least reduced density (semi-bubble). Other exotic topologies of nucleonic density, such as toroidal configurations Siemens and Bethe (1967); Wong (1972, 1985, 1973); Wong et al. (1977); Warda (2008); Viñas et al. (2008); Jachimowicz et al. (2011); Staszczak et al. (2017) were also suggested, and calculations of nuclear fragmentation reactions predicted toroidal and bubble formations Borderie et al. (1993a, b); Bauer et al. (1992); Xu et al. (1994).
The appearance of bubble structures in heavy nuclei has been attributed to the effect of the electrostatic repulsion by moving protons towards the nuclear surface. The properties of superheavy bubble nuclei, including their characteristic shell structure, have been studied in, e.g., Myers and Swiatecki (1969); Friedrich et al. (1986); Möller et al. (1992); Moretto et al. (1996); Royer et al. (1996); Bender (1999); Dechargé et al. (1999); Berger et al. (2001); Dechargé et al. (2003); Afanasjev and Frauendorf (2005); Pei et al. (2005); Roca-Maza et al. (2013); Mehta et al. (2015). The properties of bubble nuclei can be related to the nuclear equation of state and the formation of nuclear pasta Horowitz and Shen (2008).
Central depression of nucleonic densities is also expected in light systems such as 34Si and 46Ar Davies et al. (1972); Todd-Rutel et al. (2004); Grasso et al. (2007); Khan et al. (2008); Grasso et al. (2009); Chu et al. (2010); Wang et al. (2011); Yan-Zhao et al. (2011); Liu et al. (2012); Yao et al. (2012); Nakada et al. (2013); Meucci et al. (2014); Wu et al. (2014); Shukla and Åberg (2014); Wang et al. (2015); Li et al. (2016); Duguet et al. (2017); Mutschler et al. (2016). In contrast to heavy nuclei, the mechanism behind the density reduction in light systems is related to shell effects. Here, the effect is driven by -orbits, as those are the only states, which contribute to the central density in a non-relativistic picture. In the case of 34Si and 46Ar it is the vacancy in the proton natural orbit that is responsible for the central depression. In heavy nuclei, an excellent candidate is 206Hg, where the proton natural orbit is weakly occupied Todd-Rutel et al. (2004); Wang et al. (2015).
The main objective of this work is to reveal mechanisms behind the formation of central depression in nucleonic densities in light and heavy nuclei. To this end, we introduce several measures of the internal nucleonic density. Through the statistical analysis, we study the information content of these measures with respect to nuclear matter properties.
II Measures of central depression
A variety of measures of the central depression in nucleonic densities can be found In the literature. A simple and straightforward definition is Duguet et al. (2017); Yao et al. (2012), where is the central density and is the maximum density. However this quantity is sensitive to oscillations due to shell effects. Additionally it is always positive semi-definite; hence, it cannot quantify the degree of central enhancement, if it is present. To this end, we adopted a slightly different measure:
| (1) |
where and is the average density of the nucleus assuming a constant density up to the diffraction radius Friedrich and Vögler (1982), also referred to as box-equivalent radius. We choose instead of the r.m.s. radius, because this quantity is not affected by the surface thickness.
Another useful indicator of central depression can be obtained from the charge density form factor, which is a measurable quantity Friedrich and Vögler (1982). It has been shown that the presence of a central depression in charge density shifts the zeroes of the form factor Friedrich et al. (1986); Roca-Maza et al. (2013); Chu et al. (2010); Liu et al. (2012); Meucci et al. (2014). Within the modified Helm model Friedrich et al. (1986), assuming a parabolic dependence of the density on around the origin, the central depression can be parametrized by a dimensionless measure . This indicator can be directly obtained from the shift of the first and second zero of the form factor. The advantage of is that it is fairly robust with respect to shell fluctuations that predominantly influence the form factor at large -values Friedrich and Vögler (1982). Positive values of correspond to the central depression while negative values indicate central enhancement.
III Theoretical framework
III.1 Nuclear DFT
In order to assess central depression across the nuclear landscape, we employ nuclear density functional theory (DFT) Bender et al. (2003) with the globally-optimized Skyrme energy density functionals SV-min Klüpfel et al. (2009), SLy6 Chabanat et al. (1998), and UNEDF1 Kortelainen et al. (2012). Pairing is treated at the BCS level. The pairing space is limited by a soft cutoff Bonche et al. (1985); Krieger et al. (1990) with the cutoff parameter chosen such that it covers about 1.6 extra oscillator shells above the Fermi energy Bender et al. (2000). This amounts to a pairing band of about 5 MeV in medium and heavy nuclei.
III.2 Correlation analysis
The results of our DFT calculations are analyzed using the tools of linear least square regression Dobaczewski et al. (2014). Our analysis focuses on correlations around the minimum of SV-min. We assume a linear dependence between the model parameters and observables and we checked this assumption a posteriori. By computing the covariance of quantities and , as well as their respective variances and , we assess - correlations in terms of the bivariate correlation coefficient
| (2) |
or its square , which is the coefficient of determination (CoD) Glantz et al. (1990). We determine the CoDs as described in Ref. Reinhard (2016). Note that the CoD contains information on how well an observable (or model parameter) is determined by another one. However it does not give any information about the associated rate of changes.
Multiple correlation coefficients (MCC) Allison (1998) of observables with groups of parameters can determined by computing
| (3) |
where is the matrix of CoDs between the model parameters of group and contains the CoDs between the observables and the single group members. Values of range from 0 to 1, where 0 implies, that those quantities are completely uncorrelated, 1 denotes that one quantity determines the other completely. An of, say, means that 30% of the variance in is predictable from . For a group containing all model parameters, an observable is completely determined; hence, .
IV Central depression in light and heavy nuclei
To avoid the well-known competition between central depression and shape deformation effects Afanasjev and Frauendorf (2005); Pei et al. (2005); Wu et al. (2014), we will primarily consider nuclei that are predicted to be spherical. Specifically, we study the light- and medium-mass nuclei 34Si and 48Ca, semi-magic isotonic chains =82, 126, and 184, as well as the the superheavy system 472164.
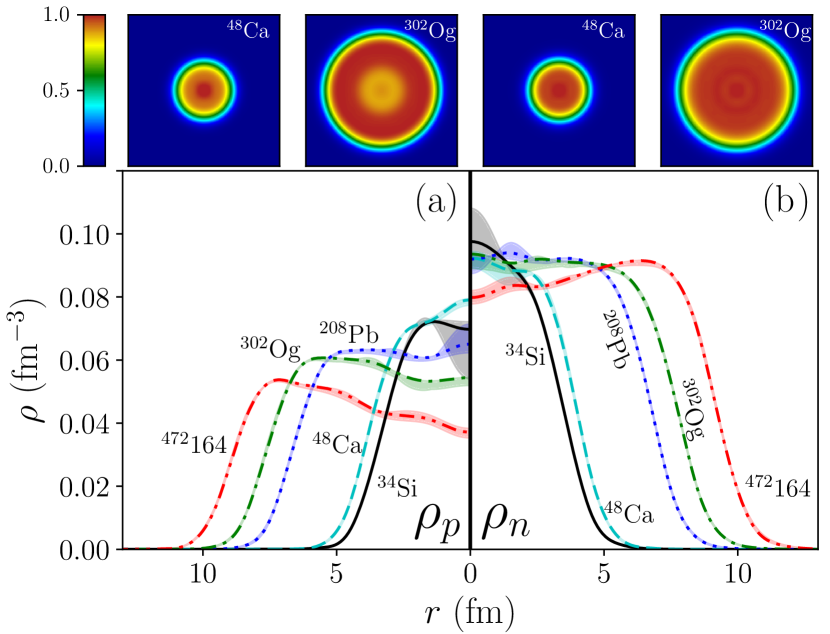
The proton and neutron densities predicted in SV-min are shown in Fig. 1 for several nuclei. It can be seen that superheavy nuclei such as 302Og and 472164 exhibit a pronounced central depression in the proton density distribution. The central depression in 34Si is predicted to be rather weak by SV-min. The doubly-magic nuclei 48Ca and 208Pb show a bump, or enhancement, in the central proton density. The neutron densities displayed in Fig. 1(b) are either flat or exhibit central enhancement. It is only in 472164 that a pronounced central depression in is obtained.
The shaded areas indicate the systematic uncertainty stemming from different choice of a Skyrme functional. The light nucleus 34Si exhibits the large uncertainty in the interior. In particular, the parametrization SLy6 predicts 34Si to be doubly magic Mutschler et al. (2016). The large gap between and proton shells obtained in this model results in a -shell vacancy and large central depression. Other models predict a less pronounced subshell closure at which results in a non-vanishing proton pairing, larger occupation, and weaker central depression. This sensitivity to different models which share about the same bulk properties suggests that the nature of central depression in 34Si is governed by shell effects. This is consistent with the detailed study of 34Si in Ref. Duguet et al. (2017), which concluded that the “prediction regarding the (non)existence of the bubble structure in 34Si varies significantly with the nuclear Hamiltonian used.” For other nuclei, the systematic uncertainty is much smaller and SV-min predictions seem to be robust.
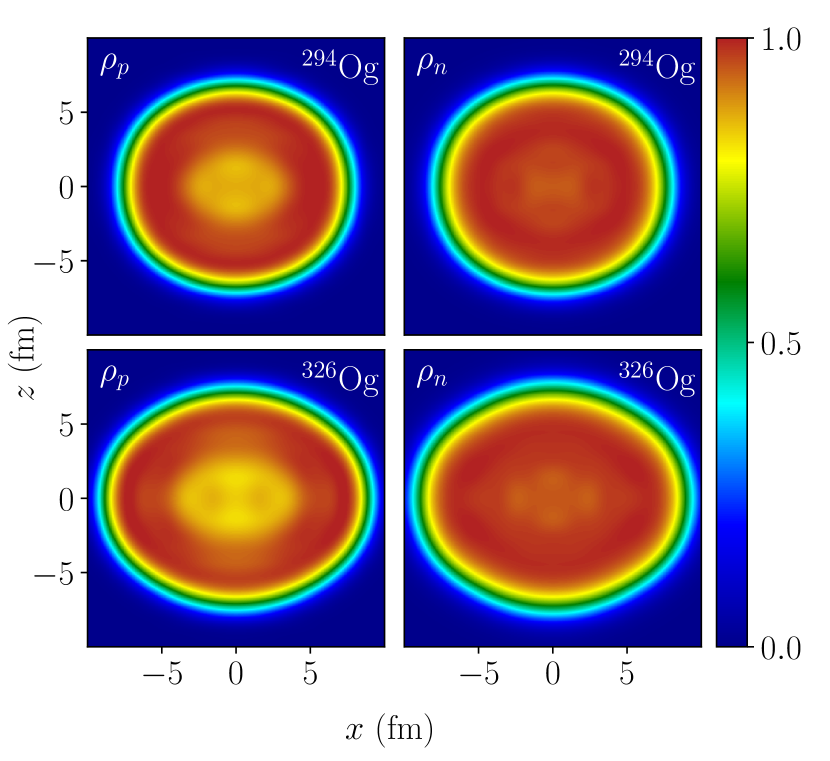
The heaviest nucleus known today is 294Og Oganessian et al. (2006). In most DFT calculations Ćwiok et al. (2005); Heenen et al. (2015), this system is expected to be slightly deformed, with a triaxial shape. To see whether shape deformation can destroy central depression in 294Og Afanasjev and Frauendorf (2005); Pei et al. (2005); Wu et al. (2014), in Fig. 2 we display the proton and neutron densities in this nucleus, as well as in the heavier isotope 326Og, which is predicted to have an appreciable prolate deformation. In both cases, the deformed semi-bubble structure in proton density is clearly visible. We can thus conclude that – according to our calculations – the region of deformed semi-bubble nuclei has been reached experimentally.
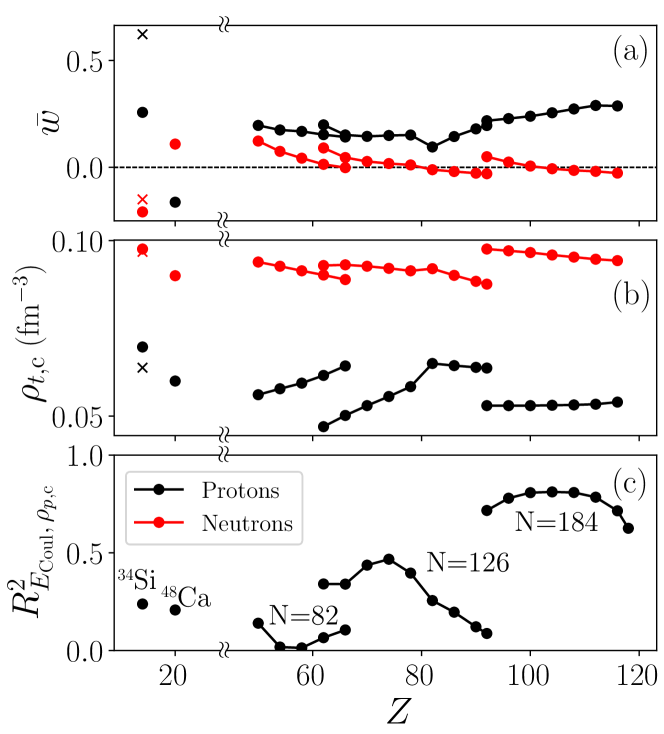
Figure 3(a) shows the central depression parameter for for 34Si, 48Ca, and , 126, and 184 isotonic chains predicted by SV-min. As discussed above, the value of in 34Si predicted in calculations without pairing increases dramatically. In heavy and superheavy nuclei, central proton depression is systematically larger than . The opposite trend is expected for the central densities shown Fig. 3(b): is systematically reduced as compared to .
The dip/cusp in 208Pb can be explained through the full occupation of the proton shell, known to be responsible for the central proton depression in 206Hg. For lighter isotones, the shell is partly occupied, e.g., for Pt its occupation is 63%, and this explains the rise of and drop in . While is rather flat for Z, it smoothly increases with along the isotonic chain. This feature is supported by the constant central proton density for the chain seen in Fig. 3(b).
V Correlation analysis
To understand the origin of trends seen in Figs. 3(a) and (b), in the following we perform the correlation analysis that relates the behavior of key observables related to the central depression to the parameters of the Skyrme functional. As relevant observables we choose the Coulomb energy , central depression parameters , , , as well as the isovector and isoscalar densities at : and , respectively.
Figure 3(c) displays, in particular, the CoD between and . It is apparent that for the isotonic chain is closely related to , whereas for lighter nuclei the correlation between those two parameters is marginal. That results nicely demonstrates that while the central depression in superheavy nuclei, such as the chain, is primarily driven by the electrostatic repulsion, the nature of central depression in lighter systems is different.
While the correlation between the Coulomb energy and central proton density depression in superheavy nuclei is apparent, in order to fully understand the origin of central depression one needs to study correlations with the actual Skyrme model parameters. (The Coulomb energy density functional primarily depends on the proton density; hence, it cannot be associated with one particular model parameter.)
Some Skyrme functional parameters, characterizing its bulk properties, can be conveniently expressed through nuclear matter properties (NMP) in symmetric homogeneous matter. Those are: the equilibrium density ; energy-per-nucleon at equilibrium ; incompressibility ; effective mass characterizing the dynamical isoscalar response; symmetry energy ; slope of symmetry energy ; and Thomas-Reiche-Kuhn sum-rule enhancement characterizing the dynamical isovector response, see Ref. Klüpfel et al. (2009); Kortelainen et al. (2010) for definitions. In addition, we consider two parameters characterizing surface properties: surface energy coefficient and surface-symmetry energy coefficient . Other model parameters, such as those characterizing spin-orbit and pairing terms yield small correlations () with the considered observables; hence, they are not considered in our statistical analysis of CoDs.
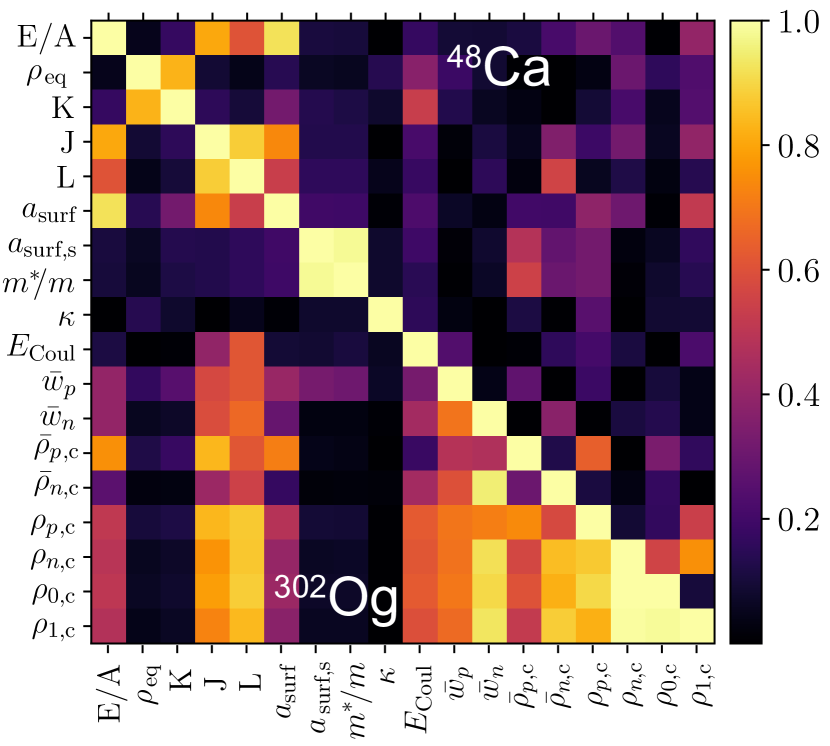
Figure 4 shows the matrices of CoDs between the model parameters and the central density indicators for 48Ca and 302Og. The correlation matrix between the model parameters is nucleus-independent since it is a property of SV-min parametrization. The correlations between the different measures of central depression are very different for the two nuclei. While the corresponding CoDs are mostly for 48Ca they are appreciable for 302Og. This is because the central densities in 48Ca are dominated by shell effects, which contribute differently to the different measures while global properties dominate in heavy nuclei and drive all measures the same way. Furthermore, the correlations between the model parameters and the central density indicators are insignificant for 48Ca, but show a clear correlation with , , , and for 302Og.
By studying CoDs for other nuclei we conclude that the central density indicators do not correlate with NMPs for nuclei below 208Pb. Especially the CoDs for 208Pb are governed by shell effects, since the exact structure of the orbit plays an important role in determining the internal proton density in this nucleus. For nuclei heavier than 208Pb, the trends seen for 302Og become more and more pronounced with . In 472164 all central density indicators correlate strongly ().
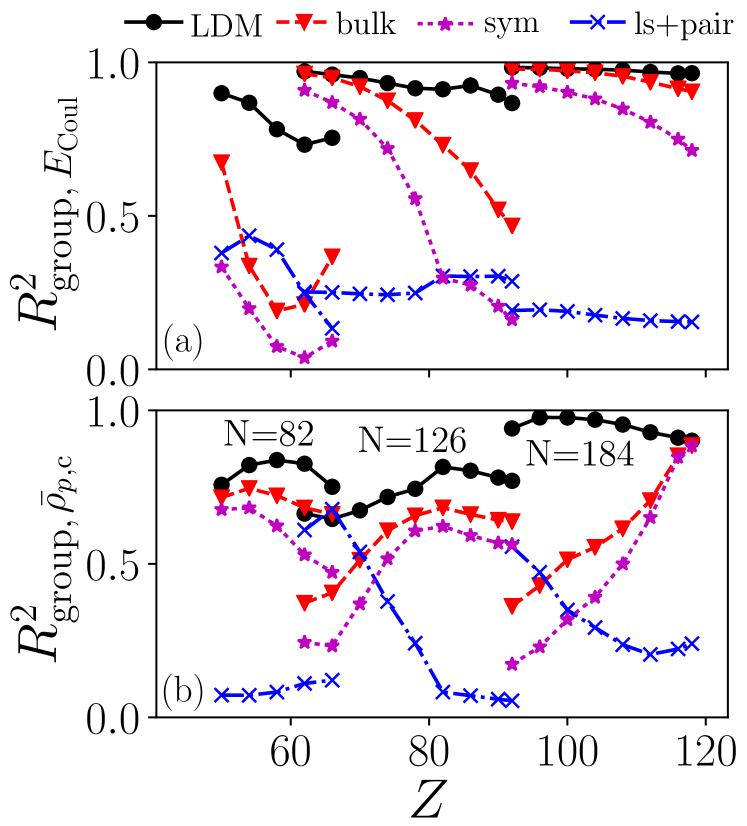
Correlations with single model parameters can be usefully complemented by studying MCC. Figure 5 shows MCCs between the four groups of SV-min parameters and two observables of interest in heavy nuclei: Coulomb energy and the normalized central proton density . The parameter groups considered here are: liquid drop model parameters (LDM), bulk-properties parameters (bulk), symmetry energy parameters (sym), and spin-orbit and pairing parameters (ls+pair); see the caption of Fig. 5 for details.
Figure 5(a) illustrates MCCs with the Coulomb energy, which is closely related to the central depression for heavy nuclei, see discussion around Fig. 3. The Coulomb energy is almost entirely determined by LDM. The impact of surface parameters on is large in isotones while is practically negligible for systems. Surface effects tend to increase with along the and 184 chains, because higher charge increases the competition between surface tension and Coulomb pressure. As expected, the dependence on the symmetry energy decreases with decreasing isospin/neutron excess. The ls+pair group of parameters does not impact in a meaningful way.
The MCCs with are shown in Fig. 5(b). The group correlation with LDM is dominant, and increases with ; in superheavy nuclei it becomes close to 100%. The symmetry energy becomes more important for heavy systems with large isospin where the Coulomb repulsion determines the central depression. (The relevance of the symmetry energy for charge redistribution was pointed out within the finite-range droplet model in Refs. Myers and Swiatecki (1969); Möller et al. (1992).) Shell effects impact weakly for neutron rich nuclei (e.g., above 208Pb in the N=126 chain). A similar analysis for lighter nuclei 34Si and 48Ca (not shown in Fig. 5) indicates that the relative contributions from various groups rapidly change from one system to another. This, together with large systematic uncertainties for central densities in 34Si and 48Ca shown in Fig. 1, is indicative of shell-effect dominance on central density in the low- region.
VI Conclusions
We carried out systematic DFT analysis of the central depression in nucleonic densities in light and heavy nuclei. To study systematic trends of various observables related to internal density we employed statistical tools of linear regression. By inspecting the coefficients of determination and multiple correlation coefficients we conclude that the central depression of proton density in heavy nuclei is predominantly driven by the LDM parameters. Therein, the origin of central depression – resulting in semi-bubble density distributions in superheavy systems – is the electrostatic repulsion. On the other hand, the central depression appearing in density distributions of lighter nuclei such as 34Si has its origin in shell effects associated with occupations of -orbits.
The correlation analysis reveals that the central density indicators in nuclei below 208Pb and especially in 34Si carry no information on nuclear matter parameters. On the other hand, in the superheavy nuclei, which are closer to the leptodermous limit Reinhard et al. (2006), there is a clear relationship between central densities and the symmetry energy.
Acknowledgements.
This work was supported by the U.S. Department of Energy, Office of Science under Award Numbers DOE-DE-NA0002847 (the Stewardship Science Academic Alliances program), DE-SC0013365 (Michigan State University), and DE-SC0008511 (NUCLEI SciDAC-3 collaboration). An award of computer time was provided by the Institute for Cyber-Enabled Research at Michigan State University.References
- Wilson (1946) H. A. Wilson, Phys. Rev. 69, 538 (1946).
- Davies et al. (1972) K. Davies, C. Wong, and S. Krieger, Phys. Lett. B 41, 455 (1972).
- Campi and Sprung (1973) X. Campi and D. Sprung, Phys. Lett. B 46, 291 (1973).
- Myers and Swiatecki (1969) W. Myers and W. Swiatecki, Ann. Phys. 55, 395 (1969).
- Friedrich et al. (1986) J. Friedrich, N. Voegler, and P. G. Reinhard, Nucl. Phys. A 459, 10 (1986).
- Möller et al. (1992) P. Möller, J. Nix, W. D. Myers, and W. J. Swiatecki, Nucl. Phys. A 536, 61 (1992).
- Moretto et al. (1996) L. G. Moretto, K. Tso, and G. J. Wozniak, Phys. Rev. Lett. 78, 824 (1996).
- Royer et al. (1996) G. Royer, F. Haddad, and B. Jouault, Nucl. Phys. A 605, 403 (1996).
- Dietrich and Pomorski (1998) K. Dietrich and K. Pomorski, Phys. Rev. Lett. 80, 37 (1998).
- Dechargé et al. (1999) J. Dechargé, J.-F. Berger, K. Dietrich, and M. Weiss, Phys. Lett. B 451, 275 (1999).
- Bender (1999) M. Bender, Phys. Rev. C 60, 34304 (1999).
- Berger et al. (2001) J.-F. Berger, L. Bitaud, J. Dechargé, M. Girod, and K. Dietrich, Nucl. Phys. A 685, 1 (2001).
- Nazarewicz et al. (2002) W. Nazarewicz, M. Bender, S. Ćwiok, P. Heenen, A. Kruppa, P.-G. Reinhard, and T. Vertse, Nucl. Phys. A 701, 165 (2002).
- Dechargé et al. (2003) J. Dechargé, J. F. Berger, M. Girod, and K. Dietrich, Nucl. Phys. A 716, 55 (2003).
- Afanasjev and Frauendorf (2005) A. V. Afanasjev and S. Frauendorf, Phys. Rev. C 71, 024308 (2005).
- Pei et al. (2005) J. C. Pei, F. R. Xu, and P. D. Stevenson, Phys. Rev. C 71, 034302 (2005).
- Roca-Maza et al. (2013) X. Roca-Maza, M. Centelles, F. Salvat, and X. Viñas, Phy. Rev. C 87, 014304 (2013).
- Mehta et al. (2015) M. S. Mehta, H. Kaur, B. Kumar, and S. K. Patra, Phys. Rev. C 92, 054305 (2015).
- Todd-Rutel et al. (2004) B. G. Todd-Rutel, J. Piekarewicz, and P. D. Cottle, Phys. Rev. C 69, 021301 (2004).
- Grasso et al. (2007) M. Grasso, Z. Y. Ma, E. Khan, J. Margueron, and N. V. Giai, Phys. Rev. C 76, 044319 (2007).
- Khan et al. (2008) E. Khan, M. Grasso, J. Margueron, and N. V. Giai, Nucl. Phys. A 800, 37 (2008).
- Grasso et al. (2009) M. Grasso, L. Gaudefroy, E. Khan, T. Nikšić, J. Piekarewicz, O. Sorlin, N. V. Giai, and D. Vretenar, Phys. Rev. C 79, 034318 (2009).
- Chu et al. (2010) Y. Chu, Z. Ren, Z. Wang, and T. Dong, Phys. Rev. C 82, 024320 (2010).
- Wang et al. (2011) Y. Z. Wang, J. Z. Gu, X. Z. Zhang, and J. M. Dong, Phys. Rev. C 84, 044333 (2011).
- Yan-Zhao et al. (2011) W. Yan-Zhao, G. Jian-Zhong, Z. Xi-Zhen, and D. Jian-Min, Chin. Phys. Lett. 28, 102101 (2011).
- Liu et al. (2012) J. Liu, Y.-Y. Chu, Z.-Z. Ren, and Z.-J. Wang, Chin. Phys. C 36, 48 (2012).
- Yao et al. (2012) J.-M. Yao, S. Baroni, M. Bender, and P.-H. Heenen, Phys. Rev. C 86, 014310 (2012).
- Nakada et al. (2013) H. Nakada, K. Sugiura, and J. Margueron, Phys. Rev. C 87, 067305 (2013).
- Meucci et al. (2014) A. Meucci, M. Vorabbi, C. Giusti, F. D. Pacati, and P. Finelli, Phys Rev. C 89, 034604 (2014).
- Wang et al. (2015) Y. Z. Wang, Z. Y. Hou, Q. L. Zhang, R. L. Tian, and J. Z. Gu, Phys. Rev. C 91, 017302 (2015).
- Li et al. (2016) J. J. Li, W. H. Long, J. L. Song, and Q. Zhao, Phys. Rev. C 93, 054312 (2016).
- Duguet et al. (2017) T. Duguet, V. Somà, S. Lecluse, C. Barbieri, and P. Navrátil, Phys. Rev. C 95, 034319 (2017).
- Mutschler et al. (2016) A. Mutschler, A. Lemasson, O. Sorlin, D. Bazin, C. Borcea, R. Borcea, Z. Dombrádi, J.-P. Ebran, A. Gade, H. Iwasaki, E. Khan, A. Lepailleur, F. Recchia, T. Roger, F. Rotaru, D. Sohler, M. Stanoiu, S. R. Stroberg, J. A. Tostevin, M. Vandebrouck, D. Weisshaar, and K. Wimmer, Nature Phys. 13, 152 (2016).
- Siemens and Bethe (1967) P. J. Siemens and H. A. Bethe, Phys. Rev. Lett. 18, 704 (1967).
- Wong (1972) C. Wong, Phys. Lett. B 41, 446 (1972).
- Wong (1985) C.-Y. Wong, Phys. Rev. Lett. 55, 1973 (1985).
- Wong (1973) C. Wong, Ann. Phys. 77, 279 (1973).
- Wong et al. (1977) C. Wong, J. Maruhn, and T. Welton, Phys. Lett. B 66, 19 (1977).
- Warda (2008) M. Warda, Int. J. Mod. Phys. E 16, 452 (2008).
- Viñas et al. (2008) X. Viñas, M. Centelles, and M. Warda, Int. J. Mod. Phys. E 17, 177 (2008).
- Jachimowicz et al. (2011) P. Jachimowicz, M. Kowal, and J. Skalski, Phys. Rev. C 83, 054302 (2011).
- Staszczak et al. (2017) A. Staszczak, C.-Y. Wong, and A. Kosior, Phys. Rev. C 95, 054315 (2017).
- Borderie et al. (1993a) B. Borderie, B. Remaud, M. Rivet, and F. Sebille, Phys. Lett. B 302, 15 (1993a).
- Borderie et al. (1993b) B. Borderie, B. Remaud, M. Rivet, and F. Sebille, Phys. Lett. B 307, 404 (1993b).
- Bauer et al. (1992) W. Bauer, G. F. Bertsch, and H. Schulz, Phys. Rev. Lett. 69, 1888 (1992).
- Xu et al. (1994) H. M. Xu, C. A. Gagliardi, R. E. Tribble, and C. Y. Wong, Phys. Rev. C 49, R1778 (1994).
- Horowitz and Shen (2008) C. J. Horowitz and G. Shen, Phys. Rev. C 78, 015801 (2008).
- Wu et al. (2014) X. Y. Wu, J. M. Yao, and Z. P. Li, Phys. Rev. C 89, 017304 (2014).
- Shukla and Åberg (2014) A. Shukla and S. Åberg, Phys. Rev. C 89, 014329 (2014).
- Friedrich and Vögler (1982) J. Friedrich and N. Vögler, Nucl. Phys. A 373, 192 (1982).
- Bender et al. (2003) M. Bender, P.-H. Heenen, and P.-G. Reinhard, Rev. Mod. Phys. 75, 121 (2003).
- Klüpfel et al. (2009) P. Klüpfel, P. G. Reinhard, T. J. Bürvenich, and J. A. Maruhn, Phys. Rev. C 79, 034310 (2009).
- Chabanat et al. (1998) E. Chabanat, P. Bonche, P. Haensel, J. Meyer, and R. Schaeffer, Nucl. Phys. A 635, 231 (1998).
- Kortelainen et al. (2012) M. Kortelainen, J. McDonnell, W. Nazarewicz, P.-G. Reinhard, J. Sarich, N. Schunck, M. V. Stoitsov, and S. M. Wild, Phys. Rev. C 85, 024304 (2012).
- Bonche et al. (1985) P. Bonche, H. Flocard, P.-H. Heenen, S. J. Krieger, and M. S. Weiss, Nucl. Phys. A 443, 39 (1985).
- Krieger et al. (1990) S. J. Krieger, P. Bonche, H. Flocard, P. Quentin, and M. S. Weiss, Nucl. Phys. A 517, 275 (1990).
- Bender et al. (2000) M. Bender, K. Rutz, P.-G. Reinhard, and J. A. Maruhn, Eur. Phys. J. A 8, 59 (2000).
- Dobaczewski et al. (2014) J. Dobaczewski, W. Nazarewicz, and P.-G. Reinhard, J. Phys. G 41, 074001 (2014).
- Glantz et al. (1990) S. A. Glantz, B. K. Slinker, and T. B. Neilands, Primer of Applied Regression & Analysis of Variance (McGraw Hill, 1990).
- Reinhard (2016) P.-G. Reinhard, Phys. Scr. 91, 023002 (2016).
- Allison (1998) P. D. Allison, Multiple Regression: A Primer (Sage Publications, 1998).
- Oganessian et al. (2006) Y. T. Oganessian et al., Phys. Rev. C 74, 044602 (2006).
- Ćwiok et al. (2005) S. Ćwiok, P. H. Heenen, and W. Nazarewicz, Nature 433, 705 (2005).
- Heenen et al. (2015) P.-H. Heenen, J. Skalski, A. Staszczak, and D. Vretenar, Nucl. Phys. A 944, 415 (2015).
- Kortelainen et al. (2010) M. Kortelainen, T. Lesinski, J. Moré, W. Nazarewicz, J. Sarich, N. Schunck, M. V. Stoitsov, and S. Wild, Phys. Rev. C 82, 024313 (2010).
- Reinhard et al. (2006) P.-G. Reinhard, M. Bender, W. Nazarewicz, and T. Vertse, Phys. Rev. C 73, 014309 (2006).