Stellar dynamics in the strong-lensing central galaxy of Abell 1201: A low stellar mass-to-light ratio, a large central compact mass, and a standard dark matter halo††thanks: Based on observations collected at the European Organisation for Astronomical Research in the Southern Hemisphere under ESO programme 094.B-0823(A).††thanks: Based on observations made with the NASA/ESA Hubble Space Telescope, obtained from the Data Archive at the Space Telescope Science Institute, which is operated by the Association of Universities for Research in Astronomy, Inc., under NASA contract NAS 5-26555. These observations are associated with program 08719.
Abstract
We analyse the stellar kinematics of the = 0.169 brightest cluster galaxy (BCG) in Abell 120, using integral field observations with VLT/MUSE. This galaxy has a gravitationally-lensed arc located at unusually small radius (5 kpc), allowing us to constrain the mass distribution using lensing and stellar dynamical information over the same radial range. We measure a velocity dispersion profile which is nearly flat at 285 km s-1 in the inner 5 kpc, and then rises steadily to 360 km s-1 at 30 kpc. We analyse the kinematics using axisymmetric Jeans models, finding that the data require both a significant dark matter halo (to fit the rising outer profile) and a compact central component, with mass 2.5 1010 M⊙ (to fit the flat in the inner regions). The latter component could represent a super-massive black hole, in which case it would be among the largest known to date. Alternatively could describe excess mass associated with a gradient in the stellar mass-to-light ratio. Imposing a standard NFW dark matter density profile, we recover a stellar mass-to-light ratio which is consistent with a Milky-Way-like initial mass function (IMF). By anchoring the models using the lensing mass constraint, we break the degeneracy between and the inner slope of the dark matter profile, finding = 1.0 0.1, consistent with the NFW form. We show that our results are quite sensitive to the treatment of the central mass in the models. Neglecting biases the results towards both a heavier-than-Salpeter IMF and a shallower-than-NFW dark matter slope ( 0.5).
keywords:
gravitational lensing: strong – galaxies: elliptical and lenticular, cD – galaxies: clusters: individual: Abell 1201 – galaxies: kinematics and dynamics1 Introduction
Cosmological simulations generically predict that, in the absence of baryons, cold dark matter halos have a universal density profile with in the central regions e.g. the “NFW” halo of Navarro, Frenk & White 1996. Deviations from this profile could result from either the influence of non-standard dark matter physics e.g. self-interacting particles lead to density distributions with a central core, Spergel & Steinhardt 2000, or a modification of halos by interaction with the baryonic components e.g. “adiabatic contraction”, Blumenthal et al. 1986, or a combination of both. Hence obtaining observational limits on the dark matter profile slope can address several important issues relevant to galaxy formation.
For the most massive halos, corresponding to rich galaxy clusters, gravitational lensing and stellar dynamical data have been exploited to attempt to measure the inner slope of the density profile. In an influential study, Sand et al. (2004) inferred a shallow inner profile with 0.5, for three clusters with radial arcs. More recently, Newman et al. (2013a); Newman et al. (2013b) analysed an enlarged sample of seven clusters, with refinements to the modelling techniques, and reached a similar conclusion, with = 0.50 0.17 (including systematic errors). At face value these results exclude simple NFW halos ( = 1), and “contracted” NFW halos (with 1).
One of the key difficulties for this method is that the stellar mass of the brightest cluster galaxy (BCG) itself makes a significant, or even dominant, contribution to the mass in the innermost few-kpc region of the cluster. The BCG stellar mass-to-light ratio is usually treated as a (constant) free parameter in fitting profile models to lensing and dynamical data, and the degeneracy between and is a limiting factor in deriving the latter. The value of depends sensitively on the stellar initial mass function (IMF), the form of which is not securely established in massive early-type galaxies. Several studies, using independent methods, have found evidence for an IMF in massive ellipticals which is “heavier”111Either “bottom heavy” with an excess of low-mass stars (relative to solar-mass stars), or “top-heavy” with an excess of remnants (relative to solar-mass stars). (by up to a factor of two) than that of the Milky Way at given age and metallicity e.g. Treu et al. 2010; Conroy & van Dokkum 2012; Cappellari et al. 2012. However, it is possible that important systematics persist in these analyses (Smith, 2014). For example, for some very massive ellipticals, elevated mass-to-light ratios are firmly excluded by strong lensing constraints, despite these same galaxies having spectroscopic signatures which can only be fit with bottom-heavy IMFs (Newman et al., 2016). Until such discrepancies are resolved, the stellar population information cannot be confidently used to break the degeneracy with the halo profile.
In the clusters studied by Newman et al. (2013a); Newman et al. (2013b), the strong lensing constraints on the mass models are usually derived from much larger radius than can be probed by the stellar kinematics. Combining information from the different methods in different radial regimes provides leverage over a wide range of physical scales, but these configurations preclude using the two probes to test assumptions inherent to the methods, or to break the degeneracy between and , at least for individual clusters (e.g. see figure 1 of Newman et al. 2013b). The = 0.169 cluster Abell 1201 offers a rare opportunity to apply this method in an instance where lensing and dynamical constraints overlap in radial scale. Abell 1201 is a post-merger cluster (Owers et al., 2009; Ma et al., 2012) with a virial mass estimated at = (3.9 0.1) M⊙ (for = 0.678) from the infall caustic fitting method by Rines et al. (2013). From Hubble Space Telescope imaging, Edge et al. (2003) discovered an unusual lensed arc around the BCG, at a radius of only 2 arcsec (6 kpc), which is well within the range amenable to stellar kinematic measurements.
In a previous paper Smith, Lucey & Edge 2017, hereafter Paper I, we presented new wide-field integral field unit (IFU) observations for the BCG of the = 0.169 cluster Abell 1201, focusing on constraints from strong lensing. Plausible mass distributions which reproduce the Edge et al. (2003) arc yield a mass of (34 1) 1010 M⊙, where the error reflects the spread among different models. We also showed that the presence of a faint inner counter-image to the bright arc requires the total mass profile to be least as steep as the observed luminosity profile. We proposed three interpretations of this result. The first possibility (a) is that stellar mass dominates the total profile. This would require a very high stellar mass-to-light ratio , implying an extremely heavy IMF, and essentially no dark matter within the region probed by lensing222Assuming the dark matter follows a shallower profile than stars on these scales.. A second model (b) invoked a steep internal gradient in , again probably due to the IMF, but not requiring such extreme deviations from the MW mass normalization. The third option (c) was to introduce a central black hole, in which case the required mass was estimated to be (1.3 0.6) 1010 M⊙, comparable to the largest black holes established from traditional methods.
In this paper, we exploit the same IFU data to measure the stellar kinematics of the Abell 1201 BCG, out to a radius of 30 kpc, and place dynamical limits on the relative mass contributions of stars and dark matter. Motivated by the additional central mass concentrations envisaged in models (b) and (c) from Paper I, we consider models with an extra dark mass at the centre, representing either a super-massive black hole or an enhanced population of dwarf stars or stellar remnants at small radius. We examine in particular how the introduction of the central mass component affects other inferences from the kinematics, especially with respect to the the stellar mass-to-light ratio and the dark matter profile slope.
The remainder of the paper follows a simple structure: Section 2 describes the data and presents the kinematic measurements, while Section 3 describes results from fitting increasingly complex dynamical models. Section 4 discusses our findings in relation to previous work, and brief conclusions are summarized in Section 5.
As in Paper I, we adopt relevant cosmological parameters from Planck Collaboration et al. (2016): = 0.678, = 0.308 and = 0.692. In this cosmology, the spatial scale at the redshift of Abell 1201 is 2.96 kpc arcsec-1.
2 Kinematic data
We observed the Abell 1201 BCG using the Multi-Unit Spectroscopic Explorer (MUSE) (Bacon et al., 2010) at the European Southern Observatory Very Large Telescope. The observations and data reduction processes were described in Paper I. Briefly, the relevant characteristics are: a uniform exposure time of 3.1 hours over a 4545 arcsec2 central field of view, good image quality (0.6 arcsec FWHM), and spectral coverage 4750–9350 Å, sampled at 1.25 Å pixel-1 with resolution 2.6 Å FWHM (at = 7000 Å).
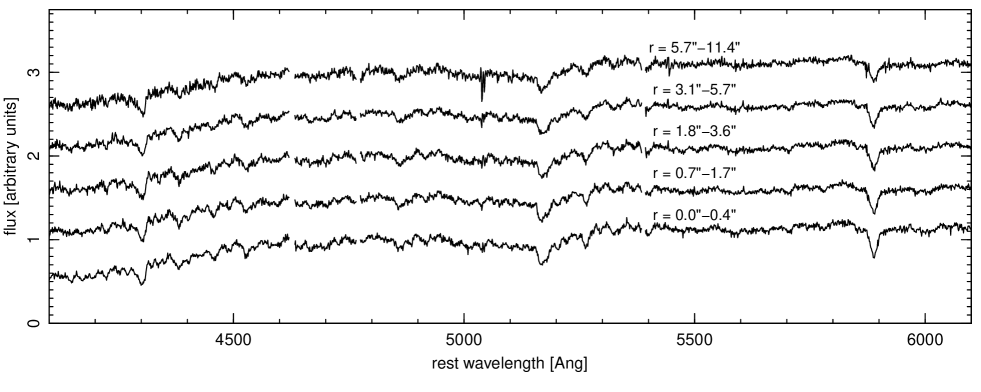
We follow the standard approach of defining compact spatial regions of approximately constant total signal-to-noise, using the Voronoi binning method of Cappellari & Copin (2003). The binning is performed after masking pixels affected by the bright lensed arc, or by other background galaxies projected close to the BCG, including the bright spiral at = 0.27. We also exclude all pixels below a signal-to-noise threshold of = 1 per spatial pixel, which limits our analysis to a semi-major axis of 10 arcsec or 30 kpc. The Voronoi bins are defined with a target of 50 (per 1.25 Å spectral pixel) at 5500 Å in the rest frame. Spectra from some representative spatial bins are shown in Figure 1.
We measure the mean velocity and velocity dispersion in each Voronoi bin using the penalised pixel fitting method, implemented in the ppxf software (Cappellari & Emsellem, 2004). For templates, we allow the code to combine stars of spectral type G5–K5 (giants and dwarfs) from the Indo-US spectral library (Valdes et al., 2004), which has a native resolution of 1 Å FWHM. We fit over a wavelength range of 4150–6150 Å in the rest-frame, excluding regions around the Mg triplet and the Na D lines, which are enhanced in giant elliptical galaxies, and poorly matched by the template stars. We also exclude narrow regions around sky emission lines, and regions affected by emission lines from the background galaxies. Errors are derived by Monte Carlo sampling the input spectra. (We have tested alternative spectral ranges and masking choices, and found our overall results to be robust against these details.)
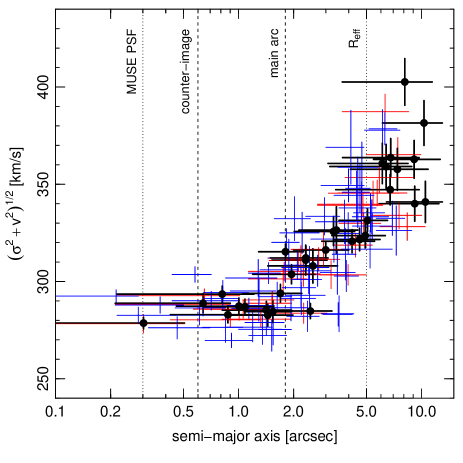
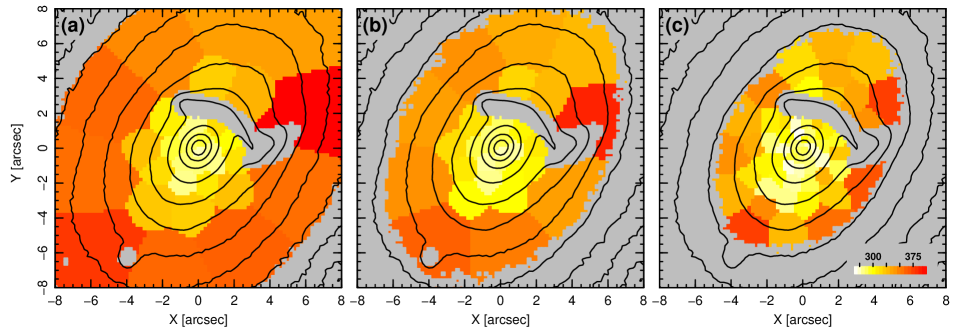
We find that the rotational velocities are negligible, so that the velocity second moment is dominated by the velocity dispersion; for brevity, we use as a shorthand for , and ‘velocity dispersion’ for ‘velocity second moment’ hereafter. The measured velocity dispersion profile is shown in Figure 2. The profile is approximately flat from the centre out to 2 arcsec, with 285 km s-1. In this region, our measurements overlap with those of Sand et al. (2004), who measured a significantly smaller velocity dispersion (230–250 km s-1 within 1.7 arcsec). Similar discrepancies with the Sand et al. measurements, for other clusters, have been reported by Newman et al. (2013a), who concluded that the earlier data were compromised by poor stellar templates and measurement procedures (see discussion in their section 6.4). Beyond 2 arcsec, the velocity dispersion increases rapidly to reach 360 km s-1 at 5–10 arcsec. Rising profiles of this type appear to be common among BCGs, as we discuss in Section 4. In two dimensions, the kinematic profile appears approximately to follow the surface-brightness contours (see Figure 3). The main features of the kinematic data are robust against changes to our Voronoi binning scheme, e.g. imposing higher threshold and/or binning to lower target (Figures 2 and 3b,c).
3 Dynamical modelling
We analyse the dynamics using the Jeans Axisymmetric Multi-Gaussian Expansion (JAM) method of Cappellari (2008), using the jam code distributed by the author. This method treats the mass distribution as a collection of oblate ellipsoidal gaussian density distributions333We note that some studies suggest that BCGs are more typically triaxial or prolate e.g. Fasano et al. 2010, but Jeans models have been applied to such galaxies in previous works e.g. Newman et al. 2013b, and they are a sensible first step before attempting more general but computationally intensive orbit-based methods., while the velocity dispersion ellipsoid is defined in cylindrical coordinates (), with = and vertical anisotropy = .
We describe the BCG using a multi-component mass model which, in its most general form, incorporates the stellar mass density (derived from the observed luminosity), a dark matter halo, and an additional central mass concentration. The following section describes the results of these fits in order of increasing complexity; we summarise the general features of the model here.
The stellar mass component is defined through a Multi-Gaussian Expansion (MGE) (Monnet, Bacon & Emsellem, 1992) fit to the projected luminosity, using the mge code of Cappellari (2002). For this analysis we use the Hubble Space Telescope (HST) WFPC2 (Wide Field and Planetary Camera 2) F606W observations acquired by Edge et al. (2003). The observed pixel fluxes were calibrated by reference to SDSS -band aperture photometry and corrected to physical units (L⊙ kpc-1), adopting a solar absolute magnitude of = 4.66 as used in Maraston (2005). A correction of 18 per cent is applied to account for the band-shifting effect, obtained from the -correction calculator of Chilingarian et al. (2010), using the colour from SDSS. The translation between luminosity and mass is described by a single stellar-mass-to-light ratio which is quoted in the rest-frame -band. We assume that the stellar component is viewed edge-on, since the apparent axial ratio is comparable to the most elliptical BCGs (Fasano et al., 2010). (Tests for the effects of inclination are summarized in Section 3.5.1).
The dark matter halo is assumed to be spherical for our default models (but see Section 3.5.3 for the results with elliptical halos), with a density profile following the generalized NFW (gNFW) form:
The break radius is fixed at = 300 kpc in all of our models, corresponding to concentration = 5 and 1.5 Mpc from Rines et al. (2013). The profile break is well beyond the regime probed by the dynamical data, and our observations cannot constrain , but are in principle sensitive to the asymptotic inner slope , which is unity for the standard NFW halo.
Additionally, we include an unresolved central mass concentration, treated as an extra gaussian, with very small scale radius, in the MGE. This component could represent a true super-massive black hole, but could also represent stellar mass not reflected in the luminosity distribution, e.g. due to an increasingly heavy IMF towards the galaxy centre (Martín-Navarro et al., 2015; van Dokkum et al., 2017).
We explore the parameter space of these dynamical models using the emcee code by Foreman-Mackey et al. (2013), which implements the ensemble Markov Chain Monte Carlo (MCMC) sampling technique of Goodman & Weare (2010). We use 128 “walkers”, each making 1000 samples, after a 100-step burn-in. At each step of the MCMC chains, we use jam to predict the second velocity moment, , at the observed pixels, convolved with the seeing of our MUSE data. We assign the pixels to the same Voronoi bins as in the observations, and compute the luminosity-weighted average kinematics in each bin. Comparing these predictions to the observed values yields the data likelihood for the current parameters of the sampler.
The lensing models in Paper I provide a robust estimate for the total (dark and luminous) mass projected within an aperture of radius 4.75 kpc. Hence, to facilitate comparison to, and combination with, the lensing information, we describe the model normalisation using a projected mass, , defined at this radius. Most of the models in this paper are independent of the lensing mass. However, in some cases (in particular when attempting to constrain the halo profile slope ), we incorporate lensing information in a simple way, by multiplying the likelihood by a prior probability for . For the prior, we adopt gaussian of mean 34 1010 M⊙, and standard deviation 1 1010 M⊙; this distribution adequately encloses the estimates derived from all of the plausible models from Paper I.
The results of fitting models within this family are described in Sections 3.1–3.4; we explore some model variations beyond this framework in Section 3.5.
| Model | /dof | ||||||||
| 1 | Stars only | 39.00.4 | 0.080.02 | 838.9 / 30 | 863.9 | ||||
| 2 | NFW+Stars | 35.80.5 | 6.70.2 | 0.200.02 | [1.0] | 0.360.02 | 277.2 / 29 | 280.4 | |
| 3 | NFW+Stars+ | 34.60.5 | 3.90.3 | 2.50.2 | 0.210.02 | [1.0] | 0.540.02 | 130.0 / 28 | 130.4 |
| 4 | gNFW+Stars | 47.11.4 | 8.10.2 | 0.180.02 | 0.070.05 | 0.420.02 | 198.1 / 28 | 369.7 | |
| 5 | gNFW+Stars+ | 39.25.0 | 5.91.1 | 1.90.4 | 0.190.03 | 0.580.36 | 0.460.03 | 125.7 / 27 | 152.7 |
| 6 | gNFW+Stars+ | 34.40.9⋆ | 3.90.8 | 2.50.3 | 0.220.02 | 1.010.12 | 0.550.06 | 129.8 / 27 | 130.0 |
| 7 | gNFW+Stars | 38.30.7⋆ | 7.30.2 | 0.230.02 | 0.550.07 | 0.350.01 | 230.0 / 28 | 248.5 |
3.1 A mass-follows-light model
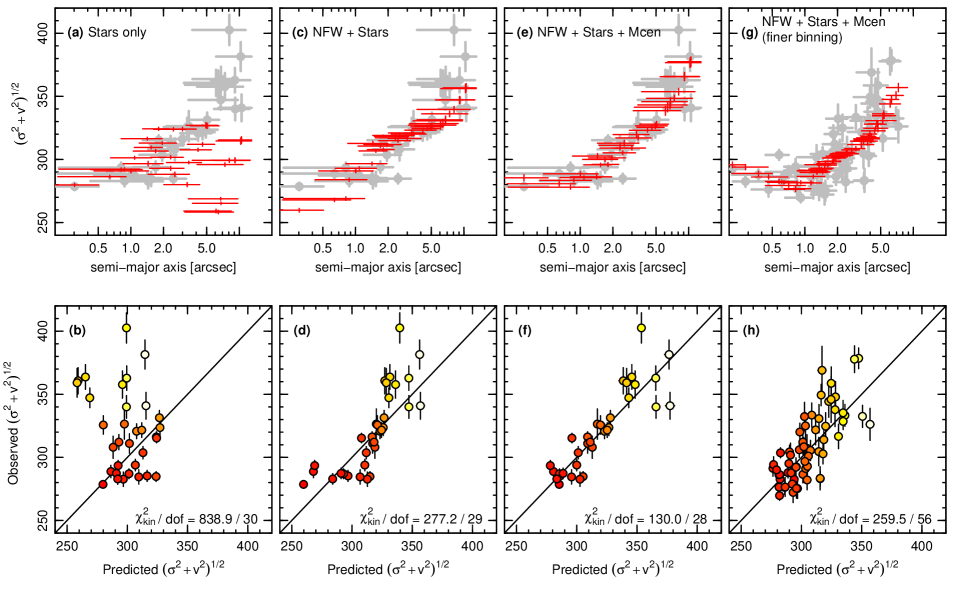
We begin with the simplest possible model, in which all gravitating mass is described by the MGE fit to the luminosity profile, and the only free parameters are the projected aperture mass , setting the normalisation, and the orbital anisotropy parameter, . The best-fitting solution is reported in line 1 of Table 1. The recovered value of translates to a mass-to-light ratio of 11.5 0.1, which in this case should be interpreted as a total , including any dark matter component as well as stars. Given the steeply-rising velocity dispersion profile, it is not surprising to find that the mass-follows-light model fails badly to match the observations, in particular under-predicting at large radius (Figure 4a,b). The model also yields an aperture mass of (39.0 0.4) 1010 M⊙ which is inconsistent with the lensing constraint at the 5 level.
3.2 Constant- stars and NFW halo
We now introduce an extended dark matter component, assuming a spherical halo that follows the NFW density profile. This model is parametrized by , , and , the latter being explicitly the stellar mass-to-light ratio.
For a given age and metallicity of the stellar population, the derived value of provides an integral constraint on the IMF, since an excess of low-mass stars (or stellar remnants) leads to increased mass, without strongly affecting the luminosity. This constraint is often described through the mass excess factor = /, where is the expected stellar mass-to-light ratio given some fiducial IMF. For the Abell 1201 BCG, we compute an indicative value of from the Maraston (2005) models, adopting an IMF similar to that in the Milky Way. For the metallicity, we use the MUSE spectra inside the lensing aperture to measure the [MgFe]′ composite index, apply suitable corrections for velocity broadening, and compare to the model predictions of Thomas, Maraston & Johansson (2011). This method indicates a metallicity of [Z/H] = 0.28 0.05. The observed spectrum has low H absorption, consistent with old stellar ages and there is no other evidence for recent or ongoing star-formation in the BCG (no H, no dust features, etc). Since the spectrum does not constrain the age very tightly, we simply assume formation at early epochs (2.5 4.0) (corresponding to age 9.5 0.5 Gyr). Combined with the estimated metallicity and the Kroupa (2001) IMF, this yields = 3.4 0.2.
The best-fitting parameters for the NFW+Stars model are given in line 2 of Table 1. The fit attributes a relatively small fraction of the lensing-aperture mass to dark matter ( = 0.36), and the stellar mass-to-light ratio is correspondingly high ( = 6.7 0.2). Adopting from above, this implies = 1.98 0.13, indicating substantial deviation from a MW-like IMF. For comparison, a Salpeter IMF444A single power-law IMF with the Salpeter (1955) exponent of 2.35, extrapolated down to 0.1 M⊙. has = 1.55. The derived anisotropy parameter is mildly positive, indicating a slight flattening of the velocity dispersion ellipsoid parallel to the symmetry axis, which is typical for early-type galaxies (Cappellari et al., 2007).
Figure 4c,d shows, however, that this model is still a poor fit to the measured kinematics, not only in having a large value of overall (277 on 29 degrees of freedom), but also in exhibiting clear systematic discrepancies as a function of radius. In particular, the central velocity dispersion is under-predicted by 20 km s-1, and is also under-predicted in the outermost bins, by 30 km s-1. There is clearly a tension in this model between matching the steeply rising profile at large radius, which requires large , and accounting for the high central , which favours larger stellar contributions.
3.3 Models with an additional central mass
In Paper I, we showed that the faint inner counter-image to the main arc could be reproduced in simple lensing models only if the total mass profile was at least as steep as the observed luminosity profile. As shown in the previous sections, our kinematic data clearly require an extended dark matter component, to account for the rising profile, but the inclusion of dark matter acts to flatten the total mass profile, rather than to steepen it. Hence to reproduce the counter-image, an additional contribution of centrally-concentrated mass seems to be required. In Paper I we considered the effects of either an extremely massive central black hole, or additional stellar mass associated with a heavier IMF towards the galaxy centre. In either case, the additional mass was (1–4)1010 M⊙.
Motivated by the lensing results, and by the poor fit of the NFW+Stars model to the kinematics, we now introduce an additional central mass component into the dynamical fits. We parametrize this as an unresolved mass555We consider non-point central components in Section 3.5.2., and refer to it as , to emphasise that this does not necessarily refer to a true black hole.
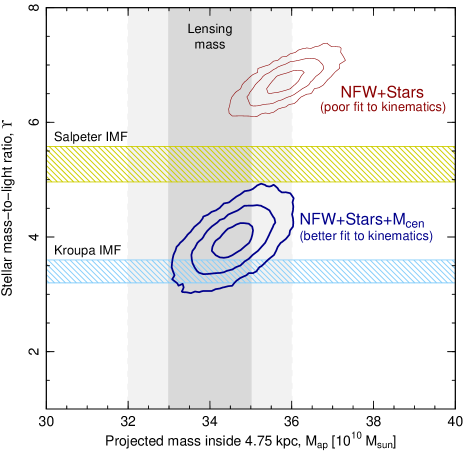
Figure 4e,f confirms that the model with a central mass produces a much better match to the measured velocity dispersion profile. While the overall remains rather large (130 on 28 degrees of freedom), the systematic discrepancies as a function of radius are much reduced. The introduction of resolves the tension between the solutions preferred at large and small radii, and allows the other two components to adjust for improved balance between dark matter and stellar mass. Line 3 of Table 1 reports the parameters of this fit. The recovered stellar mass-to-light ratio is now = 3.9 0.3. which is marginally consistent with the value expected for a MW-like IMF, and significantly lighter than expected for a Salpeter IMF. (For our adopted , the mass excess factor is = 1.15 0.11.) Dark matter accounts for a correspondingly larger fraction of the mass inside the fiducial aperture ( = 0.54). The recovered central mass is = (2.5 0.2) 1010 M⊙, consistent with the overall range inferred from lens modelling in Paper I666But 2 larger than the lensing model which specifically assumes a point-mass, i.e. a true black hole, where we found = (1.3 0.6) 1010 M⊙.. The total mass projected inside 4.75 kpc is = (34.6 0.5) 1010 M⊙, in exquisite agreement with the (independent) lensing-derived mass of = (34 1.0) 1010 M⊙. The joint constraints on and from the models with and without are shown in Figure 5, which highlights the dramatic effect of the central mass on the inferred IMF.
Note that if we treat the central mass as a consequence of gradients in , rather than a black hole, it is appropriate to include its mass as part of the stellar component when quoting the stellar mass-to-light ratio. In this case, the aperture-integrated value (inside the fiducial radius of 4.75 kpc) is = = 4.7, which is closer to the Salpeter IMF value, though still much lower than in the NFW+Stars model. This result emphasises that the reduction in is caused mainly by altering the trade-off between stars and dark matter, rather than directly by itself, which contributes only 7 per cent of the lensing mass.
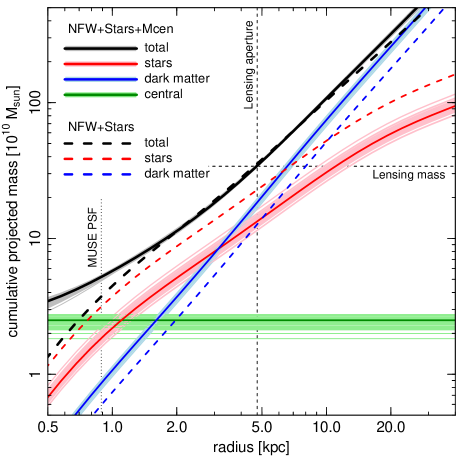
Figure 6 shows the cumulative projected mass profile of our best-fitting model, decomposed into the three dynamical components, , stars and dark matter. Comparing to the equivalent curves for the NFW+Stars model shows that the total profiles coincide closely over a decade span in radius (1.5–15 kpc), but the composition of the mass differs markedly between the two models. The NFW+Stars model is dominated by stars within 10 kpc, and by dark matter at larger radius. In the model with , the central component dominates within 1.2 kpc, and dark matter dominates beyond 3 kpc, with stars being the major component in the intermediate range.
We conclude that when limited to NFW ( = 1) dark matter halos, the data require the presence of a central compact mass component, and accounting for this mass in the dynamical model has an important impact on the recovery of the other physical parameters, in particular .
3.4 Models with a generalised NFW halo
Finally, we explore models with dark matter following the gNFW profile, with the inner logarithmic density slope as an additional free parameter.
In the absence of an additional central mass concentration, the gNFW model reaches a best match to the kinematic data by flattening the dark matter component completely, and boosting the contribution of stars to increase at small radius. The resulting fit (line 4 of Table 1) has a high stellar mass-to-light ratio, 8, and a very large projected aperture mass of 47 1010 M⊙. Hence although the for the kinematics is improved compared to the NFW+Stars case, this is achieved at the cost of an unacceptable (10) discrepancy with respect to the lensing constraint.
As in the case for NFW halos, including a compact central mass leads to a non-trivial readjustment of the other model components (line 5 of Table 1). The observed kinematics are consistent with a wide range in , though shallower-than-NFW slopes are mildly preferred ( = 0.60 0.36). As before, introducing favours models with a reduced stellar mass and more dark matter within the fiducial aperture. However, the gNFW model constraints are quite degenerate: shallower halo profiles can be accommodated for higher and lower . This degeneracy with translates into increased marginalised errors on the other parameters, e.g. = 5.9 1.2, which is consistent with any plausible IMF (e.g. 1.0 2.5 at 2 ).
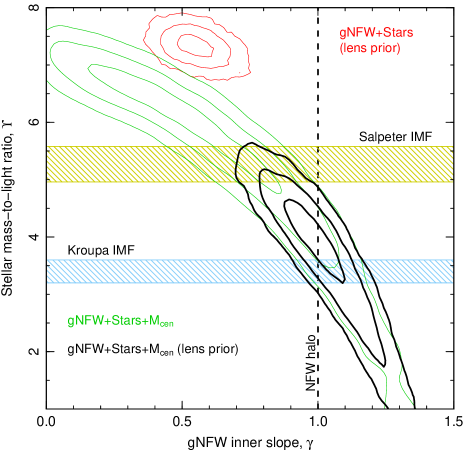
Along the locus of degenerate models, the low- solutions imply a larger total mass within the fiducial aperture. Hence, we can obtain tighter constraints by explicitly imposing the prior from the lensing configuration, with = (34 1) 1010 M⊙. The derived parameters for this case are reported in line 6 of Table 1. As expected, given the degeneracies with , the lensing prior favours models with steeper halo profiles, and its inclusion improves the precision on (see Figure 7). The combined lensing and dynamical constraint is consistent with the standard NFW form: = 1.01 0.12. Using the lensing prior also improves the limits on the stellar mass-to-light ratio, to = 3.9 0.8, but this remains compatible with either a Kroupa or Salpeter IMF ( = 1.15 0.25). As before, attributing all of the excess mass to the stars, instead of to a black hole, would increase this estimate (integrated within the fiducial aperture) by 20 per cent. Because the gNFW+Stars+ model returns 1, when including the lensing prior, the predicted kinematics are effectively identical to those of the NFW+Stars+ case shown in Figure 4e,f.
For comparison, we also considered a gNFW-halo model incorporating the lensing prior but without the central mass component. In this case, there is clear tension between the prior and the dynamical information, resulting in a best fit which still exceeds the lensing constraint by 4 , while the fit to the kinematics is also poor, similar to the equivalent NFW fit without . The derived mass-to-light ratio is 7.3 (somewhat above expectations for a Salpeter IMF), while the preferred halo slope is much flatter than NFW, = 0.55 0.07 (Table 1, line 7).
We conclude that in the Abell 1201 BCG, the need for any deviation from an NFW profile is strongly affected by the inclusion or otherwise of a central mass component. When the central mass is neglected, we recover a solution with a heavy IMF and a flattened halo profile, similar to the results of Newman et al. (2013b) for more distant and more massive clusters. By contrast, when allowing for the presence of a compact component, comparable in mass to the largest-known central black holes, our results favour an orthodox dark matter halo, and are also consistent with a standard, MW-like IMF.
3.5 Additional models and robustness tests
In this section we briefly explore some variants on the fitting method, testing for robustness to some of the assumptions made above.
3.5.1 Non-edge-on inclination?
The default models assumed an edge-on configuration, = 90∘ (i.e. the shortest axis of the oblate ellipsoids are perpendicular to the line of sight), but the MGE description for the stellar mass is consistent with inclinations as low as = 68∘. (The limit arises from the highest-ellipticity gaussian in the fit to the projected luminosity.) Allowing inclination as a free parameter we find (a) that high inclinations ( 80∘) are somewhat favoured, and (b) that none of the parameters of interest to us has significant covariance with . Hence, no information is lost by neglecting inclination as a parameter in the models discussed so far.
3.5.2 Non-point mass central concentrations?
In our default fits, the central mass component is modelled using a gaussian with very small radius, = 0.01 arcsec (standard deviation). While this may be appropriate if represents a true black hole, if the extra mass is instead due to stellar population gradients, a more extended distribution might be more suitable.
We have considered alternative models in which is allowed to vary up to a maximum of 2 arcsec (6 kpc) (but this component is always spherical.) The additional freedom in this case leads to stronger degeneracies between and , since the model can trade mass between the stars and the extended “extra” component, which can now have more similar spatial scales.
Formally, point-mass contributions are disfavoured by the fits, but the recovered sizes remain very small, and comparable to the resolution of the kinematic data: = 0.22 0.05 arcsec (i.e. 0.5 arcsec FWHM). The mass attributed to the extra component is much larger than in the point-mass case, but the component following the light is correspondingly reduced. Adding both components to describe the total stellar mass yields an aperture-integrated stellar mass-to-light ratio of = 4.5 0.3, which is similar to the equivalent result for an unresolved central mass.
3.5.3 Non-spherical halo?
X-ray observations have shown that Abell 1201 has a complex morphology, with high ellipticity, cold fronts and an offset core. The overall configuration has been interpreted as indicating a late-stage merger aligned with the BCG major axis (Owers et al., 2009; Ma et al., 2012). It is unclear whether such features on 100 kpc scales should invalidate the assumption of a spherical halo on the 20 kpc scales probed by our data, but motivated by the X-ray information, we have experimented with including halo ellipticity as a free parameter in the dynamical model.
Formally, we find that the data do prefer very elliptical models, where the halo has an axial ratio of 0.4. In this case, we also find 0, with a very high dark matter fraction (70 per cent) and low stellar mass-to-light ratio 3 (or 4 if the central component is added to the stellar mass). Crucially, however, the elliptical halo model also yields a very high total mass within the fiducial aperture, 45 1010 M⊙, which is incompatible with the lensing analysis. In this model, the elliptical halo can trade off much more readily against the stellar mass distribution, and so the three components are shuffled to make small improvements in the fit to the kinematics, at the expense of severely over-predicting the lensing mass. Imposing the lensing prior (as for the gNFW model) to suppress these unacceptable solutions, we obtain best-fitting parameters that are similar to the spherical halo case ( = 3.5, = 2.7 1010 M⊙), and only a modestly flattened halo shape, 0.8.
3.5.4 Resolution test
Finally, as a test for robustness against the Voronoi binning assumptions, we have run our preferred NFW+stars+ model using the alternative spatial binning scheme shown in Figure 3c. Because a higher S/N threshold was used, the data in this case do not extend to the outermost pixels used in the default fits, but they do provide improved sampling in the inner regions.
The fit results for this case are broadly consistent with the default binning scheme, with a slightly increased central mass = (2.9 0.2) 1010 M⊙, and slightly increased normalization = (35.7 0.5) 1010 M⊙). The stellar mass-to-light ratio remains consistent with MW-like IMFs, = 4.1 0.3 ( = 1.20 0.12). The measured and predicted kinematics for this fit are shown in Figure 4g,h. As a result of the increased resolution in the inner bins, the central mass now generates a noticeable rise in at the smallest radii, rather than simply flattening the profile as in Figure 4a–f. This signature is seen in both the data and the model predictions.
4 Discussion
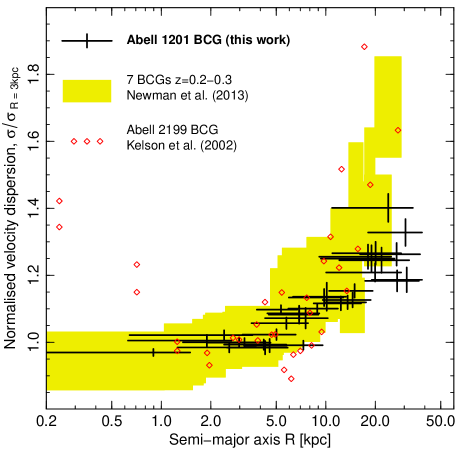
Our MUSE data have revealed a rising kinematic profile in the Abell 1201 BCG, with velocity dispersion increasing from 285 km s-1 inside 5 kpc to 360 km s-1 at 20 kpc. Such trends are not seen in nearby, lower-luminosity, early-type galaxies, where flat or falling profiles predominate e.g. Falcón-Barroso et al. 2017. In BCGs, by contrast, many previous works have found evidence for rising profiles in individual galaxies e.g. Dressler 1979, Carter, Bridges & Hau 1999, Kelson et al. 2002, Richtler et al. 2011. More recently, Newman et al. (2013a) found rising profiles in all seven BCGs in their sample at = 0.2–0.3, with an apparent homogeneity among the profiles after normalization at 3 kpc. Veale et al. (2017) also report rising trends for the most massive local ellipticals in their sample (most of which are cluster- or group-dominant galaxies), while less massive ellipticals show flat or falling profiles. Hence at an empirical level, the association of rising profiles with cluster-scale dark matter halos seems to be well established. Figure 8 shows that our measurements in Abell 1201 are similar to the profiles of the Newman et al. (2013a) BCGs, though the upturn at large radius is slightly less pronounced. The difference qualitatively accords with Abell 1201 being less massive than average for the Newman et al. clusters. As argued in Paper I, comparable contributions of dark and stellar material projected inside 4.75 kpc are compatible with dark matter halos extracted from cosmological simulations (Neto et al., 2007; Schaye et al., 2015) to mimic the properties of Abell 1201. Hence the observed profile can be generated with a halo mass which is quite plausible in the cosmological context.
Of the three explanations proposed in Paper I to account for the lensing counter-image, one requires the lensing mass to be fully dominated by the stars777Or by mass distributed just as steeply as the stellar component, unlike any plausible dark matter candidate., with a very high stellar mass-to-light ratio. The rising velocity dispersion profile measured here is inconsistent with this scenario, and translates directly into a need for substantial mass contributions from an extended dark matter halo. However, the resulting combined profile of dark and stellar mass is too shallow, in the inner 5 kpc, to reproduce the lensing configuration, in particular the inner counter-image. Hence with the “all-stellar” option ruled out on dynamical grounds, the lensing configuration alone already implies the presence of additional centrally-concentrated mass, in the form of either a black hole or a gradient in the stellar mass-to-light ratio.
Independently of the lensing analysis, our kinematic measurements reinforce the need for a compact central mass which is not reflected in the luminosity distribution in Abell 1201. The dynamically-derived = (2.5 0.2) 1010 M⊙ is 2 larger by than the lensing-inferred black-hole mass of (1.3 0.6) 1010 M⊙. If is really a black hole, its mass would be slightly larger than any in the van den Bosch (2016) compilation, as well as an order of magnitude higher than the average at the velocity dispersion of the Abell 1201 BCG. Over-massive black-holes in BCGs, compared to the standard scaling relations, have been proposed as a means to reconcile radio and X-ray properties of cluster cores (Hlavacek-Larrondo et al., 2012), and some local BCGs indeed have dynamical which exceed the relations by factors of 4–10 (McConnell et al., 2011). Our result for Abell 1201 could thus be interpreted as simply a more extreme example of a trend already hinted at in nearby, generally less massive, clusters.
If the Abell 1201 BCG really harbours such a large black hole, its low-level accretion activity might generate detectable radio and/or X-ray emission, as quantified in the “Black Hole Fundamental Plane” (Merloni, Heinz & di Matteo, 2003). Unfortunately only upper limits are available for the core of Abell 1201. The best current radio limit at 5 GHz is from Hogan et al. (2015), who quote a 3 upper limit which translates to a radio power of 1.41038 erg s-1. For the X-ray constraint, we estimate a limit on emission coincident with the core of the BCG, from two separate 40 ks Chandra observations, following Hlavacek-Larrondo & Fabian (2011). Assuming an unobscured power law with an index of –1.7, we derive a 3 upper limit to the unabsorbed 0.2–10 keV X-ray luminosity of 2.11040 erg s-1. Placing these limits on the Fundamental Plane, using the scaling relations from Merloni et al. (2003) or Plotkin et al. (2012), shows that Abell 1201 lies at the lower boundary of the distribution of BCGs with a joint radio and X-ray detection from the sample of Hlavacek-Larrondo et al. (2012). Therefore neither upper limit is inconsistent with the presence of such a high-mass black hole. Future Very Long Baseline Array observations could in principle improve on the current radio limit, e.g. by a factor of 15 for a full track, reaching a radio power of 1037 erg s-1. However, the X-ray luminosity predicted from the Fundamental Plane is 1038 erg s-1, comparable to the brightest accreting binaries in the galaxy (Kim & Fabbiano, 2004), which precludes obtaining an unambiguous matching detection.
If the central mass is not a black hole, the most natural explanation is that this component reflects an increased stellar mass-to-light ratio towards the BCG centre. Modest radial variations in could be caused by metallicity or age gradients, but as noted in Paper I, the spectra do not indicate strong gradients in the inner 2 arcsec. Hence a radial variation in the IMF is probably needed to generate the steep trend in implied by the lensing models. Some analyses of spectroscopic gradients in nearby ellipticals do support trends in the IMF within half the effective radius (0.5 ), e.g. Martín-Navarro et al. 2015, La Barbera et al. 2016, van Dokkum et al. 2017, but others have argued that the spectral signatures are consistent with metallicity gradients (McConnell, Lu & Mann, 2016; Alton, Smith & Lucey, 2017). For Abell 1201, the best-studied IMF-sensitive features are redshifted beyond the spectral range of our MUSE data, so we cannot currently address this question directly for this galaxy. As described in Section 3.5.2, our kinematic data seem to favour a compact central mass, in preference to a spatially extended component. At face value, this disfavours the IMF gradient solution. For example, figure 17 of van Dokkum et al. (2017) indicates an enhancement of the (aperture-integrated) mass-excess factor at a characteristic scale of 0.3 , corresponding to 5 kpc in the Abell 1201 BCG. This is an order of magnitude larger than the preferred scale recovered when we fit for as a free parameter.
Regardless of whether the central mass is actually a black hole or not, we have shown that its treatment in the dynamical model has important implications for other parameters determined from the stellar kinematics. In particular, including leads to a significant reduction in the stellar mass-to-light ratio, to values compatible with a Kroupa (Milky-Way-like) IMF, rather than requiring a heavier-than-Salpeter IMF as inferred if the central component is neglected. Likewise, allowing for a significant yields consistency with the NFW dark matter density profile, whereas fits neglecting the central mass required a significantly shallower profile.
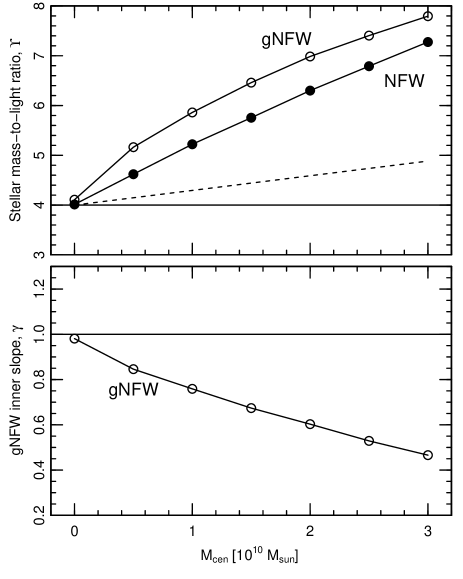
To investigate further this apparent source of bias, we have performed simple simulations using idealised kinematic data tuned to the case of Abell 1201, which capture the effects of neglecting a compact central mass component. For each simulation, we use jam generate a “true” velocity dispersion field from an input set of fixed model parameters ( = 34 1010 M⊙, = 1.0, = 4.0, and = 0.2), and a range of central masses up to 3 1010 M⊙. To derive the stellar mass component, we use the same MGE description of the luminosity density as employed in the main analysis. The kinematics are computed for the same spatial bins used for the real data. Subsequently, we fit these mock data with a two component (either NFW+Stars or gNFW+Stars) model, using the same machinery as applied to the real data. In doing so, we assign the bins the appropriate “errors” taken from the observed data, to ensure the correct relative weighting of the data points. Figure 9 shows the results of this analysis. The test confirms that if a compact central component is present, and is neglected in the fitting, this leads to a substantial overestimate of (by 60 per cent for = 2 1010 M⊙) and a severe underestimate of (recovering = 0.6 for = 2 1010 M⊙), if using the gNFW form for the halo. Note that the biases in and in the NFW+Stars fits are found even when fitting essentially perfect simulated data, differing only in the dynamical influence of the central mass. In turn this suggests that the similar sensitivity of the real results to the inclusion of does not somehow arise from the high of the fit to the observed velocity field, or from mismatches in spatial resolution, or other effects inherent to the observations.
Returning now to the context of previous work on BCGs, recall that Newman et al. (2013b) fitted a gNFW+Stars model to seven clusters at = 0.2–0.3, and found evidence for both a shallower halo slope 0.5 and typical stellar mass-to-light ratios characteristic of the Salpeter IMF. These conclusions are strikingly similar to the results we obtain for Abell 1201, when is omitted from the dynamical model. The Newman et al. BCGs are more distant on average, and they argued that central black holes should not be dynamically significant given the slit width and spatial resolution of their spectroscopy. This is probably a reasonable assumption for black holes at the mean of the local scaling relations, but its validity clearly depends on the maximum considered plausible. It is outside the scope of this paper to explore fully whether the neglect of central black holes might have contributed to the conclusions reached by Newman et al. A meaningful study would need to account for important differences in the data available for their work compared to ours. In particular, while our analysis benefits from the presence of a small-radius strong-lensing constraint in Abell 1201, Newman et al. were able to include weak-lensing shear profiles at 100 kpc, as well as strong-lensing constraints out to 50–100 kpc scales (a factor of ten larger than in Abell 1201), to anchor the outer dark matter profiles. The relative advantages afforded by these different configurations, and in particular their sensitivity to an additional central mass, are not trivial to establish.
A less obvious, but intriguing, comparison can be made with the results found by Yıldırım et al. (2016) from orbit-based dynamical models of the compact elliptical galaxy NGC 1281 in the Perseus cluster. At face value, this is a very different kind of galaxy than the massive and diffuse BCG in Abell 1201, but the authors report a qualitatively similar interplay between stars, dark matter and black hole in their modelling. As in Abell 1201, the chain of constraints is that the outer kinematics require large dark matter contributions at intermediate radius, which drives down the the stellar component, which in turn necessitates a massive central black hole to fit the central kinematics. In NGC 1281, the best-fitting parameters are arguably unreasonable (a much lighter-than-Kroupa IMF and an implausibly large halo-to-stellar mass ratio), and the authors were not able to account for the results within their modelling framework. While these findings should motivate caution in interpreting our results, we stress that in Abell 1201, by contrast, the derived parameters do appear physically plausible, despite requiring a central mass component at the limit of current estimates for black holes.
5 Conclusions
We have measured and analysed the spatially-resolved stellar kinematics for the strong-lensing BCG in Abell 1201. The large radial extent and high spatial resolution of our observations, combined with the unusual lensing configuration in this system, allow us to decouple three components of the mass distribution in the cluster: stars, dark matter, and an additional central mass, which could be a super-massive black hole.
Our models strongly favour the presence of a 1010 M⊙ compact central mass, a result which is independently supported by the lensing analysis (Paper I). The best-fitting central mass of (2.50.2) 1010 M⊙ is an order of magnitude higher than expected from the local – relation, and comparable to the largest black hole masses measured to date, some of which also reside in BCGs. As an alternative to a black hole, the central mass could be due to a strongly non-uniform stellar mass-to-light ratio, e.g. from a bottom-heavy IMF affecting only the innermost part of the galaxy.
Accounting explicitly for the central mass, we have highlighted the changes which follow in the other fitted components. For an NFW halo, the dark matter contribution increases (from 36 per cent inside the fiducial aperture to 54 per cent), and the stellar mass-to-light ratio is correspondingly reduced, from 6.7 to 3.9, when the central mass is included. For comparison, an IMF similar to that of the Milky Way (Kroupa, 2001) predicts a value of 3.4, given the high metallicity and probable early formation time of the BCG stellar population. Hence, including the central mass component in the model largely removes the need for a heavy IMF in this galaxy.
Finally, considering a gNFW dark matter density profile with a free inner slope , we find once again that the treatment of a compact central mass is crucial. When fitting the lensing and kinematic data using only the halo and stellar components, the models yield 0.5, similar to the results found by Newman et al. (2013b). By contrast, when we account for the presence of the central mass component, we infer = 1.0 0.1, i.e. no deviation from the standard NFW halo is required.
Future AO-assisted IFU data for the Abell 1201 BCG would add confidence to the detection of a very massive central black hole by better resolving its dynamical influence. Meanwhile, recently acquired HST observations with Wide Field Camera 3 will improve the characterisation of the inner luminosity profile, and yield improved depth, resolution and lens-vs-source contrast. A future paper will exploit these advances to present a refined lensing analysis of this system.
Acknowledgements
RJS, JRL & ACE acknowledge support from the STFC through grants ST/L00075X/1 and ST/P000541/1. The datasets used for this paper are publicly available from the ESO Science Archive Facility. We thank Michele Cappellari and collaborators for releasing and maintaining several software packages used in this paper.
References
- Alton et al. (2017) Alton P. D., Smith R. J., Lucey J. R., 2017, MNRAS, 468, 1594
- Bacon et al. (2010) Bacon R., et al., 2010, in Ground-based and Airborne Instrumentation for Astronomy III. p. 773508, doi:10.1117/12.856027
- Blumenthal et al. (1986) Blumenthal G. R., Faber S. M., Flores R., Primack J. R., 1986, ApJ, 301, 27
- Cappellari (2002) Cappellari M., 2002, MNRAS, 333, 400
- Cappellari (2008) Cappellari M., 2008, MNRAS, 390, 71
- Cappellari & Copin (2003) Cappellari M., Copin Y., 2003, MNRAS, 342, 345
- Cappellari & Emsellem (2004) Cappellari M., Emsellem E., 2004, PASP, 116, 138
- Cappellari et al. (2007) Cappellari M., et al., 2007, MNRAS, 379, 418
- Cappellari et al. (2012) Cappellari M., et al., 2012, Nature, 484, 485
- Carter et al. (1999) Carter D., Bridges T. J., Hau G. K. T., 1999, MNRAS, 307, 131
- Chilingarian et al. (2010) Chilingarian I. V., Melchior A.-L., Zolotukhin I. Y., 2010, MNRAS, 405, 1409
- Conroy & van Dokkum (2012) Conroy C., van Dokkum P. G., 2012, ApJ, 760, 71
- Dressler (1979) Dressler A., 1979, ApJ, 231, 659
- Edge et al. (2003) Edge A. C., Smith G. P., Sand D. J., Treu T., Ebeling H., Allen S. W., van Dokkum P. G., 2003, ApJ, 599, L69
- Falcón-Barroso et al. (2017) Falcón-Barroso J., et al., 2017, A&A, 597, A48
- Fasano et al. (2010) Fasano G., et al., 2010, MNRAS, 404, 1490
- Foreman-Mackey et al. (2013) Foreman-Mackey D., Hogg D. W., Lang D., Goodman J., 2013, PASP, 125, 306
- Goodman & Weare (2010) Goodman J., Weare J., 2010, Comm. App. Math. Comp. Sci., 5, 65
- Hlavacek-Larrondo & Fabian (2011) Hlavacek-Larrondo J., Fabian A. C., 2011, MNRAS, 413, 313
- Hlavacek-Larrondo et al. (2012) Hlavacek-Larrondo J., Fabian A. C., Edge A. C., Hogan M. T., 2012, MNRAS, 424, 224
- Hogan et al. (2015) Hogan M. T., et al., 2015, MNRAS, 453, 1201
- Kelson et al. (2002) Kelson D. D., Zabludoff A. I., Williams K. A., Trager S. C., Mulchaey J. S., Bolte M., 2002, ApJ, 576, 720
- Kim & Fabbiano (2004) Kim D.-W., Fabbiano G., 2004, ApJ, 611, 846
- Kroupa (2001) Kroupa P., 2001, MNRAS, 322, 231
- La Barbera et al. (2016) La Barbera F., Vazdekis A., Ferreras I., Pasquali A., Cappellari M., Martín-Navarro I., Schönebeck F., Falcón-Barroso J., 2016, MNRAS, 457, 1468
- Ma et al. (2012) Ma C.-J., Owers M., Nulsen P. E. J., McNamara B. R., Murray S. S., Couch W. J., 2012, ApJ, 752, 139
- Maraston (2005) Maraston C., 2005, MNRAS, 362, 799
- Martín-Navarro et al. (2015) Martín-Navarro I., Barbera F. L., Vazdekis A., Falcón-Barroso J., Ferreras I., 2015, MNRAS, 447, 1033
- McConnell et al. (2011) McConnell N. J., Ma C.-P., Gebhardt K., Wright S. A., Murphy J. D., Lauer T. R., Graham J. R., Richstone D. O., 2011, Nature, 480, 215
- McConnell et al. (2016) McConnell N. J., Lu J. R., Mann A. W., 2016, ApJ, 821, 39
- Merloni et al. (2003) Merloni A., Heinz S., di Matteo T., 2003, MNRAS, 345, 1057
- Monnet et al. (1992) Monnet G., Bacon R., Emsellem E., 1992, A&A, 253, 366
- Navarro et al. (1996) Navarro J. F., Frenk C. S., White S. D. M., 1996, ApJ, 462, 563
- Neto et al. (2007) Neto A. F., et al., 2007, MNRAS, 381, 1450
- Newman et al. (2013a) Newman A. B., Treu T., Ellis R. S., Sand D. J., Nipoti C., Richard J., Jullo E., 2013a, ApJ, 765, 24
- Newman et al. (2013b) Newman A. B., Treu T., Ellis R. S., Sand D. J., 2013b, ApJ, 765, 25
- Newman et al. (2016) Newman A. B., Smith R. J., Conroy C., Villaume A., van Dokkum P., 2016, preprint, (arXiv:1612.00065)
- Owers et al. (2009) Owers M. S., Nulsen P. E. J., Couch W. J., Markevitch M., Poole G. B., 2009, ApJ, 692, 702
- Planck Collaboration et al. (2016) Planck Collaboration et al., 2016, A&A, 594, A13
- Plotkin et al. (2012) Plotkin R. M., Markoff S., Kelly B. C., Körding E., Anderson S. F., 2012, MNRAS, 419, 267
- Richtler et al. (2011) Richtler T., Salinas R., Misgeld I., Hilker M., Hau G. K. T., Romanowsky A. J., Schuberth Y., Spolaor M., 2011, A&A, 531, A119
- Rines et al. (2013) Rines K., Geller M. J., Diaferio A., Kurtz M. J., 2013, ApJ, 767, 15
- Salpeter (1955) Salpeter E. E., 1955, ApJ, 121, 161
- Sand et al. (2004) Sand D. J., Treu T., Smith G. P., Ellis R. S., 2004, ApJ, 604, 88
- Schaye et al. (2015) Schaye J., et al., 2015, MNRAS, 446, 521
- Smith (2014) Smith R. J., 2014, MNRAS, 443, L69
- Smith et al. (2017) Smith R. J., Lucey J. R., Edge A. C., 2017, MNRAS, 467, 836
- Spergel & Steinhardt (2000) Spergel D. N., Steinhardt P. J., 2000, Physical Review Letters, 84, 3760
- Thomas et al. (2011) Thomas D., Maraston C., Johansson J., 2011, MNRAS, 412, 2183
- Treu et al. (2010) Treu T., Auger M. W., Koopmans L. V. E., Gavazzi R., Marshall P. J., Bolton A. S., 2010, ApJ, 709, 1195
- Valdes et al. (2004) Valdes F., Gupta R., Rose J. A., Singh H. P., Bell D. J., 2004, ApJS, 152, 251
- Veale et al. (2017) Veale M., et al., 2017, MNRAS, 464, 356
- Yıldırım et al. (2016) Yıldırım A., et al., 2016, MNRAS, 456, 538
- van Dokkum et al. (2017) van Dokkum P., Conroy C., Villaume A., Brodie J., Romanowsky A. J., 2017, ApJ, 841, 68
- van den Bosch (2016) van den Bosch R. C. E., 2016, ApJ, 831, 134