TRES Survey of Variable Diffuse Interstellar Bands
Abstract
Diffuse interstellar bands (DIBs) are absorption features commonly observed in optical/near-infrared spectra of stars and thought to be associated with polyatomic molecules that comprise a significant reservoir of organic material in the universe. However, the central wavelengths of almost all DIBs do not correspond with electronic transitions of known atomic or molecular species and the specific physical nature of their carriers remains inconclusive despite decades of observational, theoretical, and experimental research. It is well established that DIB carriers are located in the interstellar medium, but the recent discovery of time-varying DIBs in the spectra of the extragalactic supernova SN 2012ap suggests that some may be created in massive star environments. Here we report evidence of short time-scale (10–60 d) changes in DIB absorption line substructure toward 3 of 17 massive stars observed as part of a pathfinder survey of variable DIBs conducted with the 1.5-m Tillinghast telescope and Tillinghast Reflector Echelle Spectrograph (TRES) at Fred L. Whipple Observatory. The detections are made in high-resolution optical spectra () having signal-to-noise ratios of 5–15 around the 5797 and 6614 Å features, and are considered significant but requiring further investigation. We find that these changes are potentially consistent with interactions between stellar winds and DIB carriers in close proximity. Our findings motivate a larger survey to further characterize these variations and may establish a powerful new method for probing the poorly understood physical characteristics of DIB carriers.
keywords:
astrochemistry – molecular processes – ISM: lines and bands – ISM: molecules – stars: mass-loss – stars: winds, outflows1 Introduction
The nature of diffuse interstellar bands (DIBs) remains a long-standing problem in optical and near-infrared astronomy. DIBs, which represent over 500 absorption features, are generally narrow [full width at half-maximum (FWHM) 1 Å] and weak (less than per cent below continuum) with central wavelengths that do not correspond to known molecular or atomic species (Herbig, 1995; Hobbs et al., 2009; Geballe et al., 2011). The originating physical sources (or ‘carriers’) of the DIBs have remained a source of speculation and discussion since DIBs were first observed almost a century ago by Heger (1922).
Merrill (1934) originally suggested dust grains and molecules as possible carriers for the DIB features. These carriers remain the most plausible candidates after decades of observational, theoretical, and experimental work (see reviews by Herbig 1995, Fulara & Krełowski 2000, and Sarre 2006). Substantial observational evidence favors polyatomic, carbon-based molecular carriers. In particular, photo-UV-resistant organic molecules (Douglas, 1977), polycyclic aromatic hydrocarbons (PAHs) (Cox, 2011), and fullerenes (Iglesias-Groth, 2007) remain the most promising candidates. The recent unambiguous identification of as the carrier for two infrared DIB lines supports the notion that the carriers of DIBs are indeed organic molecules (Campbell et al., 2015).
Many observed properties of DIBs are best understood when
interpreted as originating in carriers located in the interstellar
medium (ISM). DIB features remain stationary in spectroscopic binaries
(Merrill, 1934), and extinction and Na i column density
positively correlate with DIB intensity (Herbig, 1995).
However, since the winds of massive stars are a principal
source of replenishment for the ISM, it has been suspected that DIB
carriers might also be present in circumstellar shells (CSs). To date,
despite some evidence for possible DIB-CS associations in a narrow
subset of mass-losing stars where temporal variations in DIB
equivalent width, central wavelength, and substructure were observed
(Le Bertre, 1990; Le Bertre &
Lequeux, 1993), the majority of searches for carriers in
CSs have proven unsuccessful or inconclusive
(Le Bertre &
Lequeux, 1992; Sarre, 2006; Luna
et al., 2008).
The recent discovery of time-varying DIB features in optical spectra of the extragalactic Type Ic broad-lined supernova (SN) 2012ap calls into question the current assumption that all DIBs reside in the ISM (Milisavljevic et al., 2014). The equivalent width (EW) strength of DIB features observed toward SN 2012ap changed with time in a manner consistent with interaction between the SN and nearby DIB carrier(s) that possess high ionization potentials like those found in small cations or charged fullerenes. Milisavljevic et al. (2014) noted that archival data from two additional spectroscopically similar SNe also show evidence for temporal DIB variation, suggesting that a specific subset of SN progenitor stars may possess a CS environment enriched with DIB carriers.
Motivated by this recent discovery, we obtained high-resolution multi-epoch optical spectra of 17 massive stars as part of a pathfinder survey of variable DIBs. In this paper, we present the results from our survey, which finds evidence for substructural changes on short time-scales in the DIB absorption profiles towards three stars. We describe the observations, reduction of the raw spectral data, and the stellar sample selection in Section 2. In Section 3, we discuss the Gaussian fitting methods, determinations of errors, and data quality. We use these fitting methods and visual inspection to identify time-varying changes in DIB absorption features in Section 4. We discuss how these findings may be interpreted as interaction between strong stellar winds and the local carriers of DIBs in Section 5 and summarize our conclusions in Section 6.
2 Observations
2.1 Instrument and Data
High-resolution optical spectra were obtained with the 1.5-m Tillinghast telescope and Tillinghast Reflector Echelle Spectrograph (TRES) at Fred L. Whipple Observatory. TRES has a E2V 2K 4.5K CCD with 13.5- pixels, and each exposure provides nearly complete spectral coverage from 3850 to 9100 Å at a resolution of over the spectrograph’s 51 orders (Szentgyorgyi & Furész, 2007; Mink, 2011). Multi-epoch observations were obtained between June 2013 and January 2014 for each star with co-added total exposure times ranging from 300 to 1800 s depending on the brightness of the source and observing conditions that were not always photometric. Time between observations ranged from 10–60 d, were dependent on weather conditions and the TRES observing queue, and thus were not obtained at regular intervals. The typical spectral signal-to-noise (S/N) ratio in the region of DIB features was 5–15. A detailed list of observations is found in Table 1.
| Star | RA(2000) | Dec(2000) | Date | UTC | Exposure Time(s) | Air Mass |
| HD 168607 | 2013 June 2 | 09:02:04 | 360 | 1.49 | ||
| 2013 July 31 | 05:33:41 | 450 | 1.50 | |||
| HD 168625 | 2013 June 2 | 09:10:20 | 360 | 1.50 | ||
| 2013 July 31 | 05:44:40 | 450 | 1.52 | |||
| HD 211853 | 2013 Sept 11 | 08:31:40 | 300 | 1.21 | ||
| 2013 Sept 19 | 07:22:19 | 300 | 1.15 | |||
| 2013 Nov 14 | 04:42:23 | 300 | 1.25 | |||
| 2013 Sept 25 | 04:39:53 | 300 | 1.11 | |||
| HD 214419 | 2013 Sept 11 | 08:59:27 | 300 | 1.23 | ||
| 2013 Sept 19 | 07:30:01 | 300 | 1.15 | |||
| 2013 Sept 23 | 03:30:26 | 360 | 1.21 | |||
| 2013 Nov 14 | 04:49:42 | 300 | 1.23 | |||
| AS314 | 2013 June 2 | 08:48:29 | 660 | 1.44 | ||
| 2013 July 3 | 10:03:39 | 1000 | 2.07 | |||
| 2013 July 31 | 06:04:58 | 900 | 1.45 | |||
| MT 59 | 2013 Sept 11 | 06:46:29 | 600 | 1.14 | ||
| 2013 Sept 19 | 04:21:34 | 600 | 1.02 | |||
| 2013 Sept 26 | 03:30:03 | 800 | 1.02 | |||
| 2013 Nov 26 | 01:45:53 | 600 | 1.14 | |||
| MT 83 | 2013 Sept 11 | 07:01:14 | 1200 | 1.18 | ||
| 2013 Sept 19 | 04:37:22 | 1200 | 1.03 | |||
| 2013 Sept 25 | 03:19:07 | 1200 | 1.02 | |||
| 2013 Nov 26 | 02:10:27 | 1200 | 1.20 | |||
| MT 145 | 2013 Sept 19 | 06:00:58 | 1200 | 1.12 | ||
| 2013 Nov 15 | 03:55:45 | 1200 | 1.42 | |||
| MT 259 | 2013 Sept 19 | 06:25:02 | 1200 | 1.17 | ||
| 2013 Nov 15 | 04:18:45 | 1200 | 1.54 | |||
| MT 457 | 2013 Sept 19 | 06:48:15 | 1200 | 1.23 | ||
| 2013 Nov 14 | 04:19:19 | 1200 | 1.52 | |||
| MWC 314 | 2013 June 02 | 08:18:15 | 1080 | 1.13 | ||
| 2013 June 28 | 09:42:01 | 1200 | 1.12 | |||
| 2013 July 24 | 08:21:08 | 900 | 1.15 | |||
| WR 1 | 2013 Sept 21 | 07:46:19 | 600 | 1.20 | ||
| 2013 Sept 26 | 05:42:24 | 750 | 1.27 | |||
| 2013 Nov 26 | 03:03:11 | 600 | 1.20 | |||
| WR 2 | 2013 Sept 11 | 10:05:30 | 1200 | 1.17 | ||
| 2013 Sept 17 | 08:18:51 | 1200 | 1.14 | |||
| 2013 Sept 21 | 08:00:49 | 1200 | 1.14 | |||
| 2013 Sept 25 | 10:25:14 | 1350 | 1.25 | |||
| 2013 Nov 26 | 03:23:14 | 1200 | 1.15 | |||
| WR 3 | 2014 Jan 11 | 03:07:16 | 600 | 1.16 | ||
| 2014 Jan 21 | 02:48:53 | 600 | 1.19 | |||
| WR 113 | 2013 June 2 | 08:40:25 | 360 | 1.37 | ||
| 2013 July 3 | 09:51:35 | 540 | 2.03 | |||
| 2013 July 31 | 05:54:36 | 450 | 1.41 | |||
| WR 124 | 2013 June 2 | 07:52:29 | 1200 | 1.15 | ||
| 2013 July 31 | 06:24:39 | 1200 | 1.04 | |||
| WR 127 | 2013 June 2 | 07:32:44 | 600 | 1.25 | ||
| 2013 June 28 | 10:08:23 | 1800 | 1.07 | |||
| 2013 July 27 | 07:52:31 | 1800 | 1.04 |
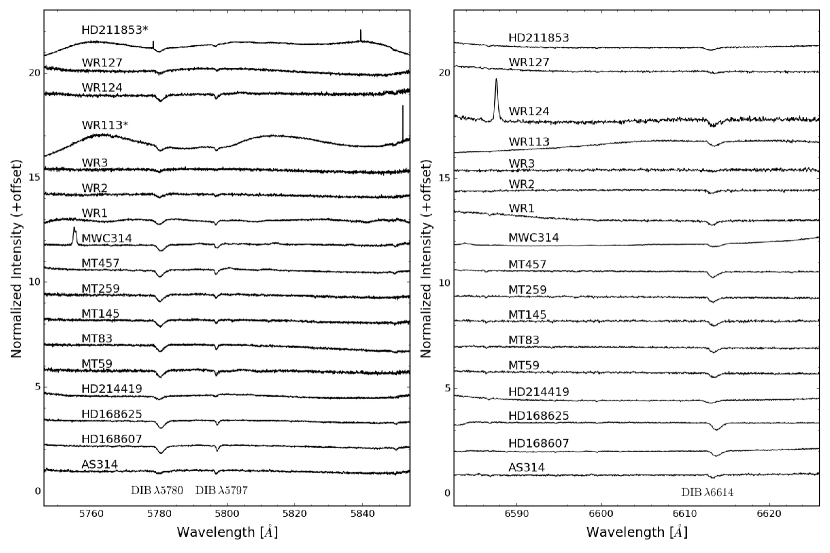
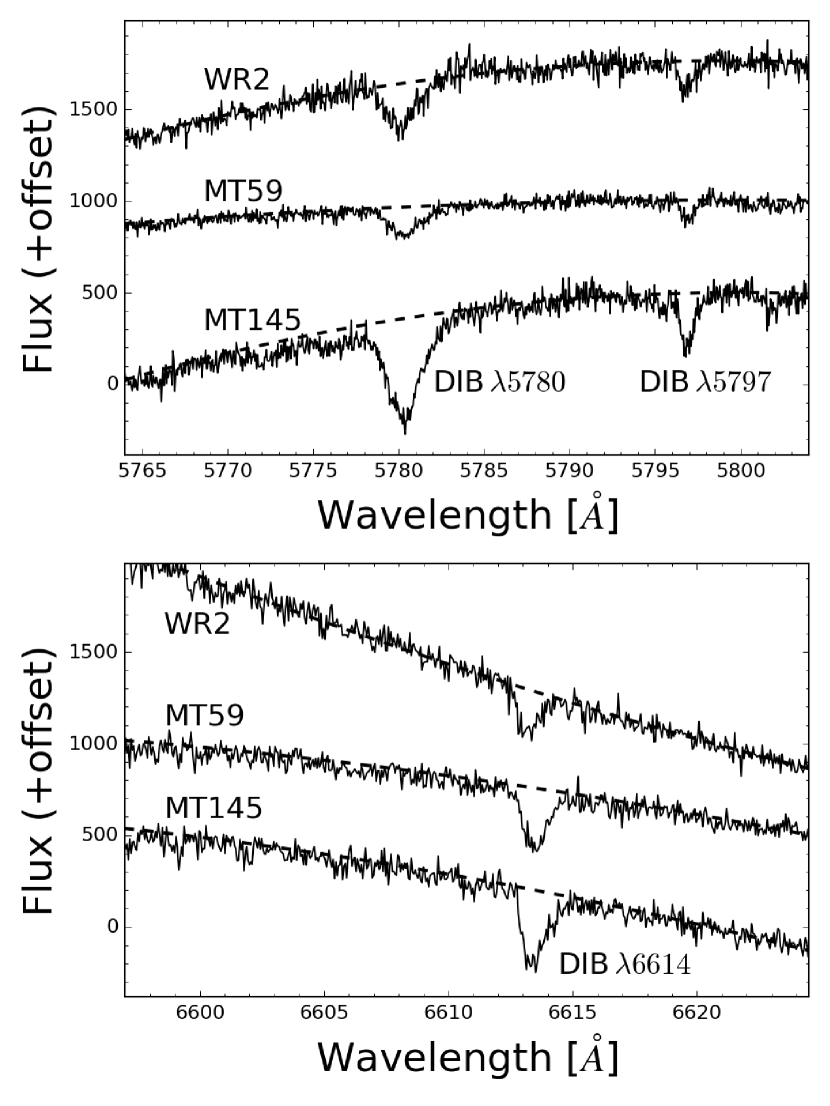
Raw spectra were reduced using the standard TRES data reduction pipeline (Mink, 2011). The spectra were corrected for heliocentric velocity using the rvsao software package in iraf (Kurtz & Mink, 1998). Continua of spectra were fit with Chebyshev functions and then continuum normalized using the continuum task. Example spectra of the 17 stars we observed around features of interest is shown in Fig. 1. Fits to stellar continua for three stars are shown in Fig. 2. Orders used for fitting ranged from 3rd to 15th depending on the complexity of the continuum. For each star, the lowest order fit over a broad range of wavelength in the relevant echelle order was chosen to mitigate any potential influence of other absorption features, which could skew the continuum fits. We have noted the few instances where the continua were particularly complex and difficult to fit and we discuss potential effects on our results in Section 5. We also experimented with higher order fits but found no significant differences in the resulting continuum fits or candidate DIB changes between epochs.
2.2 Sample Selection
We observed 17 stars at multiple epochs for the DIB variability survey. Candidate stars were selected from the literature based on whether pre-existing evidence of DIBs existed, and if they were mass-losing stars with enhanced O-rich or N-rich environments that could be correlated with DIB variability (as suggested by Le Bertre & Lequeux 1993). Wolf-Rayet (W–R) stars were favored since these are believed to be the progenitor stars of Type Ib/c supernovae like SN 2012ap (Gaskell et al., 1986; Milisavljevic et al., 2014). Spectral type, extinction, and further information for each source are found in Table 2.
| Star | Spectral Class | Other Designations | Binarity | Reference | |
|---|---|---|---|---|---|
| HD 168607 | B9.4 Ia-0ep | V4029 Sgr, MWC 291 | 1.44 | VB | 1, 2 |
| HD 168625 | B5.6 Ia-0p | V4030 Sgr | 1.33 | VB | 2 |
| HD 211853 | WN6o+06I | GP Cep | 0.39 | SB2 | 3, 11, 13 |
| HD 214419 | WN6+09II-Ib | CQ Cephei | 0.41 | SB1 | 4, 5, 11 |
| AS 314 | A0 Ia+ | V452 Scuti | 0.90 | … | 6 |
| MWC 314 | B3Ibe | V1429 Aquilae | 1.45 | SB1 | 7 |
| WR 1 | WN4-s | HD 4004 | 0.67 | … | 8, 14 |
| WR 2* | WN2-w | HD 6327 | 0.44 | VB | 8, 14 |
| WR 113 | WC8d + 08-9IV | HD 168206, CV Ser | 0.78 | SB2 | 9, 11, 14 |
| WR 124 | WN8h | Hen 2-427 | 1.08 | SB1 | 8, 14 |
| WR 127 | WN3 + 09.5V | HD 186943 | 0.27 | SB2 | 8, 14 |
| MT 59* | O8.5 V | Schulte 1 | 1.47 | SB1 | 10, 12 |
| MT 83 | B1 I | Schulte 2 | 1.18 | … | 10, 12 |
| MT 145* | O9.5 V | Schulte 20 | 1.11 | SB1 | 10, 12 |
| MT 259 | B0.5 V | Schulte 21 | 1.00 | … | 10, 12 |
| MT 457 | O3 If | Schulte 7 | 1.45 | … | 10, 12 |
*Potential DIB variability detected.
References – (1) Chentsov &
Gorda 2004; (2) Walborn &
Fitzpatrick 2000; (3) Saurin
et al. 2010; (4) Skinner et al. 2015; (5) Underhill
et al. 1990; (6) Miroshnichenko et al. 2000; (7) Carmona et al. 2010; (8) Hamann et al. 2006; (9) David-Uraz
et al. 2012; (10) Massey &
Thompson 1991; (11) Ducati 2002; (12) Kobulnicky
et al. 2014; (13) Panov &
Seggewiss 1990; (14) van der
Hucht 2001
3 Methods and Analysis
3.1 Procedure
Before individual exposures were co-added, spectra were visually examined and found to be free of noise spikes around the features of interest, which could produce spurious line profile variations. The DIB features at 5780.6, 5797.1, and 6613.7 Å that were visible in all data were fit with Gaussian profiles using iraf’s splot task. Gaussian profiles are not true representations of DIB features but do provide a reasonable proxy by which to estimate their strength and central wavelength. Due to the poor response of the TRES instrument below 5000 Å, the DIB 4428 feature is not detected in any of our observations. Some stars weakly exhibited the 6196.0 Å feature, but it could not be reliably measured. The feature at 6283.9 Å was also visible, but it was often contaminated by telluric absorption and at the edge of the order wavelength window. Thus, these features are not included in our reported analysis. The Na i feature, which provides a good measure of wavelength stability between epochs and thus tests for potential systematic errors, was fitted. We assumed 5889.950 and 5895.924 Å for the intrinsic wavelengths (Morton & Smith, 1973). Multiple fittings for the equivalent width (EW) were done for each feature and averaged for each epoch, and the reported errors are given by the standard deviation of these fitting results. Radial velocities were derived by comparing the central wavelength of the Gaussian fittings to rest wavelengths of DIB features taken from the NASA DIBs catalogue (Jenniskens & Desert, 1994).
3.2 Resolving DIB 5797 Substructure
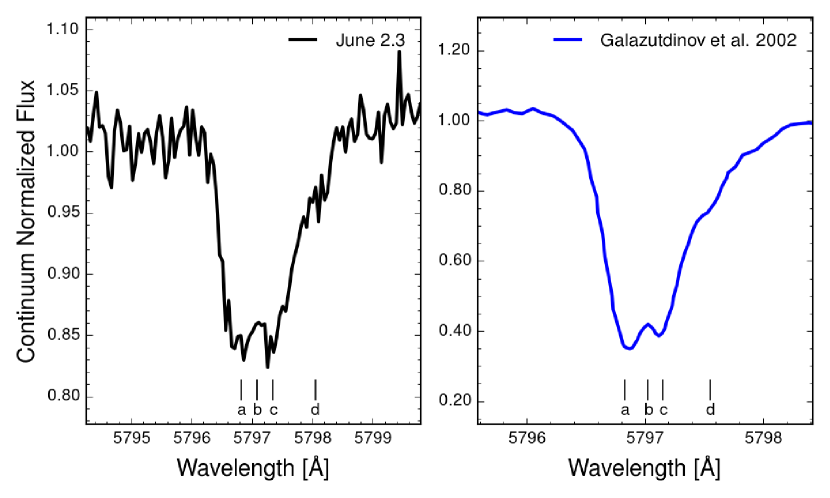
We examined the well-studied DIB (cf. Sarre et al. 1995) to assess our ability to measure possible variation in DIB substructure. This DIB is known to have conspicuous substructural features believed to be associated with the rotational contours of gas-phase molecular carriers (Kerr et al., 1998). We were able to identify several characteristic substructural components in this feature in all but two stars (AS 314 and WR 124). In these two outlying cases, we were limited by poor S/N around the feature. A representative spectrum showing the presence of this substructure is shown in Fig. 3. This exercise demonstrates that our observations with the TRES instrument permit careful investigation of potential changes in DIB substructure.
4 Results
4.1 Resolved DIB Features
Our inspection of the data uncovered DIB variations in 3 of the 17 targets observed: WR 2, MT 59, and MT145. The remaining 14 stars showed no measurable variations in DIB substructure, EW, or radial velocity. Of the three candidate stars we identify DIB variability, significant variations were seen in the 5797 and 6614 Å features, and marginal evidence for variation in the 5780 Å feature. Below we describe our results in detail.
4.2 WR 2
WR 2, also known as HD 6327, is a weak-lined Galactic WN2 star that is compact () and has a high temperature ( K). It exhibits rounded spectral profiles that are unique among Galactic W–R stars and do not match current models unless very rapid rotation (1900 ) is assumed (Hamann et al., 2006). For each epoch, the continuum was fitted with a 3rd order Chebyshev function to account for any continuum variability between observations. Examples of the continuum fits are shown in Fig. 2.
In Fig. 4, we plot the results of our measurements, and show spectra of select epochs around the DIB feature illustrating how changes in radial velocity coupled with modest EW variations are the consequence of substructural changes within the DIB feature. The radial velocity variations are seen at the level. The detection, disappearance, and then slight re-emergence of a substructural feature on the blue wing of the DIB as well as a deeper, sharply peaked feature in the blue side of the minimum of the absorption trough can be seen (labelled ‘a’ and ‘b’, respectively in Fig. 4). We also detect the appearance of a shallow dip in the right wing of DIB (labelled ‘c’ in Fig. 4) between September 17.3 and November 26.1. The DIBs at and 6614 Å show no measurable changes EW, and a marginal decrease in radial velocity. Na i remains unchanged throughout all epochs.
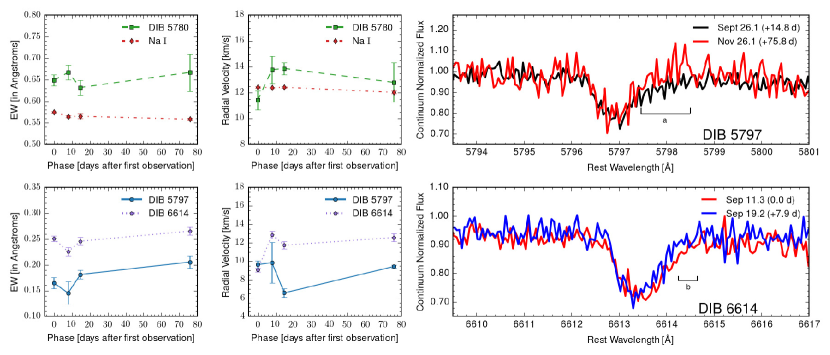
4.3 MT 59
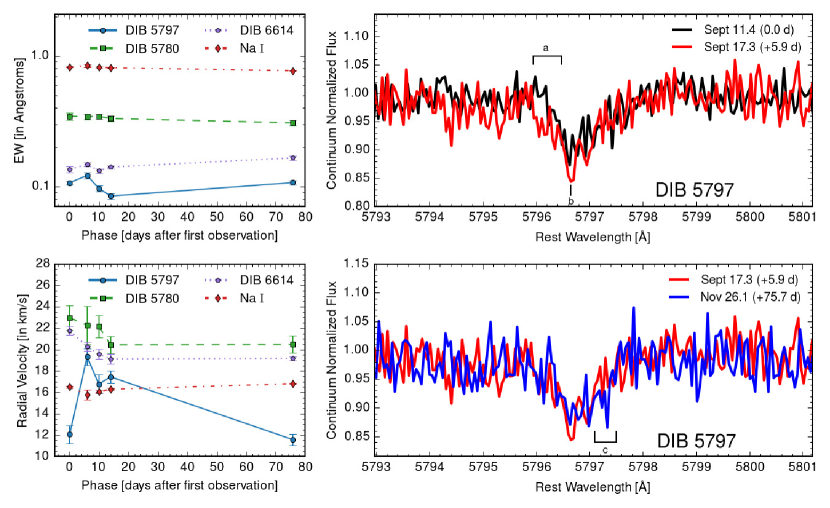
MT 59 is a massive O-type star located in Cygnus OB2 (Massey & Thompson, 1991; Wright et al., 2015). For each epoch, the continuum was fitted with a 3rd order Chebyshev function to account for any continuum variability between observations (see Fig. 2). In Fig. 5 we plot our measurements of changes in the DIB 5780, 5797, and 6614 features of MT 59, as well as select epochs of spectra enlarged around DIB 5797 and features that exhibit the most conspicuous changes. Between September 26.1 and November 26.1, a prominent substructural change is seen as well as a variation in the radial velocity of DIB 6614. The red wing of the DIB spanning 5797.6 to 5798.6 Å (labelled ‘a’ in Fig. 5 and labelled ‘d’ in Fig. 3) decreases in strength. A marginal decrease is also detected in the red wing of the DIB 6614 feature (labelled ‘b’ in Fig. 5) between September 11.3 and September 19.2. The DIB at 5780 Å shows no measurable changes in EW and negligible variations in radial velocity. Na i remains unchanged throughout all epochs.
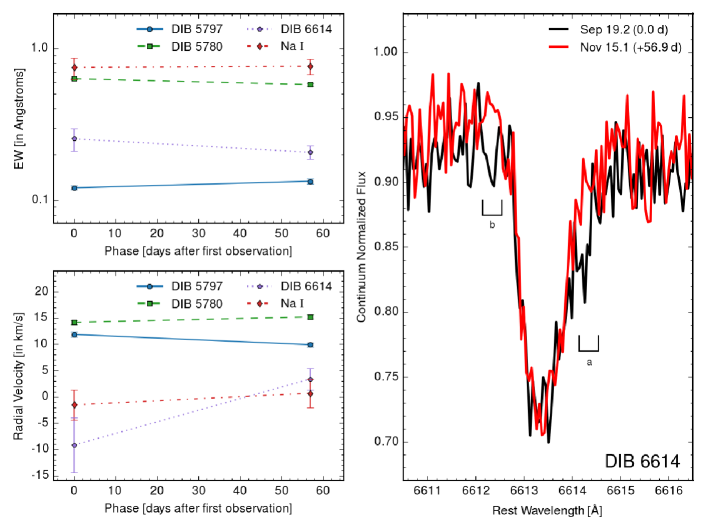
4.4 MT 145
MT 145 is also a massive O-type star located in Cygnus OB2 (Massey & Thompson, 1991; Wright et al., 2015). For each epoch, the continuum was fitted with a 3rd order Chebyshev function to account for any continuum variability between observations. Measurements of changes in its DIB 5780, 5797, and 6614 features are shown in Fig. 6, as well as spectra enlarged around DIB 6614 that exhibited the most conspicuous change. From September 19.2 to November 15.1, we detect an increase in a broad feature on the red and left wings of DIB 6614 (labelled ‘a’ and ‘b’ in Fig. 6, respectively). The DIBs at 5780 and 5797 Å exhibit no measurable changes in EW and only minor radial velocity changes. Na i remains unchanged throughout all epochs.
4.5 Robustness of Our Detections
In order to quantify the significance of our DIB temporal variation detections, we compared the average flux excess (or deficiency) as measured by the difference between our spectra and continuum fits. The difference between observation and continuum fit was made in two directly adjacent 2.5 Å windows centered on the DIB feature. An advantage of this method is that it incorporates the relatively broad spectral width of the observed variations that are much larger than narrow pixel-to-pixel noise fluctuations. For instance, the substructural feature labeled ‘a’ in Fig. 4 is not substantially larger in flux than a noise feature at about 5794.3 Å but ‘a’ is distributed over Å while the noise feature of similar depth happens only over Å .
For profiles consistent with no temporal change, no substantial flux excess is expected relative to that of the continuum, which is set by the root-mean-square fluctuations. However, for the broad changes seen toward the wings of DIBs profiles, which represent the majority of our candidate changes, we typically observe flux differential between the DIB features and the continuum. The variation observed in WR 2 in DIB 5797 between Sept. 11.4 and 17.3 has a particularly large flux excess that is factor of larger than the continuum. We note that this method is not sensitive to changes in the form of narrow spectral spikes, e.g., WR 2, ‘c’ for DIB 5797, that may in fact be attributable to noise in the extracted spectrum.
Variable DIB features detected in WR 2 and MT 59 pass our flux excess test and support the view that the observed changes are intrinsic to the profile and not artificial. The candidate detections in MT 145, however, do not pass this test and thus we are less confident in their reality.
5 Discussion
5.1 Variable Diffuse Interstellar Bands
We observe measurable changes in absorption line substructure around the DIB 5797 and features over relatively short time-scales ( d). These changes are unlike normal DIB profiles that are static and remain unchanged, even after yr of observing (Herbig, 1995). They are also unlike the changes observed in DIB absorptions toward SN 2012ap (Milisavljevic et al., 2014). In that case, the evolution was observed as pronounced changes in EW absorption strengths, as opposed to modifications of profile substructure that we observe in WR 2, MT 59, and possibly MT 145.
Robust fitting of stellar continua is a known challenge in DIB profile analyses (see, e.g., Galazutdinov et al. 2008b), and could potentially contribute to changes in DIB profile structure like those seen in our spectra. We are unable to conclusively rule out a changing continuum between observational epochs. However, no conspicuous changes in the continua that have been fit with 3rd order Chebyshev polynomials between epochs is observed. Thus, we interpret these changes to be intrinsic to the DIB profiles and not due to changes in the stellar continua.
Spectra of increasing quality and resolution obtained over the past two decades have hinted at variations in the profiles of individual DIBs along different sight lines. In some cases, the observed profiles reflect the complex structure of the ISM made up of multiple clouds moving at a range of velocities (e.g., Herbig & Soderblom 1982; Weselak et al. 2010). However, not all differences in profile shapes observed along different sight lines can be accounted for this way. Moreover, defining characteristics of these profile shape differences resemble the DIB variations reported here.
For example, Krelowski et al. (1997) observed the DIB feature at using the McDonald Observatory echelle spectrograph toward several , , and -type sources (see their paper for a more careful definition of these terms), and observed slight differences in the fine structure on the redward side. These subtle substructure variations have been repeatedly documented in a series of high-resolution surveys of sight lines probing only a single cloud by Galazutdinov et al. (2002), Galazutdinov et al. (2008b) and Galazutdinov et al. (2008a), which confirmed that the variations in profile are intrinsic to the carrier, and not due to Doppler effects.

Dahlstrom et al. (2013) and Oka et al. (2013) have reported observations of several DIBs (5780, 5797, and 6614) that show very prominent extended tails toward the red (ETRs) in Her 36, suggesting that the carriers are polar molecules that are being radiatively pumped by nearby dust emission, leading to elevated rotational temperatures. A comparison of their spectra toward Her 36 and 9 Sgr (which shows no ETR), shown in fig. 3 of Oka et al. (2013), bears striking resemblance to the comparison of our spectra toward MT 59 taken on September 26 and November 26, respectively (Fig. 5). Likewise, the differences observed in the extended sidebands of the DIB profiles towards HD 179406 and HD 147889 presented in Marshall et al. (2015) and explained in terms of vibrational hot bands, are similar to the two epochs of MT 145 presented here (Fig. 6).
Searches for time-varying DIBs were conducted toward Velorum by Smith et al. (2013). Known atomic absorption lines changed over time but DIB features did not, indicating that DIBs do not necessarily follow the same trends as atomic transitions. These results are not inconsistent with our own findings. Whereas the DIBs investigated in Smith et al. (2013) were primarily interstellar in origin, we propose that the variations we observe must result from circumstellar DIB carriers interacting with the massive star winds.
These results all support the notion that DIB absorption profiles can exhibit substructure that is sensitive to the environmental conditions in which carrier molecules reside. In the next section we test the plausibility of this hypothesis by modeling the variable DIB profile of MT 59 assuming changes in temperature.
5.2 DIB 5797
DIB 5797 is a strong, well-studied feature whose profile resembles the rotational fine structure associated with a molecular rovibronic transition, as best illustrated by the spectrum of Sarre et al. (1995) acquired toward Sgr using the Ultra-High-Resolution Facility at the Anglo-Australian Telescope (Diego et al., 1995). Our observations of MT 59 may suggest that at least some of the molecular carriers of DIB 5797 are experiencing time-varying internal excitation due to an interaction with the star. If this is true, the nature of the interaction may help shed light on the molecular carrier. However, since the carrier is unknown, it is difficult to reliably interpret the changes in the profile.
Several attempts have been made to model the fine structure of DIBs 5797 in terms of specific types of spectroscopic transitions of free molecules. Kerr et al. (1998) performed a contour modeling study based on a perpendicular transition in a planar (oblate) symmetric top molecule, but were unable to achieve a satisfactory match. Oka et al. (2013) modeled the ETRs as a perpendicular band in a linear molecule. Although their model reproduced the ETRs, it did not match the fine structure at the top of the band. A later model of DIB 5797 in a more typical source by Huang & Oka (2015), based on a parallel transition in a linear radical with 5–7 heavy atoms, was able to generally reproduce the ETRs with some success assuming a 2 component mixture with different rotational temperatures in order to approximate a higher level of rotational excitation due to radiative pumping. The same model can also generally account for the structure in more typical sources that do not display the ETRs by assuming a rotational temperature of 2.73 K appropriate for a polar molecule in a low-density environment.
The limited resolution of our spectra and low S/N – of DIB 5797 in our data preclude a detailed quantitative analysis of the profile variations. However, if we adopt the interpretation of Huang & Oka (2015), we might ascribe the increase in absorption on the red side of this feature in MT 59 (Fig. 5) to a time-dependent change in the excitation temperature of a portion of the DIB carriers due to an interaction with the massive star. Such an effect could occur in one of two ways: 1) if the radiation field of the star changes with time, a portion of the carriers could be radiatively pumped into higher internal states, ultimately leading to a higher rotational excitation temperature, or 2) some of the DIB carriers may experience an interaction with a clumpy mass-loss wind, leading to an increased collision rate that increases the excitation temperature of the carrier’s rotational distribution above 2.73 K.
We inspected the stellar features of our candidate stars for conspicuous and unexplainable changes coincident with changes observed in the DIB features but were unable to find any. Specifically, the fine structure of the emission line profiles of WR 2 did not exhibit any measurable changes between epochs, and the temporal variation of H and He absorption features of MT 59 and MT 145 (most conspicuous being H and He i 5876) was consistent with their nature as single-lined binary systems (Kobulnicky et al., 2014). Thus we have no direct evidence that the stellar radiation field exhibited significant changes during the observational period. However, massive stars are known to exhibit temporally varying mass-loss winds on these time-scales (Moffat et al., 1988; Tuthill et al., 1999), so the latter interpretation is attractive.
We attempted to reproduce the DIB 5797 profiles of MT 59 using the program PGOPHER111http://pgopher.chm.bris.ac.uk/, in combination with the models of Huang & Oka (2015). For each model (A, B, and C), molecular spectra were simulated at temperatures ranging from the background radiative temperature (2.73 K) up to 60 K. We then constructed synthetic spectra from two-component mixtures consisting of a 2.73 K component with variable amounts (0–100%) of a second, higher temperature component for each original model from Huang & Oka (2015) in order to simulate additional rotational excitation. Comparing all these models to the MT 59 September 26 data, the best match involved a 50/50 mixture of a 40–60 K and a 2.73 K spectrum derived from Model A, while the MT 59 November 26 was best fit by a 50/50 mixture whose warmer component was 20 K (Figure 7). Model C showed qualitatively similar results, while model B was found to be a poor fit in general to the September 26 data. While higher SNR spectra will be required to derive any firm conclusions, our preliminary analysis supports the notion that a change in the rotational excitation of the DIB carrier population could explain the profile changes tentatively observed between epochs.
6 Conclusions
We have presented the results of a pathfinder survey of 17 massive stars conducted with the TRES high resolution spectrograph that looked for changes in DIB absorption features over multiple epochs. We find evidence for time-varying changes in three stars WR 2, MT 59, and MT 145 in the substructure of the DIB 5797 and 6614 features over relatively short time-scales ( d). The changes are most pronounced along the wings of the profiles. Sharp and narrow features ( Å) are also seen to come and go, but their reality is less secure. The changes in WR 2 and MT 59 pass our flux excess test and are our leading candidate detections, whereas the changes in MT 145 fail this test and have a greater chance of being due to noise in the extracted spectrum.
We have proposed that the short-term DIB variability we observe may be the consequence of carrier molecules interacting with the winds of nearby host stars. We do not find any correlation between DIB changes and changes in stellar emission/absorption features to support this hypothesis. However, using the models of Huang & Oka (2015), we find it plausible that changes in rotational excitation of the carrier molecules could be responsible for the observed changes in DIB substructure observed in our data between epochs.
Our results imply that carrier molecules responsible for the DIB absorption variability must be located in close proximity to massive stars (i.e., within their circumstellar shells). This conclusion runs counter to numerous studies that support the view that DIBs are a static large-scale phenomenon not located in circumstellar environments (Seab, 1995; Luna et al., 2008; Cox, 2011). However, theoretical and observational evidence increasingly favor the notion that DIB carriers are large gas phase molecules (e.g. PAHs or fullerenes) that could very well be present in circumstellar shells and detectable under specific circumstances.
Notably, recent work suggests that the mere presence of carbon-rich space environments may not be enough to detect DIB carrier material, and that proximity to a strong source of ionizing photons may be an important factor in producing enhanced DIB absorptions (see, e.g., Milisavljevic et al. 2014; and Díaz-Luis et al. 2015 who report evidence of unusually intense DIB 4428 and DIB 5780 features in fullerene planetary nebulae). Furthermore, if mass loss is concentrated along circumstellar discs, then the ability to observe DIB variations may also be related to line of sight effects. Taken together, observing DIBs in circumstellar environments may be relatively difficult and the instances rare given the numerous conditions that need to be satisfied in order for them to be detectable.
Our survey demonstrates the need for instrumental stability, appropriate observing cadence, high spectral resolution, and superior S/N in order to successfully detect DIB profile changes. A future survey could test our claims of DIB variability and improve on our work by observing more stars with spectra of S/N 100. Observations made at evenly spaced intervals matching orbital periods of known binary systems could look for repeated DIB variability correlated with stellar absorption and/or emission features. Broader wavelength coverage could potentially identify new families of time-varying DIBs and probe the DIB feature, which was not studied in this investigation but exhibited the most conspicuous changes in spectra observed from SN 2012ap. Using information about the environments of these stars (e.g. temperature and ionizing radiation) in combination with contour models, the temporal variations observed in these DIBs may provide a new way to probe the physical properties of their carriers.
Acknowledgements
We thank I. Crawford who provided many helpful comments and suggestions that improved the quality and presentation of this paper. E. Berger kindly provided helpful comments on an earlier draft of the paper. The observations reported in this paper were obtained at the Fred L. Whipple Observatory, which is operated by the Smithsonian Astrophysical Observatory. We thank L. Buchhave, G. Esquerdo, P. Berlind, M. Calkins, and J. Mink for help planning, obtaining, and reducing these data. C. L. thanks the Harvard College Program for Research in Science and Engineering that provided financial support for this work, as well as the Universities Space Research Association for additional support through the Frederick Tarantino Memorial Scholarship Award.
References
- Campbell et al. (2015) Campbell E. K., Holz M., Gerlich D., Maier J. P., 2015, Nature, 523, 322
- Carmona et al. (2010) Carmona A., van den Ancker M. E., Audard M., Henning T., Setiawan J., Rodmann J., 2010, A&A, 517, A67
- Chentsov & Gorda (2004) Chentsov E. L., Gorda E. S., 2004, Astronomy Letters, 30, 461
- Cox (2011) Cox N. L. J., 2011, in Joblin C., Tielens A. G. G. M., eds, EAS Publications Series Vol. 46, EAS Publications Series. pp 349–354, doi:10.1051/eas/1146036
- Dahlstrom et al. (2013) Dahlstrom J., et al., 2013, Astrophys. J., 773, 41
- David-Uraz et al. (2012) David-Uraz A., et al., 2012, MNRAS, 426, 1720
- Díaz-Luis et al. (2015) Díaz-Luis J. J., García-Hernández D. A., Kameswara Rao N., Manchado A., Cataldo F., 2015, A&A, 573, A97
- Diego et al. (1995) Diego F., et al., 1995, MNRAS, 272, 323
- Douglas (1977) Douglas A. E., 1977, Nature, 269, 130
- Ducati (2002) Ducati J. R., 2002, VizieR Online Data Catalog, 2237
- Fulara & Krełowski (2000) Fulara J., Krełowski J., 2000, New Astron. Rev., 44, 581
- Galazutdinov et al. (2002) Galazutdinov G., Stachowska W., Musaev F., Moutou C., Lo Curto G., Krelowski J., 2002, A&A, 396, 987
- Galazutdinov et al. (2008a) Galazutdinov G. A., Lo Curto G., Krełowski J., 2008a, MNRAS, 386, 2003
- Galazutdinov et al. (2008b) Galazutdinov G. A., LoCurto G., Krełowski J., 2008b, ApJ, 682, 1076
- Gaskell et al. (1986) Gaskell C. M., Cappellaro E., Dinerstein H. L., Garnett D. R., Harkness R. P., Wheeler J. C., 1986, ApJ, 306, L77
- Geballe et al. (2011) Geballe T. R., Najarro F., Figer D. F., Schlegelmilch B. W., de La Fuente D., 2011, Nature, 479, 200
- Hamann et al. (2006) Hamann W.-R., Gräfener G., Liermann A., 2006, A&A, 457, 1015
- Heger (1922) Heger M. L., 1922, Lick Observatory Bulletin, 10, 141
- Herbig (1995) Herbig G. H., 1995, ARA&A, 33, 19
- Herbig & Soderblom (1982) Herbig G. H., Soderblom D. R., 1982, ApJ, 252, 610
- Hobbs et al. (2009) Hobbs L. M., et al., 2009, ApJ, 705, 32
- Huang & Oka (2015) Huang J., Oka T., 2015, Mol. Phys., 8976, 1
- Iglesias-Groth (2007) Iglesias-Groth S., 2007, ApJ, 661, L167
- Jenniskens & Desert (1994) Jenniskens P., Desert F.-X., 1994, A&AS, 106
- Kerr et al. (1998) Kerr T. H., Hibbins R. E., Fossey S. J., Miles J. R., Sarre P. J., 1998, ApJ, 495, 941
- Kobulnicky et al. (2014) Kobulnicky H. A., et al., 2014, ApJS, 213, 34
- Krelowski et al. (1997) Krelowski J., Schmidt M., Snow T. P., 1997, Publ. Astron. Soc. Pacific, 109, 1135
- Kurtz & Mink (1998) Kurtz M. J., Mink D. J., 1998, PASP, 110, 934
- Le Bertre (1990) Le Bertre T., 1990, The Messenger, 59, 46
- Le Bertre & Lequeux (1992) Le Bertre T., Lequeux J., 1992, A&A, 255, 288
- Le Bertre & Lequeux (1993) Le Bertre T., Lequeux J., 1993, A&A, 274, 909
- Luna et al. (2008) Luna R., Cox N. L. J., Satorre M. A., García Hernández D. A., Suárez O., García Lario P., 2008, A&A, 480, 133
- Marshall et al. (2015) Marshall C. C. M., Krełowski J., Sarre P. J., 2015, MNRAS, 453, 3912
- Massey & Thompson (1991) Massey P., Thompson A. B., 1991, AJ, 101, 1408
- Merrill (1934) Merrill P. W., 1934, PASP, 46, 206
- Milisavljevic et al. (2014) Milisavljevic D., et al., 2014, ApJ, 782, L5
- Mink (2011) Mink D. J., 2011, in Evans I. N., Accomazzi A., Mink D. J., Rots A. H., eds, Astronomical Society of the Pacific Conference Series Vol. 442, Astronomical Data Analysis Software and Systems XX. p. 305
- Miroshnichenko et al. (2000) Miroshnichenko A. S., Chentsov E. L., Klochkova V. G., 2000, A&AS, 144, 379
- Moffat et al. (1988) Moffat A. F. J., Drissen L., Lamontagne R., Robert C., 1988, ApJ, 334, 1038
- Morton & Smith (1973) Morton D. C., Smith W. H., 1973, ApJS, 26, 333
- Oka et al. (2013) Oka T., Welty D. E., Johnson S., York D. G., Dahlstrom J., Hobbs L. M., 2013, Astrophys. J., 773, 42
- Panov & Seggewiss (1990) Panov K. P., Seggewiss W., 1990, A&A, 227, 117
- Sarre (2006) Sarre P. J., 2006, Journal of Molecular Spectroscopy, 238, 1
- Sarre et al. (1995) Sarre P. J., Miles J. R., Kerr T. H., Hibbins R. E., Fossey S. J., Somerville W. B., 1995, MNRAS, 277, L41
- Saurin et al. (2010) Saurin T. A., Bica E., Bonatto C., 2010, MNRAS, 407, 133
- Seab (1995) Seab C., 1995, in Tielens A. G. G. M., Snow T. P., eds, Astrophysics and Space Science Library Vol. 202, The Diffuse Interstellar Bands. p. 129, doi:10.1007/978-94-011-0373-2_14
- Skinner et al. (2015) Skinner S. L., Zhekov S. A., Güdel M., Schmutz W., 2015, ApJ, 799, 124
- Smith et al. (2013) Smith K. T., Fossey S. J., Cordiner M. A., Sarre P. J., Smith A. M., Bell T. A., Viti S., 2013, MNRAS, 429, 939
- Szentgyorgyi & Furész (2007) Szentgyorgyi A. H., Furész G., 2007, in Kurtz S., ed., Revista Mexicana de Astronomia y Astrofisica Conference Series Vol. 28, Revista Mexicana de Astronomia y Astrofisica Conference Series. pp 129–133
- Tuthill et al. (1999) Tuthill P. G., Monnier J. D., Danchi W. C., 1999, Nature, 398, 487
- Underhill et al. (1990) Underhill A. B., Gilroy K. K., Hill G. M., 1990, ApJ, 351, 651
- Walborn & Fitzpatrick (2000) Walborn N. R., Fitzpatrick E. L., 2000, PASP, 112, 50
- Weselak et al. (2010) Weselak T., Galazutdinov G. A., Han I., Krełowski J., 2010, MNRAS, 401, 1308
- Wright et al. (2015) Wright N. J., Drew J. E., Mohr-Smith M., 2015, MNRAS, 449, 741
- van der Hucht (2001) van der Hucht K. A., 2001, New Astron. Rev., 45, 135