Weak lensing of the Lyman-alpha forest
Abstract
The angular positions of quasars are deflected by the gravitational lensing effect of foreground matter. The Ly forest seen in the spectra of these quasars is therefore also lensed. We propose that the signature of weak gravitational lensing of the Ly forest could be measured using similar techniques that have been applied to the lensed Cosmic Microwave Background, and which have also been proposed for application to spectral data from 21cm radio telescopes. As with 21cm data, the forest has the advantage of spectral information, potentially yielding many lensed “slices” at different redshifts. We perform an illustrative idealized test, generating a high resolution angular grid of quasars (of order arcminute separation), and lensing the Ly forest spectra at redshifts using a foreground density field. We find that standard quadratic estimators can be used to reconstruct images of the foreground mass distribution at . There currently exists a wealth of Ly forest data from quasar and galaxy spectral surveys, with smaller sightline separations expected in the future. Ly forest lensing is sensitive to the foreground mass distribution at redshifts intermediate between CMB lensing and galaxy shear, and avoids the difficulties of shape measurement associated with the latter. With further refinement and application of mass reconstruction techniques, weak gravitational lensing of the high redshift Ly forest may become a useful new cosmological probe.
keywords:
cosmology: observations1 Introduction
Gravitational lensing has emerged as one of the best ways to probe the structure of the Universe and to test cosmological models. The distortion of background images as they are lensed by foreground matter is sensitive to both the matter contents and the geometry of the Universe (e.g., Blandford and Narayan 1992, Hoekstra and Jain 2008). Galaxy images are the most commonly studied cosmological sources (see Kilbinger 2015 and references therein), but the cosmic microwave background (CMB) is also lensed, and can also be used to reconstruct the foreground lensing mass distribution (see e.g., the review by Lewis and Challinor 2006). The Planck satellite has recently enabled all-sky, low fidelity mass maps to be made from CMB lensing (Ade et al. 2015), and the promise of these techniques has prompted interest in future instruments (e.g., Wallis et al. 2016). Another background source field which has promise is 21cm radiation from the epoch of reionization (e.g., Combes et al. 2015), and from galaxies at lower redshifts (e.g., Chang et al. 2010). Techniques used to study CMB lensing have been adapted and generalized to the three dimensional data expected from future 21cm surveys (Zahn and Zaldarriaga 2006 [hereafter ZZ06], and Metcalf and White 2007 at high redshift, and Pourtsidou and Metcalf 2014 for lower ). In the present paper, we introduce a new background source for weak lensing studies in cosmology, the Ly forest.
The Ly forest of absorption features due to neutral hydrogen can seen in the spectra of both quasars (Rauch 1992) and galaxies (e.g., Savaglio et al. 2002). We refer to quasars and galaxies as “backlights” rather than “sources” in what follows, in order to avoid confusion with the “sources” in gravitational lensing (which will be the Ly forest here). At the redshifts () where the Ly transition is in the optical wavelength range, the forest absorption mostly arises in the moderately overdense (of order the cosmic mean) intergalactic medium (IGM) (Bi 1993, Cen et al. 1994, Zhang et al. 1995, Hernquist et al. 1996). This intergalactic medium is a continuous field, and as such Ly forest spectra can be thought of as a collection of one-dimensional “intensity maps” (e.g., Wyithe and Morales 2007) of the matter distribution at high redshift. Its properties are well studied and it is relatively easy to simulate numerically (see e.g., Bolton et al. 2017). The forest has been used to test cosmological models, for example through the influence of the neutrino mass on large-scale structure (e.g., Palanque-Delabrouille et al. 2015, Croft et al. 1999). With a high enough angular density of quasars, three dimensional statistics can be evaluated by using information from multiple sightlines, enabling clustering measurements (Slosar et al. 2011) and detection of baryon oscillations (Busca et al. 2013, Slosar et al. 2013). The collection of one-dimensional skewers can also be used to make continuous three dimensional maps using a variety of interpolation techniques (Pichon et al. 2001, Cisewski et al. 2014), and with even more numerous star forming galaxies as background spectra these can be made with angular resolution close to arcminute scales (Lee et al. 2014).
The Ly forest, being measured from spectra has a precisely known source redshift. This fact is also advantageous for lensing of the CMB, enabling analyses to be free of uncertainties in the redshift distribution of sources which affect galaxy weak lensing studies (Hearin et al. 2010). The CMB is also continuous, with statistical properties which make it very close to a Gaussian random field. This property has enabled optimal estimators of the lensing mass distribution from CMB temperature and polarization fields to be constructed (Hu and Okamoto, 2002). Observational measurements of CMB lensing were first made by Das et al. (2011) and future instruments are being proposed to take advantage of the clean nature of the signal and make robust cosmological constraints.
The CMB was the first lensed intensity field to be studied, but lensing of 21cm radiation has also received much attention. Observational detections are still in the future, however. 21cm radiation is a probe of neutral hydrogen, and at high redshifts, before reionization of the IGM, it is a continuous field. At lower redshifts, the residual HI is mostly found in galaxies and by nature it becomes more Poisson distributed (Pourtsidou and Metcalf 2014). The detection of 21cm clustering in cross-correlation with galaxies by Chang et al (2010) marked the first observational result in the field of “intensity mapping”. Many 21cm telescopes are being built, such as CHIME (Recnik et al., 2015) and SKA (Combes et al. 2015, Santos et al., 2015), and the possibilities of 21cm lensing measurements from these are being explored. The effects of lensing on the statistical properties of the 21cm signal were studied by Pen (2004) and Cooray (2004). ZZ06 and Metcalf and White 2007 developed estimators of the lensing mass distribution by analogy with those developed for CMB lensing. The three dimensional nature of the data (spectral 21cm datacubes) mean that much more information can in principle be extracted from 21cm lensing than the CMB, and we can expect that some of this advantage will be transferred to the Ly forest. Many aspects of the matter reconstruction techniques for 21cm (under certain simplifying assumptions) will also apply to the Ly forest, and in this paper we will make use of this to give some illustrative examples of the potential of Ly forest lensing.
Raytracing simulations of 21cm lensing images were first made by Hilbert et al. (2007), who added the noise expected from the Metcalf and White 2007 estimators. Full simulations of 21cm lensing and foreground mass reconstruction were made by Romeo (2015), (see also Romeo et al., 2017). Here we will use the same simulation and reconstruction techniques for this preliminary work on the Ly forest. In particular, we will make the simplifying assumption that the Ly forest spectra are arranged on a regular grid, so that the FFT based techniques from 21cm analysis (e.g., ZZ06) can be used without modification. Estimators of the foreground matter distribution with irregularly spaced sightlines can be developed (Metcalf et al., in prep.), and we plan to apply these in future work.
In this paper we also do not aim to simulate particular planned surveys or make forecasts. In a companion paper (Metcalf et. al 2017), however, we make quantitive estimates of the expected precision of Ly forest lensing measurements for a range of datasets. Future Ly forest surveys such as DESI (Aghamousa et al. 2016) will contain close to a million spectra with sightlines spaced on average 7-8 arcmins apart. Others, such as the ongoing CLAMATO survey will cover a small sky area ( sq. degree) with higher angular resolution ( arcmin separation). Here we carry out a small simulation test of foreground mass estimation from the forest to show how these techniques can be applied, and leave realistic survey geometries and sightline densities to other work (such as Metcalf et al 2017). We also will only treat widely separated source and lens fields, and not consider self-lensing by the forest as was done by Loverde et al. (2010).
Our outline of the paper is as follows. In Section 2.1 we describe the Ly forest as a source field for weak gravitational lensing. We explain the relevant lensing geometry and show how it is related to, and different from the situation for 21cm lensing. In Section 2.3 we introduce the lensing reconstruction quadratic estimator, again taken from 21cm lensing in the present case. Section 3 describes our test of gridded data, outlining how the source and lens fields are generated. Subsection 3.4 details the lens reconstruction from the lensed Ly forest in our test and shows results. In Section 4 we summarize the paper and conclude with a discussion of what will be possible in the future.
2 Weak gravitational lensing of the Ly forest
2.1 The Ly forest as a source field
The IGM at redshifts is almost completely photoionized, by an ultraviolet background radiation field dominated by the integrated light of quasars (e.g., Haardt and Madau 2012). Simulations (Cen et al. 1994, Zhang et al. 1995, Hernquist et al. 1996). and analytic models (Bi 1993, Bi and Davidsen 1997) have shown that in the standard cosmological model the forest is generated by residual neutral hydrogen in this photoionized medium. This medium fills the space between galaxies with absorbing material, and its structure on scales larger than the Jean’s scale traces the overall matter density. The physical processes governing the state of the IGM are simple, and its absorption properties are those first described by Gunn and Peterson (1965), leading to its characterization as the “Fluctuating Gunn-Peterson Effect” (Weinberg et al. 1997).
The Ly forest of absorption features was first observed in the spectra of background quasars (Lynds and Stockton 1966). It has also been seen in the spectra of galaxies (e.g., Lee et al. 2014), but in each case provides an irregular sampling of the IGM, consisting of one-dimensional skewers extending towards the observer from the emitting object. The useful dimension in wavelength from that of the Ly transition to the Ly transition, together with redshift range where there are numerous quasars available means that redshifts are the most studied for cosmology. Using the Ly forest as a background field for lensing will therefore mean that higher redshifts are available than for galaxies, the redshift distributions of which peak between for surveys such as LSST, Euclid and WFIRST (Pearson et al. 2014).
The discrete nature of Ly forest sightlines means that a dataset made from a compilation of quasar or galaxy spectra will have some different statistical properties from a true intensity map made from e.g., 21cm data. Density fluctuations on scales smaller than the separation between sightlines will add a stochastic component to the Ly forest signal. When three dimensional maps from spectra are made with interpolation techniques (Pichon et al. 2002), techniques such as Weiner filtering are used to deal with this noise and yield maps which are smooth on scales below the mean sightline spacing. The Jean’s pressure smoothing scale of the forest is around 500 comoving at these redshifts (Peeples et al. 2010), so that any dataset with mean transverse sightline separation greater than this will be affected by the stochastic component. The noise characteristics along Ly forest sightlines on the other hand are dominated by photon counting noise. With the brightest quasars and large telescopes, spectra with per pixel signal to noise ratios of 100 or more can be obtained (e.g., Kim et al. 2004). For large-scale surveys of quasars, however, S/N of order unity in pixels of size 1 Å is more typical (Lee et al. 2013). There is also a long-wavelength component of noise which comes from continuum fitting. By contrast, the noise properties of 21cm observations are dominated by foreground removal (e.g., galactic synchrotron), and by sky and receiver noise. The foreground emission far overpowers the signal and removing it from the data will be challenging.
When dealing with Ly forest clustering it is customary to define the “flux overdensity”, , where
| (1) |
is a quantity with zero mean.
2.2 Lensing geometry
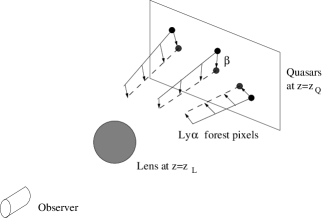
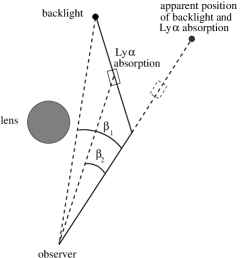
The Ly forest at redshift is lensed by the matter distribution lying between us and . Gravitational lensing shifts the observed positions of points on the sky without changing their surface brightness. In the case of the Ly forest, this means that the quasar or galaxy backlights move on the plane of the sky. The angular sizes of quasars are magnified (through the change in their angular sizes). This magnification of quasars through lensing is well studied, from the first observed lenses, which created multiple quasar images (Walsh et al. 1979), through weak lensing magnification of quasars detected by cross-correlation with foreground galaxies (e.g., Scranton et al. 2005). The magnification of quasars will cause some selection biases which will affect the topic of this paper, and which we will return to in Section 4.2. Directly relevant to Ly forest lensing, however are distortions of the angular separations between quasars, caused by the lensing deflection of light. Because the quasar angular positions move on the plane of the sky, this means that the Ly forest skewers associated with each quasar also shift as the parent quasar does (assuming that the lensing takes place at lower redshifts which is a well justified approximation). Gravitational lensing therefore distorts the ”image” of the IGM probed by the Ly forest without changing the transmitted flux measured in each pixel. This is directly analogous to the effect of lensing on 21cm emission (or the CMB), which conserves surface brightness. In Figure 1 we illustrate this with a diagram, which shows the Ly forest pixels being deflected in a similar fashion to the quasar backlights. In Figure 2 we concentrate on a single backlight and Ly forest pixel and show the relationship to the unlensed angular positions of both. The pixel and the backlight are at different angular size distances, and so are displaced on the sky by different angles.
If the lensing deflections are small compared to structure in the source, the Ly forest flux overdensity at wavelength can be expressed as a Taylor expansion of the unlensed .
| (2) |
This expansion is valid in the case of the Ly forest, where gradients in can be large, but the deflections (or deflection gradients) are small compared to them on all scales of interest. The deflection field is related to the 2D projected lensing potential via , in the weak lensing limit. This lensing potential can be computed from the full 3D gravitational potential (e.g, Bartelmann & Schneider 2001) by an integration over redshift:
| (3) |
where is the angular size distance to redshift and is the angular size distance between redshifts and .
The 3D spectrum of Ly forest fluctuations is given by (McDonald 2003):
| (4) |
where is the underlying dark matter power spectrum and is the cosine of the angle between the wave vector and the line of sight . and are parameters that describe the relative bias between flux and matter fluctuations and the strength of redshift distortions respectively. In the case of galaxies, which are conserved under redshift distortions, where is the linear growth rate (Kaiser 1987). For the Ly forest, which undergoes a non-linear transformation between flux and optical depth (which is conserved), is a separate parameter. At the redshifts of interest, is approximately and unity (Slosar et al. 2011).
2.3 Lensing reconstruction: Quadratic estimator
The quadratic lensing estimator for the CMB (or a slice of Ly forest pixels at single redshift) is sensitive to variations in the power spectrum for different regions of the sky. These spatial variations result in correlations in Fourier modes (or ’s) that would not exist otherwise.
The effect of lensing can be divided into shear that leads to anisotropy of the local power spectrum, and an isotropic magnification. If the power-spectrum is scale free (), the magnification cannot be determined with a quadratic estimator. Additionally, the shear cannot be measured if the power-spectrum is constant. The projected matter (and Ly forest) power-spectrum in the CDM model is approximately constant on large scales (small ) and is at small scales. A quadratic lensing estimator will therefore be sensitive to magnification on large scales, shear on small scales and a combination of both for intermediate scales.
Unlike the CMB, the Ly forest is observable at different redshifts, with a range dependent on the wavelengths that can be observed and the availability of backlight quasars or galaxies. If we treat the forest as a sparsely sampled three-dimensional dataset, we can slice it on the basis of redshift. A three-dimensional lensing estimator then effectively stacks information for slices of the forest at different redshift. The lensing is coherent for different slices at the same angular position, but the intrinsic correlations of the Ly forest are governed by the CDM power spectrum (independent Fourier modes in the linear theory case we are considering). The excess coherent correlations can be attributed to lensing. This is a very similar situation to that which occurs in 21cm lensing.
The Ly forest fluctuations, , in the radial direction are subject to the finite size in wavelength of observed pixels. They can therefore be expressed in discrete Fourier space, (wave vector , where is the depth of the observed volume). Fluctuations perpendicular to the line of sight (wave vector where the angular diameter distance to the source redshift and is the dual of the angular coordinate on the sky) are subject to the limitations of the angular density of backlights. In the simplified example cases we consider here, we will assume that there is a high enough density of backlights that we are able to use a continuous Fourier space representation perpendicular to the line of sight. Development of an estimator which treats the sparseness and irregularity of angular sampling is left to future work (Metcalf et al., in preparation).
An optimal quadratic estimator for lensing using the CMB was developed by Hu and Okamoto (2002) which involves a convolution in Fourier space. As shown by Anderes (2013), Lewis & Challinor (2006) and Carvalho & Moodley (2010), this is equivalent to a real space product of the high-pass filtered fields. Calculating the product in real space allows one to take advantage of Fast Fourier Transform techniques and significantly speeds up the estimation. As pointed out by Lewis & Challinor (2006) (again in the context of the CMB), seen from this point of view, the estimator measures the correlations in the product of two Wiener filtered fields, the gradient field , and a small-scale weighted and filtered version of .
In the context of Ly, or 21cm emission, this estimator for the gravitational potential can be written as (dropping the subscript in for simplicity)
| (5) |
where and are the DFT of
| (6) |
This is a configuration space version of the estimator given by ZZ06 as derived in Romeo et al., (2017). The estimated noise in this estimator is
| (7) |
where
| (8) |
is the total power spectrum: , plus the power spectrum of the noise, . For further details we refer the reader to Romeo (2015) and Romeo et al . (2017) for details related to this form of the estimator.
In the present paper, as we make the simplifying assumption that the Ly sightlines are distributed on a grid, the 21cm reconstruction techniques used in Romeo (2015) are directly applicable. We will also simulate a higher density of sightlines than most current surveys.
3 Test on gridded data.
In this section, we carry out a test of reconstruction of the lensing mass distribution in an idealized and simplified case. These simplifications include a high density of parallel sightlines, with all backlights (quasar or galaxy) on a grid, and at the same redshift. We also use Gaussian random fields to model both the foreground lens and the source fields. Our aim is to illustrate the potential of Ly forest lensing. We leave more realistic simulations and the development of mass estimators which are able to deal with more complex geometries (and sparser sightlines) to future work. The generation of the source and lens fields are modeled largely on techniques used to simulate 21cm fluctuations in Romeo (2015) and Romeo et al. (2017), and the reader is referred to them for more details.
3.1 Source field
We use the Ly forest at redshifts between and as a source field. The forest is generated by mass fluctuations which are within an order of magnitude of the cosmic mean (Bi, 1993), and we choose to model the field using linear theory, as a Gaussian random field. In the future, lognormally transformed fields (Bi & Davidsen 1997, Le Goff, 2011), large hydrodynamic simulations (e.g., Cisewski et al 2014), or hybrid methods (Peirani et al. 2014) should be used to model the truly quasilinear nature of the forest (and to test the response of the estimators).
The Ly forest flux fluctuations are biased with respect to the matter fluctuations . The power spectra of the two are related in linear theory as in equation 4. Gaussian random density fields into Ly forest flux fields. This direct conversion of an isotropic field into another is a simplification, as we are not including only Kaiser-form redshift distortions. This neglects the effects of velocity dispersion and thermal broadening, both of which act to smooth structure along the line of sight. Again, these are not expected to qualitatively affect our test and are left to future work.
The linear power spectrum we use is that of a Cold Dark Matter universe with the parameters given by the Planck 2015 data release (Ade et al., 2016). We simulate a sky area of 15 by 15 degrees, with angular pixels. The pixel size of 1.8 arcmins corresponds to a comoving length scale of 2.2 comoving at redshift . This is larger than the relevant Jeans smoothing scale of the forest (of order 0.5 at this redshift, Peeples et al. 2010). The effects of fluctuations on scales intermediate between our resolution and the Jeans scale are therefore missing from our simulation. In order to include their effects, we could simulate the forest field with a high enough density of grid points to resolve the Jeans scale and then subsample sightlines to yield the required sightline density. An alternative, would be to assume that the missing fluctuations would add to the grid in a similar fashion to noise. In practice, neither is necessary for the illustrative example in this paper because we average the forest pixel in slices of thickness greater than comoving, and this averaging smooths out the small scale fluctuations. The rms fluctuations on scales are approximately , based on the correlation function measurements of Croft et al. ( 2002) at ., and this is comparable to the rms fluctuations in our generated field.
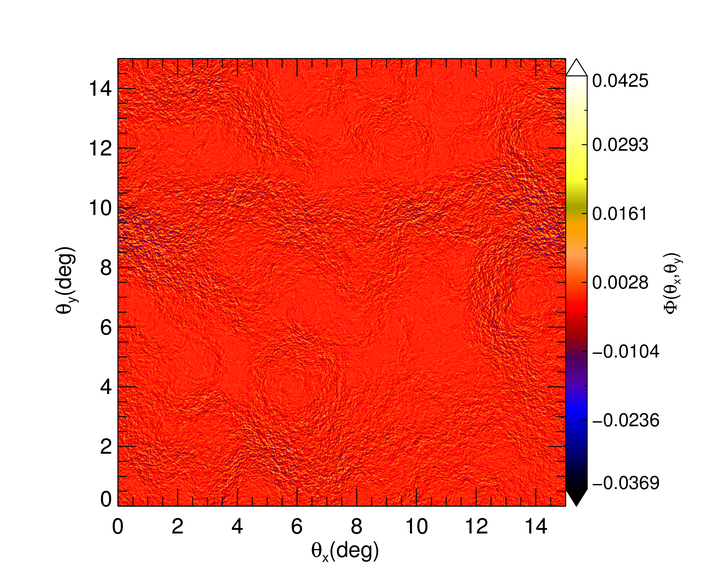
3.2 Lens field
As we will see, the lensing field will be detected only on large angular scales where the matter structure responsible for the lensing is linear to a very good approximation and thus well represented by a Gaussian random field. We create a realization of the lensing potential by generating random Gaussian distributed Fourier modes with the power spectrum expected in the same cosmology used to simulated the lya forest source fields. An image of the lensing potential can be seen in figure 3 for a 15 by 15 degree patch of the sky. The deflection is found by taking the gradient of the potential use the FFT (Fast Fourier Transform). Points on the source planes are then displaced by the deflection and interpolated back onto a regular grid to get the lensed image. A plane approximation is used here which is not overly accurate on the scales considered here, but for our purposes a less than 10% inaccuracy is not important.


3.3 Mass reconstruction
The lensing potential estimator, (5), is applied to the lensed Ly data cube. We approximate the noise in each spectral pixel as being independent with a power spectrum
| (9) |
where is the total volume spanned by the Ly data and is the total number of pixels. This ignores variations in the noise between different backlights and at different redshifts. It also ignores possible correlations between pixels coming from the fitting and subtraction of the backlights’ continuum spectra. These complications are unlikely to present a significant problem, having already been tackled by groups measuring baryon oscillations from the forest. We will addressed them in the context of forest lensing in future work.
3.4 Results
We preformed simulations to see how well an image of the lensing potential could be recovered. We used a 15 by 15 degree field with 512 pixels on a side. The input lensing potential is shown in figure 3 as described in section 3.2. A single slice through the Ly is shown in figure 4. Figure 5 shows the same slice after being lensed. The difference is difficult to see by eye so Figure 6 shows the difference between these maps. One can see clear patterns that are related to the input potential. Figure 7 shows the recovered lensing potential. By comparing 7 with 3, it can be seen that the large scale morphology of the potential fluctuations on a scale of several degrees are well recovered.

4 Summary and discussion
4.1 Summary
We have introduced the concept of weak gravitational lensing of the Ly forest as a potentially detectable effect. Using simulations of Gaussian random fields as both source and lens, and simplified planar geometry, we have shown that it will likely be possible to reconstruct images of the foreground mass distribution given a sufficiently large and dense sample of quasar and galaxy spectral data.
4.2 Discussion
Weak lensing of the Ly forest has some potential advantages over other lensing probes. Compared to galaxies, the forest offers a higher redshift source field, and well known source redshifts. Compared to the CMB, the data is three dimensional, with many source planes, and compared to 21cm, there is data available now, and the signal is not dominated by astrophysical foregrounds. Unfortunately the forest has several disadvantages, such as the fact that it sparsely samples the source density field. Without further tests with more realistic geometries and samples it is not clear how useful the Ly forest will be as a cosmological tool. Neverthless, relevant data will be taken in the future, and in the best scenario the lensing of the forest could enable robust cosmological constraints on quantities such as the neutrino mass, as has been forecast for CMB lensing (e.g., Abazajian et al. 2016).
| Dataset | When | Area | N_spectra | mean separation |
|---|---|---|---|---|
| BOSS DR12 | 2016 | 10,000 sq. deg. | 160,000 | 15 arcmin |
| eBOSS | 2014-2018 | 7,500 sq. deg. | 270,000 | 10 arcmin |
| CLAMATO | 2014-2018 | 0.8 sq. deg. | 1,000 | 1.7 arcmin |
| WEAVE | 2018-2020 | 6,000 sq. deg. | 400,000 | 7.5 arcmin |
| DESI | 2018-2023 | 14,000 sq. deg. | 770,000 | 8.1 arcmin |
| Subaru PFS | 2019-2022 | 15 sq. deg. | 7,400 | 2.7 arcmin |
| MSE | 2025- | 1,000 sq. deg. | 1,000,000 | 1.9 arcmin |
So far we have not discussed systematic biases in mass reconstruction from forest lensing. One can imagine that the magnification of quasar and galaxy backlights by the same lensing mass one is trying to reconstruct could cause biases. Quasar lensing magnification has been the subject of extensive studies (e.g., Scranton et al. 2005), and how lensing will affect the locally determined luminosity function is well understood. The selection of sightlines to quasars or galaxies will depend on their magnification, and as this depends on the foreground mass, the sampling and the signal to noise of source spectra will be correlated with the lensing mass. The effect of this on measurement bias on mass reconstruction from the forest should be be explored (see the related effect on galaxy lensing studied by Liu et al. 2014) The same issues will also arise because of lenses in the forest itself. As the lensing kernel is broad, the Ly forest could have a detectable influence on the observed magnitude of quasars. Loverde et al. (2010) have studied how this causes a measurement bias and also how it could be detected by cross-correlating Ly forest flux statistics and quasar magnitudes.
Many of the problems which affect measurement of cosmic shear with galaxy shapes are unlikely to affect the Ly forest. For example, the sphericalisation and bias due to atmospheric seeing (e.g., Weinberg et al. 2013) is likely to be acting on scales much smaller than the separation between galaxy and quasar sightlines. Some non-lensing alignments are likely to persist, however, such as gravitational-intrinsic alignment correlations (Hirata and Seljak 2004).
Many improvements must be made to the simplified simulations we have used here in order to truly test Ly forest lensing, and also to investigate the strength of the biases we have mentioned above. These improvements should cover both the source and the lens fields. In the case of the Ly forest source, we have used Gaussian random fields, but the observed forest, being in the quasi-linear regime has a close to log normal probability distribution (Bi and Davidsen 1997). Log normal transformed Gaussian random fields could be used to make more realistic simulations as well as physical effects such as thermal broadening. Simulation techniques exist (e.g., Peirani et al 2014) which can be used to make extremely large forest data sets by combining dark matter n-body simulations and information from hydrodynamic models. In the future, fully hydrodynamic simulations will eventually be run which cover the large sky area needed.
We have also used Gaussian random lens fields in this paper. Models based on raytraced n-body simulations are a more realistic alternative. The Multi-Dark Lens simulations (Giocoli et al. 2016) are available, for example, and the GLAMER (Metcalf and Petkcova 2014) raytracing code can be used to compute lens maps at higher redshifts than have been done for galaxy sources.
Mock Ly forest observations are also needed for true tests, and these should include realistic geometries, with sightlines converging on an observer, and with non-uniform sampling on the plane of the sky. The number density of sightlines should also be varied widely, as the density used in this work (of the order of 1 sightline per square arcminute) is at the extreme high end, two orders of magnitude larger than currently available datasets such as BOSS and eBOSS (Dawon et al 2013, 2016). We have also only simulated a few square degrees of sky area, and can therefore hope that statistical studies of larger areas will benefit from the greater total number of spectra. This again is something which larger, more realistic mocks will help determine. Mock observations should also include various sources of noise, from photon shot noise to large-scale variations caused by continuum fitting errors. Metal lines should also be evaluated as a source of contamination as they are in Ly forest clustering measurements (Bautista et al 2016).
In order to deal with realistic geometries, a more inclusive estimator is needed. We are currently developing such an estimator, and plan to apply it to observational data. The field of Ly forest observations is opening up rapidly as large datasets are being made publicly available and new instruments are being planned. The largest current dataset in terms of number of spectra forms part of the twelfth data release (DR12) of SDSS/BOSS. We show in Table 1 some current and future Ly forest datasets which could be used to carry out lensing studies. Although the mean separation of sightlines in current and ongoing surveys is relatively large ( arcmins or more), values close to one arcminute could be achievable with highly multiplexed observations of galaxy spectra on future large telescopes. Such observations may offer a route to precision cosmology from Ly forest lensing.
Acknowledgments
RACC is supported by NASA ATP grant NNX17AK56G. AR and RBM have been supported partly through project GLENCO, funded under the European Seventh Framework Programme, Ideas, Grant Agreement n. 259349.
References
- [1]
- [] Abazajian, K.N., 2016, CMB-S4 Science Book, First Edition, arXiv:1610.02743 [astro-ph.CO].
- [] Ade, P., et al. (Planck Collaboration), 2015, A&A 594, A15
- [] Aghamousa, A., et al. (DESI Collaboration), 2016, preprint, arXiv:1611.00036
- [] Bi, H, 1993, ApJ 405, 479
- [] Bi, H., and Davidsen, A.F., 1997, ApJ, 479, 523
- [] Blandford, R., and Narayan, R., 1992, Annu. Rev. Astron. Astrophys. 1992. 30: 311-358
- [] Bolton, J. S., Puchwein, E., Sijacki, D., Haehnelt, M. G., Kim, T.-S. Meiksin, A., Regan, J. A. and Viel, M., 2017, MNRAS, 464, 897
- [] Busca, N.G., et al. 2013, A&A, 552, 96
- [] Cen, R. Miralda-Escudé, J., Ostriker, J. P. and Rauch, M., 1994, ApJ, 437, L9
- [] Chang, T.-C., Pen, U.-L., Bandura, K., and Peterson, J.B., 2010 Nature, 466, 463
- [] Cisewski, J., Croft, R.A.C., Freeman, P.E., Genovese, C.R., Khandai, N., Ozbek, M., Wasserman, L., 2014, MNRAS, 440, 2599
- [] Combes, F., 2015, Journal of Instrumentation, Volume 10, Issue 09,
- [] Cooray, A., 2004, New Astronomy, 9, 173
- [] Croft, R.A.C., Hu, W., and Dav’e, R., 1999, PRL, 83, 1092
- [] Dalton, G.B., et al. 2012, Proceedings of the SPIE, Volume 8446, id. 84460P 12
- [] Das, S., et al. 2011, PRL, 107, 1301
- [] Dawson K., et al. 2013, AJ 145, 10
- [] Dawson K., et al. 2016, AJ 151, 44
- [] Giocoli, C., Meneghetti, M., Metcalf, R.B.,, Ettori, S., and Moscardini, L., 2014, MNRAS, 440, 1899
- [] Gunn, J.E., and Peterson, B.A., 1965, ApJ, 142, 1633
- [] Haardt, F., and Madau, P., 2012, ApJ 784 L38
- [] Hearin, A.P., Zentner, A.,R., Ma. Z. and Huterer, D., 2010, ApJ, 729, 1351
- [] Hernquist, L., Katz, N., Weinberg, D.H. and Miralda-Escud’e, J., 1996, ApJ, 457, L51
- [] Hilbert, S., Metcalf, R.B., and White, S.D.M., 2007, MNRAS, 382, 1494
- [] Hirata, C.M., & Seljak, U., 2004, PRD, 70, 3501
- [] Hoekstra, H., and Jain, B., 2008, Annual Review of Nuclear and Particle Science, 58, 99
- [] Hu, W., and Okamoto, T., 2002, ApJ, 574, 566
- [] Kaiser, N., 1987, MNRAS, 227, 1
- [] Kilbinger, M., 2015, Rep. Prog. Phys. 78 086901
- [] Kim, T.-S., Viel, M., Haehnelt, M., Carswell, R.F., and Cristiani, S., 2004, MNRAS, 347, 355
- [] Lee, K.-G., et al. 2013, AJ, 145, 69
- [] Lee, K.-G., et al. 2014, ApJ Lett., 795, L12
- [] Le Goff, J.M., et al. 2011, A&A 534, 135
- [] Lewis, A. and Challinor, A., 2006, Phys.Rept. 429 1-65
- [] Liu, J., Haiman, Z., Hui, L., Kratochvil, J.M., and May, M., 2014, Phys. Rev. D 89, 023515.
- [] Loverde, M, Marnerides, S., Hui, L., Ménard, B., Lidz, A., PRD, 82,3507
- [] Lynds, C.R., and Stockton, A.N., 1966, ApJ, 144, 446
- [] McDonald, P., 2003, ApJ, 585, 34
- [] Metcalf, R.B., and White, S.D.M., 2007, MNRAS 381, 447
- [] Metcalf, R.B., and White, S.D.M., 2009, MNRAS 394, 704
- [] Metcalf, R.B. and Petkova, M., 2014, MNRAS, 445, 1942
- [] Metcalf, R.B., Croft, R.A.C., and Romeo, A., 2017, MNRAS, submitted
- [] Palanque-Delabrouille, N., et al., 2015, JCAP, 11, 11
- [] Pearson, R. et al. 2014 Phys.Rev. D 89 no.4, 043516
- [] Peeples, M.S., Weinberg, D.H., Davé, R., Fardal, M., Katz, N., 2010, MNRAS, 404, 1281
- [] Peirani, S., Weinberg, D.H., Colombi, S., Balizot, J., Dubois, Y., Pichon, C., 2014, ApJ, 784,11
- [] Pen, U.-L., 2004, New Astronomy, 9, 417
- [] Pichon, C., Vergely, J.L., Rollinde, E., Colombi, S., and Petitjean, P., 2001, 326, 597
- [] Pourtsidou, A., and Metcalf, R.B., 2014,MNRAS, 439, L36
- [] Rauch, M., 1998, ARA&A, 36, 267
- [] Recnik, A., et al. 2015, IEEE ASAP, in press, arXiv:1503.06189
- [] Romeo, A., 2015, PhD. thesis, University of Bologna
- [] Romeo, A., Metcalf, R.B., Pourtsidou, A., 2017, MNRAS, submitted.
- [] Santos, M., et al. 2015, Proceedings of Advancing Astrophysics with the Square Kilometre Array (AASKA14). 9 -13 June, 2014. Giardini Naxos, Italy, arXiv:1501.03989
- [] Savaglio, S, Panagia, N., Padovano, P., ApJ, 567, 702
- [] Scranton, R., et al., 2005, ApJ, 633, 589
- [] Slosar,A. et al., 2011, JCAP, 09, 01
- [] Slosar, A., et al., 2013, JCAP, 04, 026
- [] Takada, M., et al., 2012, arXiv:1206.0737
- [] Wallis, C., Brown, M. L., Battye, R.A., and Delabrouille, J., 2016, MNRAS, 466, 425
- [] Walsh, D., Carswell, R.F., and Weymann, R.J., 1979, Nature, 279, 381
- [] Weinberg, D.H., Hernquist, L., Katz, N., Croft, R., and Miralda-Escude, J, 1997, in Proc. of the 13th IAP Colloquium, Structure and Evolution of the IGM from QSO Absorption Line Systems, eds. P. Petitjean & S. Charlot, Nouvelles Frontières, Paris, arXiv:astro-ph/9709303
- [] Weinberg, D.H., Mortonson, M.J., Eisenstein, D.J., Hirata, C., Riess, A.G. and Rozo, E., 2013, Physics Reports, Volume 530, Issue 2, p. 87-255
- [] Wyithe, S.B., and Morales, M.F., 2007, MNRAS, 379, 1647
- [] Zhang, Y., Anninos, P., and Norman, M., 1995, ApJ 453, L57
- [] Zahn, O., and Zaldarriaga, M., 2006, ApJ, 653, 922