∎
[]c1Corresponding authors. E-mail: ali.murat.guler@cern.ch, Cagin.Gunes@ankara.edu.tr
Study of charged hadron multiplicities in charged-current neutrino-lead interactions in the OPERA detector
Abstract
The OPERA experiment was designed to search for oscillations in appearance mode through the direct observation of tau neutrinos in the CNGS neutrino beam. In this paper, we report a study of the multiplicity of charged particles produced in charged-current neutrino interactions in lead. We present charged hadron average multiplicities, their dispersion and investigate the KNO scaling in different kinematical regions. The results are presented in detail in the form of tables that can be used in the validation of Monte Carlo generators of neutrino-lead interactions.
1 Introduction
The multiplicity distribution of charged hadrons is an important characteristic of the hadronic final states in hard scattering processes. Since it reflects the dynamics of the interaction, it has been extensively studied in cosmic rays, fixed target and collider experiments Biebl ; PLUTO ; TASSO ; Allen ; CHORUS . These data are useful to improve models of particle production which are used in Monte Carlo (MC) event generators.
In this paper, we report the result on charged hadron production initiated in charged-current interactions in the OPERA target. The basic unit that constitutes the target is the Emulsion Cloud Chamber (ECC) detector which is a stack of nuclear emulsion films acting as high precision trackers interleaved with lead plates that provide a massive target. The excellent spatial resolution of nuclear emulsion allows the determination of the event topology and the measurement of charged particle trajectories. Therefore, it is well suited for the investigation of the moments of the charged particles multiplicity distribution. However, only few studies of charged particle multiplicity in neutrino-nucleon interactions were made using the nuclear emulsion technology CHORUS ; Voyvodik ; Aleshin .
In the following, a short description of the experimental setup and of the procedure used to locate neutrino interactions in the target is given; the data sample and the analysis procedure are presented. Then, multiplicity moments and investigation of KNO scaling Koba in different kinematical regions are presented in a form suitable for the validation of MC generators of neutrinolead interactions.
2 Experimental Procedure
The OPERA experiment has been designed for the observation of oscillations in appearance mode in the CNGS (CERN Neutrinos to Gran Sasso) neutrino beam. The detector was located at the underground Gran Sasso Laboratory (LNGS) in Italy. It was exposed to the CNGS muon neutrino beam with mean energy 17 GeV at a distance of km. OPERA reported the discovery of appearance with a significance of 5.1 OPERAprl . The OPERA detector is a hybrid setup consisting of electronic detectors and a massive lead-emulsion target segmented into ECC units, called bricks. The detector is composed of two identical Super-Modules, each of which has a target section followed by a muon spectrometer which is composed of a dipole magnet instrumented with resistive plate chambers and drift tubes. Each target section has 31 brick walls interleaved with orthogonal pairs of scintillator strip planes that compose the Target Tracker (TT). A detailed description of the OPERA detector can be found in operadet .
A brick consists of 57 emulsion films interleaved with 56 lead plates of 1 mm thickness. The films are made of 2 emulsion layers, each 44 m thick coated on both sides of a 205 m transparent plastic base. The brick has transverse dimensions of , a thickness of 81 mm (about radiation lengths) and it weighs 8.3 kg. A pair of removable emulsion films called changeable sheets (CS) attached to the downstream face of each brick act as interfaces between the emulsion films in the brick and the TT. There are about bricks in total for a target mass of 1.25 ktons.
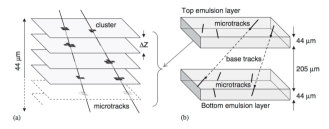
TT hit patterns are used to identify the bricks possibly containing the neutrino interaction vertex yuri . The most probable brick is then extracted from the target and its CS films scanned. If a signal compatible with the TT predictions is found, the brick is disassembled and its films analysed. Once the vertex has been located, a surrounding volume of about 2 is scanned to determine the event topology. Otherwise, the procedure is repeated in the next brick in the probability ranking. Track recognition in an emulsion layer is based on 16 tomographic images taken by the sensor of an automated microscope and equally spaced through the 44-m depth of the layer. A sequence of aligned grains in a layer forms a micro-track (Figure 1a) and the association of two matching micro-tracks on each side of the plastic base in a film constitutes a base-track (Figure 1b). Track positions and slopes are determined by a linear fit through base-tracks in the analysed volume. The details of the event analysis procedure are described in OPERAloc .
3 Analysis
During the physics runs between 2008 and 2012, OPERA collected data corresponding to x protons on target. The electronic detectors recorded neutrino interactions in the target fiducial volume. The search of the neutrino vertex in the first and second most probable bricks plus some additional selections (see OPERAloc for more details) resulted in a sample of located events out of which have an identified muon. For the present measurement an unbiased sub-sample of events occurring in the lead with a negatively charged muon identified by the muon spectrometer was selected in order to measure the track and vertex parameters in the target including a detailed check of the nuclear break-up and evaporation processes.
It is further required that , the square of the invariant mass of the hadronic system measured with the electronic detector, is larger than 1 in order to eliminate the quasi-elastic contribution. The final data sample contains 795 events with an identified muon. The contamination from neutral-current interactions in the final data sample is estimated by MC simulations to be less than .
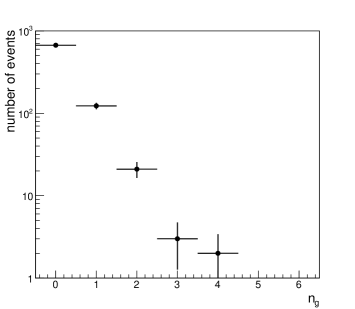
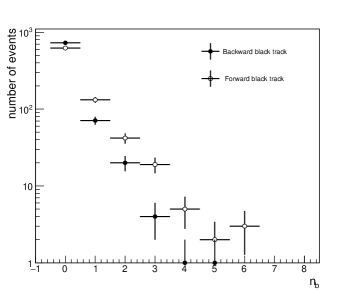
Selected CC events are inspected carefully and tracks are classified as being left by a minimum ionisation particle (mip), grey and black depending on their ionisation features. The mip tracks are left by the muon and by highly relativistic charged hadrons resulting from the cascade of interactions generated inside the target nucleus by the primary hadrons emitted with the muon at the neutrino-nucleon interaction. Black tracks are produced by low energy fragments (protons, deuterons, alpha particles and heavier fragments) emitted from the excited target nucleus. Black tracks are classified as backward or forward based on the emission direction. Grey tracks are left by slow particles which are interpreted as being recoil nucleons emitted during the nuclear cascade Powell .
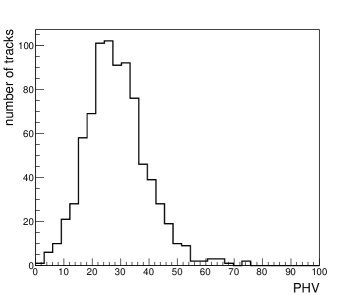
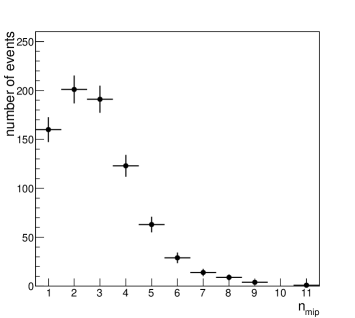
The black tracks are easy to recognise visually since they are heavily ionising, they have short path lengths and stop within two lead plates. The separation between mip and grey tracks is based on the Pulse Height Volume (PHV) Toshito ; Shin which is defined as the sum of the number of pixels associated with each track in all sixteen layers of images ccd . PHV indicates the track width and is therefore a measure of the grain density of a track that reflects the energy deposition of a particle in the emulsion film. The PHV distribution of muon tracks is shown in Figure 2. All muon tracks have a PHV below 85 and mip tracks are defined by requiring a PHV smaller than 85, the tracks with a higher PHV being classified as grey. The mip, grey and black track multiplicities are shown in Figures 3, 4 and 5, respectively. The average numbers of mip and grey tracks in events are and , respectively. The average number of backward and forward black tracks are measured to be and , respectively. The charged hadrons multiplicity is defined as the number of mip tracks excluding the muon track, its average being . The distribution of mip tracks as a function of their emission angle with respect to the beam axis is given separately for muons and charged hadrons in Table 1.
| (Radian) | /event | /event | |
|---|---|---|---|
| 0.00 0.050 | 0.031 0.001 | 0.134 | 0.070 |
| 0.050 0.100 | 0.076 0.001 | 0.258 | 0.195 |
| 0.100 0.150 | 0.126 0.001 | 0.280 | 0.231 |
| 0.150 0.200 | 0.174 0.001 | 0.237 | 0.177 |
| 0.200 0.300 | 0.246 0.002 | 0.383 | 0.195 |
| 0.300 0.400 | 0.347 0.003 | 0.298 | 0.079 |
| 0.400 0.500 | 0.450 0.004 | 0.179 | 0.029 |
| 0.500 0.600 | 0.549 0.006 | 0.113 | 0.017 |
| 0.600 | 0.661 0.03 | 0.058 | 0.002 |
| Total |
3.1 Efficiency Estimation
Reconstruction and location efficiencies are computed using the standard OPERA simulation framework. The neutrino fluxes and spectra are based on the FLUKA simulation fluka of the CNGS beam-line. The neutrino interactions in the detector are generated using the NEGN generator Autiero . MC-generated events are processed through the full OPERA simulation chain, from the event classification and brick finding provided by the electronics detectors to the CS analysis and event location and analysis in the brick.
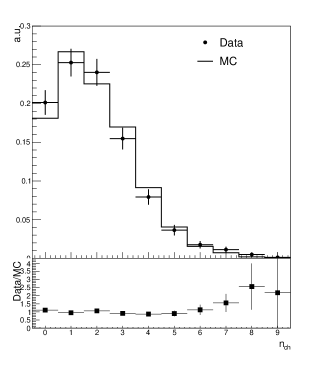
The location efficiency, shown in Table 2, of the events is estimated as a function of and of the charged hadron multiplicity. Since the event location is done using mip tracks, the location efficiency does not depend on the black and grey track multiplicities at the neutrino interaction vertex. Figure 6 shows the good agreement between the charged hadrons multiplicities obtained for observed and MC simulated data. The location efficiency correction is hereafter applied to the measured data distributions.
In interactions, neglecting the Fermi motion, the full kinematics of the event can be reconstructed from the measurement of the muon momentum , its angle with respect to the beam axis, and , the energy transfer to the hadronic system, obtained by measuring the energy deposition in the TT (detailed information is available in operadet )
where and are the energy of the incoming neutrino and the muon, the squared four-momentum transfer, and are the mass of the nucleon and muon respectively. The average neutrino energy of the data sample is = (19.6 0.3) GeV, the mean-square momentum transferred to the hadronic system is = (5.7 0.3) /, and the mean-square of the invariant mass of the hadronic system is = (16.9 0.6) .
| ) | |||||||
|---|---|---|---|---|---|---|---|
| Total | |||||||
| 1-3 | 0.32 0.03 | 0.48 0.02 | 0.53 0.04 | 0.55 0.06 | 0.56 0.09 | 0.62 0.17 | 0.46 0.01 |
| 3-6 | 0.34 0.02 | 0.47 0.02 | 0.54 0.03 | 0.56 0.04 | 0.65 0.07 | 0.66 0.11 | 0.47 0.01 |
| 6-9 | 0.33 0.02 | 0.46 0.02 | 0.56 0.02 | 0.63 0.03 | 0.67 0.06 | 0.68 0.08 | 0.48 0.01 |
| 9-12 | 0.34 0.02 | 0.49 0.02 | 0.57 0.02 | 0.62 0.03 | 0.69 0.05 | 0.66 0.07 | 0.50 0.01 |
| 12-15 | 0.36 0.02 | 0.50 0.02 | 0.58 0.02 | 0.63 0.03 | 0.70 0.04 | 0.70 0.06 | 0.52 0.01 |
| 15-19 | 0.37 0.02 | 0.49 0.02 | 0.60 0.02 | 0.62 0.02 | 0.66 0.03 | 0.74 0.05 | 0.53 0.01 |
| 19-25 | 0.40 0.02 | 0.52 0.02 | 0.56 0.02 | 0.64 0.02 | 0.66 0.03 | 0.68 0.04 | 0.54 0.01 |
| 25-35 | 0.41 0.02 | 0.56 0.02 | 0.56 0.02 | 0.60 0.02 | 0.62 0.02 | 0.69 0.03 | 0.55 0.01 |
| 35 | 0.39 0.02 | 0.39 0.02 | 0.42 0.01 | 0.43 0.01 | 0.54 0.02 | 0.57 0.02 | 0.45 0.01 |
| Total | 0.37 0.007 | 0.48 0.007 | 0.54 0.008 | 0.57 0.09 | 0.62 0.01 | 0.62 0.01 | 0.50 0.01 |
3.2 Multiplicity Distributions
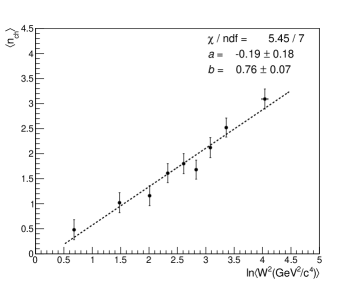
The average charged hadrons multiplicity as a function of is presented in Figure 7. The data is well described by a linear function in :
| (1) |
The values of the fitted parameters are and . Values for different bin intervals are shown in Table 3. A comparison with other experiments is given in Table 4.
| ) | ln | ||||||||||||||
|---|---|---|---|---|---|---|---|---|---|---|---|---|---|---|---|
| Total | |||||||||||||||
| 1-3 | 0.68 0.03 | 59 | 21 | 7 | 1 | 0 | 1 | 0 | 0 | 0 | 0 | 0 | 0 | 0.48 0.11 | 89 |
| 3-6 | 1.48 0.01 | 29 | 37 | 24 | 4 | 2 | 0 | 1 | 0 | 0 | 0 | 0 | 0 | 1.14 0.10 | 97 |
| 6-9 | 2.01 0.01 | 28 | 37 | 16 | 12 | 5 | 1 | 1 | 0 | 0 | 0 | 0 | 0 | 1.36 0.12 | 100 |
| 9-12 | 2.33 0.01 | 10 | 26 | 25 | 13 | 6 | 2 | 1 | 0 | 0 | 0 | 0 | 0 | 1.86 0.13 | 83 |
| 12-15 | 2.61 0.01 | 10 | 24 | 29 | 27 | 3 | 2 | 3 | 0 | 0 | 0 | 0 | 0 | 2.07 0.13 | 98 |
| 15-19 | 2.83 0.01 | 12 | 17 | 35 | 14 | 8 | 4 | 1 | 1 | 0 | 0 | 0 | 0 | 2.10 0.15 | 92 |
| 19-25 | 3.08 0.01 | 5 | 18 | 22 | 19 | 12 | 3 | 1 | 3 | 0 | 0 | 0 | 0 | 2.51 0.16 | 83 |
| 25-35 | 3.36 0.01 | 4 | 15 | 17 | 19 | 12 | 8 | 2 | 1 | 1 | 0 | 0 | 0 | 2.79 0.18 | 79 |
| 35 | 4.04 0.05 | 3 | 6 | 16 | 14 | 15 | 8 | 4 | 4 | 3 | 0 | 1 | 0 | 3.59 0.24 | 74 |
| Total | 160 | 201 | 191 | 123 | 63 | 29 | 14 | 9 | 4 | 0 | 1 | 0 | 795 |
| Reaction | (GeV) | a | b | Ref. |
|---|---|---|---|---|
| -emulsion | 38 | 0.45 0.24 | 0.94 0.08 | CHORUS |
| -emulsion | 50 | 1.92 0.68 | 1.19 0.23 | Voyvodik |
| -emulsion | 8.7 | 1.07 0.05 | 1.32 0.11 | Aleshin |
| -lead | 20 | -0.19 0.18 | 0.76 0.07 | OPERA |
3.3 Dispersion
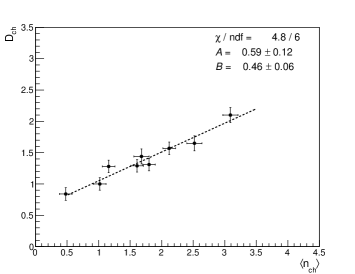
One of the characteristics of the multiplicity distribution which is of considerable theoretical interest is its dispersion. In this section we investigate its dependence on the average multiplicity. The dispersion is defined as . For independent particle production it would follow a Poisson distribution with . However, it was observed that charged particles production in hadronic interactions satisfies an empirical parameterisation shivp :
| (2) |
Figure 8 shows the dependence of the dispersion on the average multiplicity with a linear fit superimposed. The values of the fitted parameters are and . They are shown in Table 5 together with those obtained in other experiments for comparison.
3.4 KNO Scaling
Koba, Nielsen, and Olesen have shown that the multiplicity distribution scaled by the average multiplicity is asymptotically independent of the primary energy and depends only on variable :
| (3) |
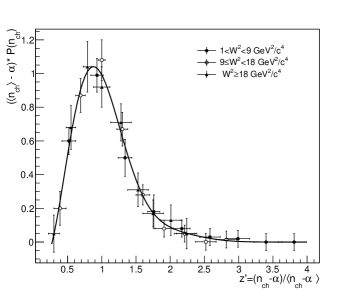
KNO scaling is derived from Feynman scaling, i.e. based on the assumption that the rapidity density reaches its limit value at y = 0 above a certain energy which corresponds to an asymptotic scaling of the total multiplicity as . KNO scaling implies that the intercept in Eq. 2 be compatible with 0, which is not the case at low to medium energies for all kinds of interactions. Buras et al. Buras have introduced a new variable defined as
| (4) |
where the reaction dependent and energy independent parameter is chosen in order to provide an extension of the KNO scaling to low energies. In the current analysis, this implies that = = 1.28. Hence
| (5) |
A tentative explanation for a non-zero value for has been proposed in terms of a leading particle effect in interactions of hadrons Stattery and of neutrinos baranov as well as resulting from the heavy nuclear targets in neutrinos experiments using emulsion CHORUS . Figure 9 shows the distributions obtained for as a function of for three different intervals of for -lead CC interactions. The fitted curve superimposed on the data results from a parameterisation of
| (6) |
The fit parameters are given in Table 6. The data shows good agreement with approximate KNO scaling. Such observation has been made by other experiments CHORUS , hebert ; hebert2 ; wroblewski ; baranov .
4 Conclusion
In this article, we studied the characteristics of the multiplicity distribution of charged hadrons in neutrino-lead interactions in the OPERA detector with the main objective to aid in tuning the models used in MC event generators. For this purpose, the results are presented in detail in the form of tables. They can be summarized as follow:
-
i
The dependence of the average multiplicity on is approximately linear.
-
ii
The dependence on the charged hadrons multiplicity of its dispersion is approximately linear.
-
iii
Approximate KNO scaling is valid for the charged hadrons multiplicity.
Acknowledgments
We acknowledge CERN for the successful operation of the CNGS facility and INFN for the continuous support given to the experiment through its LNGS laboratory. We acknowledge funding from our national agencies: Fonds de la Recherche Scientifique-FNRS and Institut Interuniversitaire des Sciences Nucleaires for Belgium; MoSES for Croatia; CNRS and IN2P3 for France; BMBF for Germany; INFN for Italy; JSPS, MEXT, the QFPU-Global COE program of Nagoya University, and Promotion and Mutual Aid Corporation for Private Schools of Japan for Japan; SNF, the University of Bern and ETH Zurich for Switzerland; the Russian Foundation for Basic Research (Grant No. 12-02-12142 ofim), the Programs of the Presidium of the Russian Academy of Sciences (Neutrino Physics and Experimental and Theoretical Researches of Fundamental Interactions), and the Ministry of Education and Science of the Russian Federation for Russia, the Basic Science Research Program through the National Research Foundation of Korea (NRF) funded by the Ministry of Science, ICT and Future Planning (Grant No. NRF-2015R1A2A 2A01004532) for Korea; and TUBITAK, the Scientific and Technological Research Council of Turkey for Turkey (Grant No. 108T324). We thank the IN2P3 Computing Centre (CC-IN2P3) for providing computing resources.
References
- (1) K.J. Biebl et al., Fortschr. Phys., V28, 124 (1980); G.J. Alner et al., Phys. Reports 154, 247 (1987); R.E. Ansorge et al., Z. Phys. C43, 357 (1989).
- (2) C. Berger et al. (PLUTO Coll.), Phys. Lett. B78, 176 (1978).
- (3) W. Brandelik et al. (TASSO Coll.), Phys. Lett. B89, 418 (1980).
- (4) P. Allen et al., Nucl. Phys. B181, 385 (1981).
- (5) A. Kayis-Topaksu et al. (CHORUS Coll.), Eur. Phys. J. C51, 775 (2007).
- (6) L. Voyvodik et al. ITEP-86-91, Moscow (1986).
- (7) Yu.D. Aleshin et al. Zh. Eksp. Teor. Fiz. 110, 391 (1996); JTEP 83, 208 (1996).
- (8) F. Koba, H.B. Nielsen and P. Olesen Nucl. Phys. B40, 317 (1972).
- (9) K. Elsener, Reports No. CERN 98-02 and No. INFN/AE-98/05, 1998; R. Bailey et al., Reports No. CERN-SL-99-034-DI and No. INFN-AE-99- 05, 1999, addendum to Reports No. CERN 98-02 and No. INFN-AE-98-05, 1998; CNGS Web site, http://proj-cngs.web.cern.ch/proj-cngs.
- (10) N. Agafonova et al. (OPERA Coll.), PRL 115, 121802 (2015).
- (11) R. Acquafredda et al. (OPERA Coll.), JINST 4, P04018 (2009).
- (12) Yu.A. Gornushkin, S.G. Dmitrievsky and A.V. Chukanov Phys. Part. Nucl. Lett. 12, 89 (2015).
- (13) N. Agafonova et al. (OPERA Coll.), J. High Energy Phys. 11, 036 (2013).
- (14) C.F. Powell, P.H. Fowler and D.H. Perkins, The Study of Elementary Particles by the Photographic Method, Pergamon Press, London (1959).
- (15) T. Toshito et al., Nucl.Instrum.Meth. A556, 482 (2006).
- (16) J. Shin et al., Nucl.Instrum.Meth. B346, 201 (2015).
- (17) K. Morishima and T. Nakano, JINST 5, P04011 (2010); C. Bozza et al., Nucl. Instrum. Meth. A 703, 204 (2013).
- (18) T.T. Bohlen et al., Nuclear Data Sheets 120, 211-214 (2014); A. Ferrari, P.R. Sala, A. Fasso, and J. Ranft, CERN-2005-10 (2005), INFN-TC-05-11, SLAC-R-773.
- (19) D. Autiero, Nucl. Phys. B139(Proc. Suppl.), 253 (2005).
- (20) R.K. Shivpuri and V.K. Verma, Z. Phys. C58, 7 (1993).
- (21) A.J. Buras et al., Phys.Lett. B47, 251 (1973).
- (22) P. Slattery, Phys. Rev. D7, 2073 (1973).
- (23) D.S. Baranov et al., Z. Phys. C21, 189 (1984).
- (24) J. Hebert et al., Phys. Rev. D15, 1867 (1977).
- (25) J. Hebert et al., Phys. Lett. B48, 467 (1974).
- (26) A. Wroblewski, Acta Phys. Polon B4, 857 (1973).