[table]capposition=top
Emergence of regular and complex calcium oscillations by inositol 1,4,5-trisphosphate signaling in astrocytes
1 Introduction
Although Ca2+ ions have been identified as a key component of astrocyte signaling in response to stimuli, and could mediate the astrocyte’s modulatory effects on the surrounding neuropile (Volterra and Meldolesi,, 2005; Araque et al.,, 2014), their functional role remains intensely debated. Arguably, one of the principal reasons for such debate is that astrocytic Ca2+ shows highly complex spatiotemporal behavior (Bindocci et al.,, 2017). In response to agonists, like hormones or neurotransmitters, and spontaneously as well, the majority of astrocytes exhibit oscillations of intracellular Ca2+ (Verkhratsky et al., 2012a, ; Zorec et al.,, 2012). These oscillations can be grouped into two major types: those that are dependent on periodic fluctuations of the cell membrane potential and are associated with periodic entry of Ca2+ through voltage-gated Ca2+ channels, and those that occur in the presence of a voltage clamp. Our focus here is on the latter type and, in particular, on the so-called process of Ca2+-induced Ca2+ release (CICR) from the astrocyte’s endoplasmic reticulum stores, which depends on cytosolic concentration of the second messenger inositol 1,4,5-trisphosphate (Verkhratsky et al., 2012b, ).
Two main types of IP3-mediated CICR are observed in astrocytes (Volterra et al.,, 2014; Rusakov,, 2015): (i) transient Ca2+ oscillations that are confined to their (primary) processes, and (ii) Ca2+ elevations propagating along these processes as regenerative Ca2+ waves, often reaching the cell soma and triggering whole-cell Ca2+ signaling (Pasti et al.,, 1997; Sul et al.,, 2004). Remarkably this latter kind of response can even propagate to neighboring astrocytes, through gap junction channels, and give rise to intercellular Ca2+ waves (Kuga et al.,, 2011). Although it is likely that different mechanisms could be in place depending on regional, developmental and physiological conditions, all these mechanisms likely depend, to some extent, on two key factors: the precise, molecular machinery underpinning IP3 signaling (Scemes,, 2001), and the underlying spatiotemporal dynamics of synaptic stimulation of the astrocyte network (Volterra and Meldolesi,, 2005).
Both production and degradation of IP3 depend on enzymes that are regulated by cytosolic Ca2+ (Berridge et al.,, 2003). These include Ca2+-dependent phsopholipase C- (PLC-)mediated IP3 synthesis and Ca2+-dependent IP3 degradation by IP3 3-kinase and by inositol polyphosphate 5-phosphatase (Zhang et al.,, 1993; Sims and Allbritton,, 1998; Rebecchi and Pentyala,, 2000). Production by PLC occurs in a regenerative fashion providing necessary IP3 amounts to promote CICR against enzymatic degradation of IP3 or rapid IP3 dilution by intracellular diffusion (Höfer et al.,, 2002; Ullah et al.,, 2006). On the other hand, while the activity of the 3-kinase is stimulated by Ca2+, the 5-phsophatase is inhibited instead (Communi et al.,, 2001), so that different mechanisms of degradation exist depending on Ca2+ concentration. In turn, these different routes for IP3 degradation have the potential to interact with PLC-mediated production in a diverse fashion, possibly ensuing in variegated IP3 and Ca2+ dynamics (Houart et al.,, 1999; Goldberg et al.,, 2010; Matrosov and Kazantsev,, 2011).
Synaptic activation also constitutes a further mechanism to trigger or modulate IP3 signaling of the astrocyte, insofar as astrocytic receptors, targeted by synaptically-released neurotransmitters, are often part of the family of -coupled receptors which, upon activation, promote IP3 production by PLC (Zur Nieden and Deitmer,, 2006). Clustering of these receptors at points of contact of synapses with astrocytic processes (Di Castro et al.,, 2011; Panatier et al.,, 2011; Arizono et al.,, 2012) provides spatially confined sites of IP3 production, whose differential activation could result in rich spatiotemporal IP3 and Ca2+ dynamics (Volterra et al.,, 2014). Nevertheless, it remains a matter of investigation, how the stochastic arrival of synaptic inputs within the anatomical domain of an astrocyte could be concerted to generate temporally precise Ca2+ signals.
Intense modeling efforts have been devoted in recent years to understand the richness of possible biophysical mechanisms underlying IP3-triggered CICR-mediated spatiotemporal dynamics in astrocytes (see Dupont, (2014) for a recent review). One of such mechanisms - intracellular IP3 diffusion - coupled with PLC-mediated IP3 production, have been suggested to crucially account for the whole spectrum of Ca2+ signaling, ranging from regular Ca2+ oscillations, to asynchronous, sparse and chaotic spatiotemporal Ca2+ dynamics (Houart et al.,, 1999; Ullah et al.,, 2006; Kang and Othmer,, 2009; Matrosov and Kazantsev,, 2011). From a modeling perspective, the functional role of these IP3 pathways are studied within the more general framework of bifurcation analysis of the dynamics of nonlinear systems, since IP3 and Ca2+ signaling represent a famed example of such systems being modeled by nonlinear differential equations (Fall et al.,, 2002). In this perspective, here we use tools of bifurcation theory to characterize dynamics of astrocytic IP3 and Ca2+ for different IP3 regimes from a mathematical point of view. We do so following a bottom-up approach, starting from a compact, well-stirred astrocyte model to first identify characteristic IP3 pathways whereby Ca2+ (and IP3) dynamics “bifurcate”, namely change from stable (constant) concentration levels, to oscillatory dynamics. Then we extend our analysis to the elemental case of two astrocytes, coupled by IP3 diffusion mediated by gap junction channels, putting emphasis on the mechanisms of emergence of chaotic oscillations. Finally, we complete our analysis discussing spatiotemporal Ca2+ dynamics in a spatially-extended astrocyte model, gaining insights on the possible physical mechanisms whereby random Ca2+ generation could be orchestrated into robust, spatially-confined intracellular Ca2+ oscillations.
2 Birth and death of calcium oscillations in a compact astrocyte model
2.1 Compact astrocyte modeling
Compact astrocyte models are useful to study cell-averaged signals such as whole-cell or somatic Ca2+ signals recorded in the majority of experiments (Schuster et al.,, 2002; Falcke,, 2004). These models assume the astrocyte to be “well-stirred,” so that the concentration of each species is homogeneous throughout. Thus, for example, we write for the concentration of free Ca2+ ions in the cytoplasm and note that it is , that is has no spatial dependence. In the following, in particular, we consider emergence (or death) of Ca2+ oscillations in a popular compact astrocyte model originally developed by De Pittà et al., 2009a . The model describes astrocytic Ca2+ signaling by Ca2+-induced Ca2+ release (CICR) from the endoplasmic reticulum (ER) stores to the cytoplasm in combination with intracellular IP3 dynamics. The model consists of three ordinary differential equations: one for intracellular (cytosolic) IP3 (), one for cytosolic Ca2+ (), and a further one for Ca2+-mediated deinactivation () of IP3 receptor/Ca2+ channels, whereby these channels turn available to trigger CICR again after its occurrence (see Chapter 5). In particular, cytosolic Ca2+ and the IP3R deinactivation are described by a set of Hodgkin-Huxley-like equations, according to the description originally introduced by Li and Rinzel, (1994), and evolve according to (Höfer et al.,, 2002)
| (1) | ||||
| (2) |
where respectively denote the IP3R-mediated Ca2+-induced Ca2+-release from the ER (), the Ca2+ leak from the ER (), the Ca2+ uptake from the cytosol back to the ER by serca-ER Ca2+/ATPase pumps () (De Pittà et al., 2009a, ) and the Ca2+ flux across the plasmalemma membrane by other Ca2+/ATPase (PMCA) pumps and leak mechanisms () (Ullah et al.,, 2006). These terms, together with the IP3R deinactivation rate () and the steady-state deinactivation probability (), are given by (Dupont and Goldbeter,, 1993; Li and Rinzel,, 1994)
| (3) | ||||
| (4) | ||||
| (5) | ||||
| (6) | ||||
| (7) | ||||
| (8) | ||||
| (9) |
where denotes the sigmoid (Hill) function . In the absence of external stimulation, cytosolic IP3 concentration is regulated by the complex Ca2+-modulated interplay of phospholipase C-mediated endogenous production and degradation by IP3 3-kinase (3K) and inositol polyphosphatase 5-phosphatase (5P) (Zhang et al.,, 1993; Sims and Allbritton,, 1998; Rebecchi and Pentyala,, 2000), and evolves according to the mass balance equation (De Pittà et al., 2009a, )
| (10) |
where
| (11) | ||||
| (12) | ||||
| (13) |
A detailed description of the parameters in the above equations along with their estimation is provided in Chapter 5. Table B1 in the appendix further summarizes the parameter values hereafter adopted.
2.2 Bifurcations of Ca2+ and IP3 equilibria
We start our analysis of intracellular Ca2+ dynamics by considering the bifurcations of equilibria, namely of those situations where Ca2+, IP3 and IP3R deinactivation are constant in the astrocyte. In doing so, we set the rate of IP3 production by PLC sufficiently small so as not to have spontaneous oscillations for typical Ca2+ and IP3 resting concentrations, i.e. M (Kang and Othmer,, 2009), and we map how many the equilibria are and how their stability changes for different regimes of IP3 degradation, mimicked by different values of the two IP3 degradation rates and in equations 10–13.
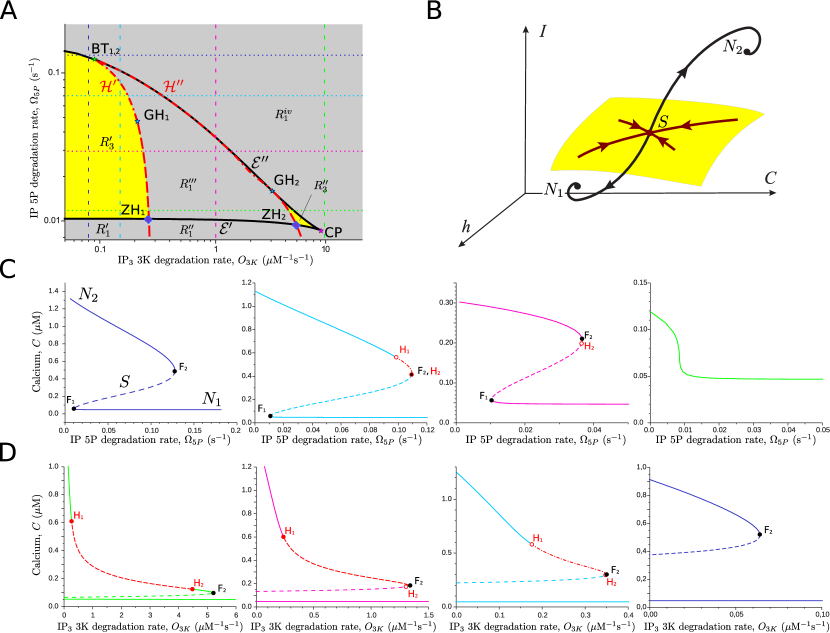
Figure 1A summarizes the results of our bifurcation analysis in the parameter plane . In this plane, four bifurcation curves exist: two black curves of fold (or saddle-node) bifurcation points which originate at M by cusp bifurcation (CP) and develop, for decreasing values, into two branches ; and two red curves of Andronov-Hopf bifurcation points , which are born through a pair of consecutive Bogdanov-Takens bifurcations (BT1,2) that are consistent with the existence of two zero eigenvalues for the system of equations 1–10. Remarkably, the first Lyapunov coefficient along the Andronov-Hopf curves changes from negative to positive in coincidence of the two generalized Hopf points (GH1, GH2) for increasing values, marking a transition from subcritical (dash-dotted red curves) to supercritical Andronov-Hopf bifurcations (dashed red curves).
Fold and Andronov-Hopf curves also intersect in two fold-Hopf points for low values – with in ZH1, and with in ZH2 – and ultimately partition the parameter plane into different regions which fall in two categories depending on the number of equilibria: (i) one stable equilibrium, like in the four grey-shaded regions ; and (ii) two stable equilibria, as in the yellow-shaded regions . Notably, in the case of monostability, the equilibrium is globally stable, that is Ca2+ and IP3 always converge to their equilibrium values from any initial state. In the presence of bistability instead, as schematically illustrated in Figure 1B, the two equilibria are separated by a saddle point whose unstable manifold (yellow plane) separates between the basins of attraction of the two equilibria.
Vertical and horizontal sections of the parameter plane in Figure 1A respectively provide codim-1 bifurcation diagrams in terms of the rate parameters (Figure 1C) and (Figure 1D), and illustrate different possible scenarios for transitions from monostability to bistability and vice versa. In particular, it may be noted that, for increasing rates of 3K-mediated IP3 degradation (Figure 1C), the range of values for which bistability occurs, is mainly controlled by two fold bifurcations (F1,2), unless BTZH1 (Figure 1C, cyan diagram) (or GHZH2, not shown), in which case the high stable equilibrium () disappears via Andronov-Hopf bifurcation (H1) as increases. Similar considerations also hold for the dual case where 5P-mediated IP3 is kept constant and changes (Figure 1D). In this latter scenario however, as far as ZHGH2, the high Ca2+ state can exists both for low and high values (Figure 1D, green diagram). In this case, low and high values are separated by an unstable equilibrium comprised between two supercritical Andronov-Hopf points (H1,2, dashed red line) for which Ca2+ oscillations emerge.
2.3 Emergence of Ca2+ and IP3 oscillations and related limit cycle bifurcations
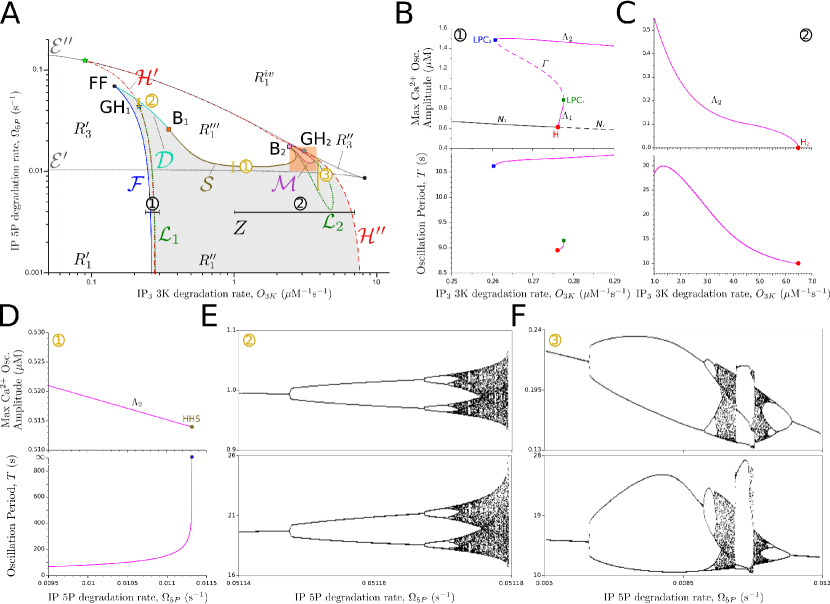
We now turn our analysis to the possible mechanisms underpinning generation and death of Ca2+ and IP3 oscillations. From a dynamical system perspective, Ca2+ and IP3 oscillations are consistent with existence of limit cycle attractors in the plane, so that their birth (or death) is by bifurcations of limit cycles. These bifurcations are shown in Figure 2A together with the bifurcation curves of equilibria previously discussed (Figure 1A). In this figure, five different bifurcation curves, and , delimit a gray-shaded region of the parameter plane where Ca2+ and IP3 stable oscillations exist. In particular, proceeding from left to right, one may note that curve , which traces fold-of-cycles bifurcations, is born with curve , which represents instead period-doubling bifurcations, through a fold-flip bifurcation (FF). Curve then turns into a curve of single-loop homoclinic-to-hyperbolic saddle bifurcations at point B1. More precisely, this point corresponds to the single-loop separatrix of a saddle-focus bifurcation for which the saddle value of the associated homoclinic-to-hyperbolic saddle orbit is zero (Kuznetsov,, 1998). An analogous point is also B2, at higher values, where the single-loop homoclinic orbit associated with becomes multi-loop. This results in the existence of an infinite number of bifurcation lines in the plane (not shown) which are bounded by curve that marks the death of oscillations for increasing values. Curve ultimately merges with the fold-of-cycle bifurcation curve in proximity of the generalized Hopf point GH2, whereby the dashed supercritical Andronov-Hopf curve is born, and closes the oscillation region for high values.
Existence of such diverse bifurcations for different and values, suggest different scenarios for birth and dynamics of Ca2+ and IP3 oscillations that depend on the regime of IP3 degradation. A first scenario of interest is the one found in correspondence of small values, in an interval that includes the three curves and (black segment “1” in Figure 2A). An inspection of the associated bifurcation diagram (Figure 2B, top panel) reveals that, starting from equilibrium Ca2+ and IP3 concentrations in region (see Figure 1A), Ca2+ and IP3 oscillations of arbitrarily small amplitude () are born via a supercritical Andronov-Hopf bifurcation H1 (which lies on ) for increasing values. The limit cycle associated with these oscillations grows in amplitude with in a small interval, till it disappears by the fold bifurcation LPC1 (lying on ). Nevertheless, oscillations may still be observed, yet of much larger amplitude, due to the presence of a large limit cycle which emerges via another fold bifurcation for values in (LPC2, lying on ). Thus, two scenarios of multistability exist: one for LPC H1 and LPC1, whereby constant (resting) Ca2+ and IP3 concentrations coexist with large oscillations of Ca2+ and IP3 oscillations; and another for H LPC1, where these large oscillations also coexist with smaller ones but there is no possible resting equilibrium for Ca2+ and IP3. The ensuing astrocytic Ca2+ dynamics, namely whether it is constant or oscillatory and, in this latter case, whether oscillations are small or large, ultimately depends on the location of the initial conditions (and thus on the astrocyte’s history of activation) with respect to manifolds of the limit cycle , which separate between the basins of attraction of the equilibrium () and the two limit cycles (). It is also possible that both oscillations occur together resulting in bursting (not shown, but see Figure 3 for an example). In this case, as evidenced by the period of oscillations (Figure 2B, bottom panel), the small amplitude oscillations () are slower than larger ones, and thus set the inter-burst period, whereas intra-burst oscillations, which must be faster, are those of large amplitude associated with the limit cycle .
The limit cycle , on the other hand, exists across the whole region, but its amplitude and period may considerably change depending on the IP3 degradation regime under consideration. This is illustrated in Figure 2C, where the maximal amplitude of Ca2+ oscillations lying on are shown in correspondence of the same rate of 5P-mediated IP3 degradation as in Figure 2B, but faster rates of 3K-mediated IP3 degradation (black segment “2” in Figure 2A). In this scenario, it may be noted that the cycle is maximally large for Ms-1 but its amplitude is almost half of that observed in Figure 2B, while the period is about 3-fold longer. In the transition from Figure 2B to Figure 2C, as increases beyond LPC1, the nonlinear amplification by the Ca2+-dependent Hill term in 3K-mediated IP3 degradation (equation 12) grows stronger reducing intracellular IP3, thereby limiting availability of open IP3Rs (equation 8). This results in a weaker CICR from the ER stores which is reflected by smaller Ca2+ oscillations. At the same time it also takes longer for IP3 to reach the CICR threshold from baseline concentration values, which accounts for larger oscillation periods. Clearly, the effect is stronger with larger values, and ultimately shrinks to arbitrarily small amplitude oscillations and disappears by supercritical Andronov-Hopf bifurcation in at Ms-1.
Consider now the possible emergence of oscillations by any of the three curves and . Among these three curves, is remarkable because allows rise or death of regular (i.e. single-loop) oscillations (, Figure 2D) with arbitrarily large period through homoclinic-to-hyperbolic saddle bifurcation (HHS). Here, the saddle originates by a fold (or saddle-node) bifurcation F1 lying on and occurring at lower (yellow segment “1” in Figure 2A), so that the limit cycle coexist with the low equilibrium ( in the third panel of Figure 1C) for any value of comprised between and .
Crossing of and may lead instead to rich oscillatory dynamics. In the case of for example (yellow segment “2” in Figure 2A and Figure 2D), for increasing rates of degradation by either 5-phosphatase or 3-kinase or both, regular Ca2+ and IP3 oscillations become irregular and eventually chaotic through a typical period doubling cascade sequence (Shilnikov et al.,, 2001). A similar pathway to chaos may also be observed for approaching (yellow segment “3” in Figure 2A). In particular as increases, first chaotic oscillations abruptly vanish via intermittency (type 1) to later re-emerge through period doubling cascade sequence, and finally become regular by period halving cascade sequence. This complex dynamics ensues from the infinity of bifurcation curves that is found in proximity of and which are omitted from the bifurcation portrait of Figure 2A for obvious graphical reasons.
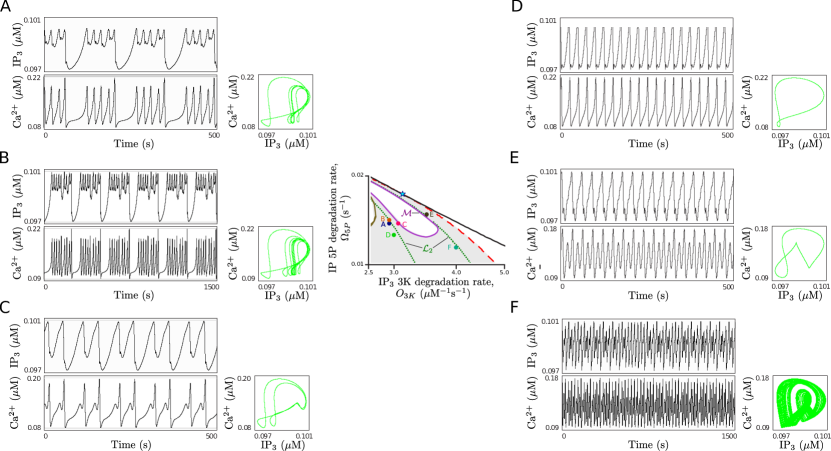
It suffices for the reminder of our analysis, to note that such complex dynamics can be observed in proximity of and, in particular, for degradation regimes in the region bounded by this latter curve and the fold-of-cycles bifurcation curve , as approximately marked by the orange-shaded rectangle in Figure 2A. A zoom in on this region is considered in Figure 3 (central panel) where sample Ca2+ and IP3 oscillations are shown for each labeled point therein. Considering for example the regimes marked by points A–C, it may be noted how small variations of the degradation rates are sufficient to dramatically alter shape and frequency of oscillations. In all cases, Ca2+ and IP3 oscillate in a bursting fashion with a constant phase shift, as reflected by the Lissajous-like curves in green, but both shape and frequency of their intra- and inter-burst oscillations dramatically differ. Starting for example from Figure 3A, a small increase of , such as in the scenario of Figure 3B, is sufficient to almost double duration and number of intraburst oscillations while slowing down overall occurrence of bursts (i.e. slower interburst oscillations). The opposite instead occurs for a small increase of whereby the frequency of bursts increases, but intraburst Ca2+ oscillations almost tend to disappear in favor of more complex oscillations (Figure 3C,E). While Ca2+ bursting requires coexistence of at least two limit cycles as earlier noted (e.g. Figure 2B), and thus cannot be observed for IP3 degradation regimes outside curve (Figure 3D), it also happens that, for regimes in proximity of this latter curve, the oscillations can become chaotic and highly irregular in shape and frequency (Figure 3F).
To conclude, the possibility for existence of different Ca2+ and IP3 oscillatory dynamics depending on the regime of IP3 degradation is remarkable as it suggests different modes of encoding of stimuli by the astrocyte. In this fashion, periodic oscillations such as those in Figure 3D,E could represent a mechanism of frequency encoding as far as their frequency, but not their shape nor their amplitude, changes with the stimulus. Conversely, Ca2+ bursting or chaotic oscillations (Figure 3A–C,F), could perform more complex encoding, carrying stimulus information both in their frequency and amplitude, ultimately triggering different downstream effects (De Pittà et al.,, 2008; De Pittà et al., 2009a, ).
Noteworthy is that, in our description, chaotic oscillations are more likely to appear for large rates of IP3 degradation by IP 5-phosphatase. In particular, experimental evidence suggests that this enzyme could mainly localize in proximity of the plasma membrane, differently from IP3 3-kinase which seems preferentially deeply anchored in the cytoplasm (Rebecchi and Pentyala,, 2000; Irvine et al.,, 2006). Because on the other hand, the cytoplasm-to-ER ratio increases across an astrocyte, from soma to processes (Pivneva et al.,, 2008), we could hypothesize that so does the relative expression of IP3-3K vs. IP 5P. In this fashion, different regimes of IP3 degradation could be present within different regions of an astrocyte: more 3K-driven ones in the processes at the cell’s periphery, and others, where 5P contribution is stronger instead, in the soma or in primary processes branching from this latter. In turn, different regions of the astrocyte could differently encode stimuli, and their reciprocal disposition within the astrocyte anatomical domain, and with respect to the surrounding neuropile, could ultimately be correlated, in support of the possibility of subcellular organization of Ca2+ and IP3 signaling within the same cell (Volterra et al.,, 2014).
3 IP3 diffusion and regulation of Ca2+ and IP3 oscillations in connected astrocytic compartments
3.1 Modeling of astrocytic ensembles
Either Ca2+ and IP3 signaling could extend to the whole astrocyte or just be confined within a subcellular region of this latter, our hitherto analysis has not taken into account the fact that IP3 is highly diffusible in the cytoplasm. This could alter IP3 balance at the CICR site (equation 10), either by subtracting or by adding IP3, with the potential to affect Ca2+ signaling (Sneyd et al.,, 1995). Remarkably this scenario could hold either for subcellular propagation of Ca2+ waves mediated by intracellular IP3 diffusion between neighboring subcellular regions within the same cell, or for intercellular propagation of whole-cell Ca2+ signals in networks of astrocytes connected by IP3-permeable gap junction channels (Scemes,, 2001). Because Ca2+ waves are an important mechanism whereby astrocytes could coordinate their behavior with that of neighboring cells, and such waves often travel in an oscillatory manner (Di Castro et al.,, 2011; Kuga et al.,, 2011) forming periodic waves, it is the period and the shape of these waves that are thought to control and coordinate a variety of cellular processes (Verkhratsky et al., 2012b, ).
The mechanisms controlling period and shape of Ca2+ waves, both intra- and intercellularly, are not well understood however (Bazargani and Attwell,, 2016). Thus, we devote this section to study how these wave features could be regulated by IP3 signaling, and in particular by IP3 diffusion. For this purpose, we consider a simple description of oscillatory Ca2+ waves consisting of two astrocytic compartments coupled by linear IP3 diffusion, where by “compartments” we mean either two different astrocytes, or two neighboring astrocytic regions. Accordingly, we assume that IP3 diffusion is respectively inter- or intra-cellular.
Each astrocytic compartment in our model is described by the same three variables used in the previous section. In particular, we keep equations 1 and 2 for and dynamics while we consider a somewhat simplified description of intracellular IP3 with respect to equation 10, so as to ease our analysis of the different contributions of IP3 production, degradation and diffusion in the emergence of Ca2+ waves (Kazantsev,, 2009; Matrosov and Kazantsev,, 2011). In particular, we neglect IP3 competitive inhibition on PLC, as this mechanism is known to only marginally affect IP3 signaling for (De Pittà et al., 2009a, ), and assume no cooperativity for the binding reaction of Ca2+ with this enzyme. Moreover we linearly scale the dependence of PLC activation by Ca2+ according to (De Young and Keizer,, 1992; Kazantsev,, 2009)
| (14) |
where controls Ca2+-dependent PLC activation such that for it is . We also neglect Ca2+ dependence of IP3 degradation and assume that IP3 levels in our description are low, at most close to IP3-3K binding affinity for IP3, i.e. , so that (equation 10). In this fashion, we are able to lump IP3 degradation into a single term that linearly depends on IP3, i.e.
| (15) |
where we defined as the rate of IP3 degradation. Finally, we consider Fick’s first law of diffusion to describe IP3 diffusion, so that (Crank,, 1980)
| (16) |
where is the IP3 diffusion rate and reflects the gradient of IP3 concentration across the boundary of the astrocytic compartment, moving from inside to outside this latter. In this fashion, coupling two astrocytic compartments together by linear IP3 diffusion results in the following system of six differential equations (Matrosov and Kazantsev,, 2011):
| (17) | |||||
| (18) | |||||
| (19) | |||||
where .
3.2 Bifurcation analysis of two linearly-coupled astrocytic compartments
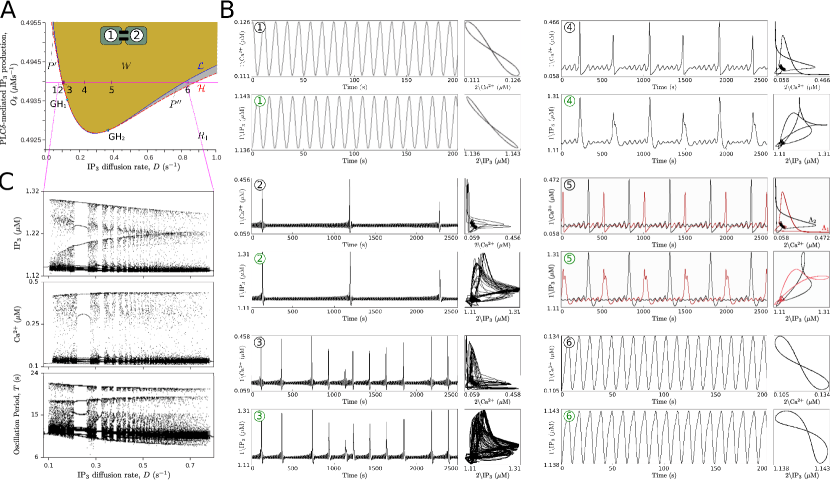
Figure 4A reveals existence of two bifurcations curves for our system of two coupled identical astrocytic compartments as a function of the IP3 diffusion rate () and the IP3 production rate by PLC (): a red curve of Andronov-Hopf bifurcation points (), and a blue curve of fold bifurcation points of limit cycles (). These two curves intersect in two generalized Hopf bifurcation points GH1 and GH2, in between of which Andronov-Hopf bifurcations are subcritical, while being supercritical elsewhere. The parameter plane is thereby subdivided into three regions: (i) a white region where only constant (equilibrium) Ca2+ and IP3 concentrations are observed; (ii) a grey-shaded region () where regular Ca2+ and IP3 oscillations emerge; and finally (iii) a yellow region where complex and/or chaotic oscillatory dynamics occurs. Remarkably, oscillations either in or in can only emerge for sufficiently large rates of PLC-mediated IP3 production, independently of the rate of IP3 diffusion, with a minimum value of for oscillations that depends on the rate of IP3 degradation (results not shown).
Based on the existence of the two curves and , two main mechanisms for birth (death) of regular Ca2+ and IP3 oscillations may be expected: one for GH1 and GH2, where oscillations of arbitrarily small amplitude appear via supercritical Andronov-Hopf bifurcation (Figure 4B, panels 1–6), and the other, for GH GH2, whereby oscillations of arbitrarily small frequency emerge via subcritical Andronov-Hopf bifurcation with amplitude set by the limit cycle previously born through (results not shown). Analysis of Lissajous-like curves associated with the earlier scenario of oscillations (Figure 4B, square panels) show the characteristic “8” shape of antiphase oscillations. This can be explained noting that CICR in one compartment triggers a surge of IP3 production by PLC and an increase in diffusion of IP3 from that compartment to the neighboring one, promoting CICR therein. Yet, by the time this occurs, Ca2+-mediated inactivation of IP3Rs in the first compartment has already grown sufficiently to hinder CICR and make Ca2+ decrease, till IP3 diffusion from the other compartment promotes Ca2+ increase again in a cyclic fashion, thereby resulting in oscillations in the two compartments that are opposite in phase (or almost so) (Bindschadler and Sneyd,, 2001; Ullah et al.,, 2006).
The remarkable proximity between and curves, which respectively result in birth (or death) of local vs. global attractors in the parameter plane (i.e. equilibria vs. limit cycles) (Kuznetsov,, 1998), underpins further scenarios of emergence of oscillations that could not be observed in our previous bifurcation analysis of a single astrocytic compartment (Section 2.3). In particular, for small values increasing across the left branch of (i.e. for GH1), Ca2+ trajectories along the limit cycle emerging by may transiently enter the basin of attraction of the limit cycle attractor emerging by or vice versa, ensuing in intermittent appearance of chaotic, pulse-like Ca2+ and IP3 oscillations (Figures 4B.2,3) separated by low-amplitude, quasi-periodic oscillations of variable duration.
Sampling of the bifurcation diagram in Figure 4A for varying with constant (magenta segment) indeed reveals existence of multiple chaotic bands for values beyond , separated by intervals of almost regular oscillations whose amplitude decreases as increases away from the bifurcation boundary (Figure 4C). These bands also reveals existence of two chaotic attractors, one for low and the other for high Ca2+/IP3 values, as reflected by the two longitudinal bands in Figure 4C. Notably, these two bands eventually merge for sufficiently large values (and chaos disappears), ensuing in complex periodic oscillations which bear features of either or both attractors, that is either low- or large-amplitude oscillations (Figure 4B.4) or both ( and in Figure 4B.5).
4 Oscillatory Ca2+ dynamics in the presence of stochastic IP3 fluctuations
4.1 Spatially-extended astrocytic networks
The case of two coupled astrocytic compartments considered in the previous section is arguably the simplest example of a “spatially-extended” astrocytic model, where space is defined by two points whose neighboring environment is approximated by a well-stirred compartment governed by equations 17–19. As previously mentioned, depending on the choice of model parameters, these two “points” (or compartments) can either represent two astrocytes connected by gap junctions, or two contiguous subcellular regions of the same cell. In either scenarios, we assume that the (Euclidean) distance between the two compartments is negligible with respect to their spatial extension, so that Ca2+ and IP3 dynamics in between the two compartments is merely a function of the concentrations of these species within the compartments. Remarkably, this can be extended to any number of compartments – as far as properly well-stirred compartments are identified (see Chapter 7) – so that the compartmental approach can be adopted to model both astrocytic networks (Kazantsev,, 2009; Goldberg et al.,, 2010; Lallouette et al.,, 2014; Wallach et al.,, 2014) and individual astrocytes with spatially-extended, coarse-grained yet realistic geometry (De Pittà,, 2013; Wu et al.,, 2014).
What distinguishes whether our compartments represent individual cells or subcellular regions is a combination of any of the following factors: (i) the choice of model parameters of each compartment, insofar as whole-cell (somatic) Ca2+ signals are different in shape, duration and frequency with respect to Ca2+ signals that are confined within astrocytic processes (Bindocci et al.,, 2017); (ii) how the compartments are connected, and (iii) the nature of these connections, since different are the mechanisms regulating the IP3 flow between compartments, depending on whether these latter represent cells or subcellular portions, for which nonlinear vs. linear coupling choices can be made accordingly (Goldberg et al.,, 2010; Lallouette et al.,, 2014). On the other hand, there is emerging evidence suggesting that Ca2+ signaling, both within a single astrocyte or in an astrocytic network, bears some degree of “functional organization” to the extent that, either different cellular regions (Di Castro et al.,, 2011; Bindocci et al.,, 2017), or portions of the network display unique spatiotemporal Ca2+ dynamics (Kuga et al.,, 2011; Sasaki et al.,, 2011). This would mean that once we built a compartmental model of an astrocyte, or of an astrocytic network, we could a priori predict that either individual compartments in our model, or specific ensembles of connected compartments, underpin generation of unique, stereotypical Ca2+ patterns, namely that Ca2+ signaling, ensuing from our simulations, presents some degree of functional compartmentalization.
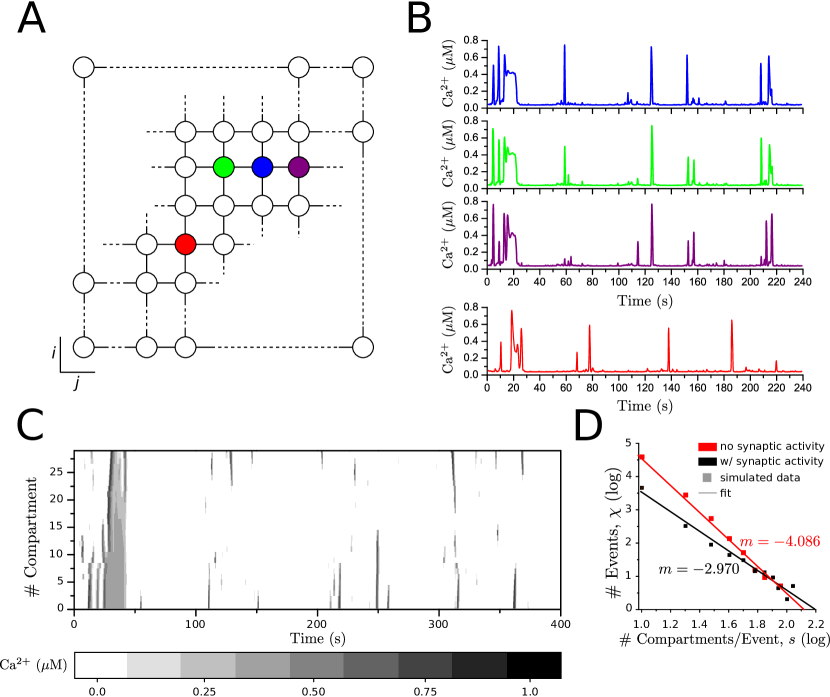
To understand what, in our hypothetical model, could be responsible for the emergence of such functional Ca2+ compartmentalization, we could imagine to start considering identical compartments connected in some non-random fashion, and argue, somewhat trivially, that the very non-random topology of connections, along with the nature of those connections, are responsible, at least to some extent, to the emergence of unique spatiotemporal Ca2+ patterns (Lallouette et al.,, 2014). There is nonetheless the complimentary possibility that spatiotemporal Ca2+ organization could also emerge by intrinsic properties of the very biochemistry beyond IP3-mediated CICR (Volterra et al.,, 2014) – a hypothesis which we are going to investigate for the remainder of this chapter. With this aim, we consider a -by- lattice of identical astrocytic compartments, each compartment being linearly coupled to neighboring compartments, so that either 2 or 4 connections per compartment can be counted, depending on whether the compartment is at the borders of the lattice or far from it (Figure 5A). For sufficiently large , the symmetry of this setup allows linking emergence of spatiotemporal Ca2+ patterns that we are presumably going to observe in our simulations, exclusively with the nature of biochemical reactions underpinning astrocytic IP3/Ca2+ signaling. Furthermore, to rule out that pattern formation in our simulations could be caused by the nature of the initial perturbation or the choice of initial conditions used to ignite IP3/Ca2+ signaling, we set in equation 14, thus neglecting the nonlinear Ca2+ dependency of PLC for the sake of simplicity, while adding a further term for stochastic IP3 production either by spontaneous PLC activation (Lavrentovich and Hemkin,, 2008) or by activation of PLC by stochastic synaptic inputs (Aguado et al.,, 2002). Accordingly, IP3 production by PLC isoenzymes is described by (Wu et al.,, 2014):
| (20) |
where (with ) denotes the generation of a random number at time withdrawn from the standard uniform distribution, and accounts for random modulations of the maximal rate of IP3 production; and respectively stand instead for the instants of synaptically-evoked and spontaneous nucleation of IP3/Ca2+ spikes, which may be assumed to be Poisson distributed at first approximation, in agreement with experimental observations (Softky and Koch,, 1993; Shadlen and Newsome,, 1998; Skupin et al.,, 2008). Each astrocytic compartment in the lattice is thus described by (Kazantsev,, 2009):
| (21) | ||||
| (22) | ||||
| (23) |
where is the discrete Laplace operator whereby
| (24) |
with the indices denoting the discrete spatial coordinates in the lattice.
4.2 Ca2+ wave propagation and functional organization
We first consider the scenario of spontaneous nucleation of Ca2+ waves (i.e. ) at some average rate in each compartment. Typical values for are in the range of 1–50 mHz (Skupin et al.,, 2008; Bindocci et al.,, 2017), accordingly we chose an intermediate sample value of mHz. Figure 5B shows Ca2+ traces sampled from different colored compartments in the lattice in Figure 5A. It may be appreciated how Ca2+ pulse-like fluctuations occur randomly and with variegated amplitudes in close analogy with experimental observations (Nett et al.,, 2002; Wu et al.,, 2014). These fluctuations generally present some degree of correlation in contiguous compartments as a result of linear IP3 diffusion in between compartments (compare blue, green and purple traces associated with same-color compartments in Figure 5A), but tend to be essentially uncorrelated for compartments far apart (see for example purple and red traces).
Looking at the raster plot of Ca2+ activities in Figure 5C, built by stacking on the y-axis Ca2+ traces of all compartments of the first row of the lattice ( in Figure 5A), it may be seen how, despite spontaneous (random) IP3/Ca2+ pulse nucleation in each compartment, the ensemble of compartments under consideration displays somewhat non-random patterns of Ca2+ activity. For example a large Ca2+ wave originates in compartments 15–17 and propagates for s to neighboring compartments, ultimately engulfing the whole row and other portions of the lattice that are not shown. For s instead, a series of spatially-confined Ca2+ puffs spanning few () compartments alternate with larger Ca2+ events encompassing several () compartments.
To characterize emergence of spatiotemporal Ca2+ patterns in our lattice it is convenient to consider the distribution of the number of Ca2+ events () over their size (), quantified in terms of active compartments per event. Data points from our simulations are shown as red squares in Figure 5D, where the choice of logarithmic scales on both axes reveals a linear regression fit for these data points characterized by a negative slope (red line) which is the hallmark of power law statistic, i.e. (Newman,, 2005). Such statistics suggests that in our setup, spontaneous IP3/Ca2+ nucleation promotes formation of clusters of simultaneously active compartments of different sizes, with decreasing probability as the cluster size increases. These scale-free clusters of active compartments – “scale-free” insofar as there is no specific size (i.e. scale) for the observed clusters, but many sizes are possible – confirm our original hypothesis that CICR molecular machinery itself promotes functional organization of Ca2+ dynamics in astrocytic cells and networks. The formation of clusters of active astrocytic compartments may indeed be regarded as a fingerprint of emergence of highly functionally-connected cellular or subcellular regions, whose different local Ca2+ dynamics are strongly correlated.
It is instructive in this context to also predict how such spontaneous functional organization of astrocytic compartments could change in the presence of synaptically-evoked IP3 production. With this aim, we repeat our simulations assuming that random IP3 production in equation 20 is by PLC rather than by PLC (i.e. ). Accordingly, we consider the scenario of synaptic stimuli ensuing from spontaneous neural firing in the range of 0.1–5 Hz (Softky and Koch,, 1993; Haider et al.,, 2013), with an average synaptic release probability between 0.09 (Schikorski and Stevens,, 1997) and 0.6 (Stevens and Wang,, 1995), which sets effective rates of synaptically-evoked IP3 production in the range of 0.01–3 Hz (Destexhe et al.,, 2001). Then, choosing an intermediate value of Hz, we also consider a low maximal rate of IP3 production to account for the observation that astrocytic Ca2+ puffs by spontaneous synaptic activity are at most similar in size and intensity to spontaneous ones (Di Castro et al.,, 2011). The resulting distribution of Ca2+ events over their size (black points in Figure 5D) is still consistent with power law statistics, but the power law exponent in this case is smaller () with respect to the case of spontaneous PLC mediated IP3/Ca2+ nucleation.
To seek some insights on the possible implications of this result, recall that the exponent of the power law can be regarded as a measure of the weight of the tail of the distribution, that corresponds in our case to the emergence of larger functional Ca2+ islands. Hence, the smaller is, the larger is the proportion of observed large Ca2+ events. This is arguably what we expect by synaptic stimulation of astrocytes: namely that small random Ca2+ puffs tend to disappear as synaptic activity increases, leaving the place to Ca2+ events that progressively encompass larger astrocytic areas in a concerted fashion (Bindocci et al.,, 2017) – a phenomenon reminiscent of percolation in the context of reactive-diffusive media (Vanag and Epstein,, 2001). Remarkably, it may be noted that independently of the scenario under consideration, the tails of the two distributions in Figure 5D tend to overlap, suggesting that large Ca2+ events emerge with low probability fixed by the inherent properties of the molecular CICR machinery, regardless of the rate of random IP3/Ca2+ nucleation (Wu et al.,, 2014).
Conclusions
We have shown how, depending on differences in the underpinning regimes of IP3 degradation, astrocytic Ca2+ signaling could unfold into an incredible, dynamically rich repertoire of oscillations – from simple periodic oscillations, to complex chaotic bursts and variegated chirps in transitions from different steady states. While this does not answer the question of the functional need for such rich dynamical repertoire by astrocytes, it nevertheless suggests that these cells are capable of implementing complex manipulations of stimuli by encoding these latter by multiple features of different Ca2+ oscillations (e.g. Ca2+ peaks, frequency, shape,) (De Pittà et al.,, 2008; De Pittà et al., 2009b, ).
Two important predictions follow from the models and simulations hitherto discussed. First is the observation that in our simulations, it is often sufficient to slightly perturb IP3 degradation rates by IP 5P or IP3-3K to produce dramatic changes in the ensuing Ca2+ dynamics. This could result on one hand in the emergence of periodic, self-sustained stable oscillations (De Pittà et al., 2009a, ), reminiscent of biological clocks observed for example in other cell types such as hepatocytes (Höfer,, 1999), cardiac myocytes (Maltsev et al.,, 2011) and other biological systems (Goldbeter,, 1997). On the other hand, it suggests that, Ca2+ dynamics could ensue from fine tuning of cellular properties of the astrocyte, possibly meant to deploy specific physiological needs (Volterra et al.,, 2014). Second is the consideration, that the molecular CICR machinery beyond the majority of observed astrocytic Ca2+ signals, endows both the single astrocyte and networks of astrocytes by functional organization. Namely an astrocyte (or a network thereof) could dynamically deploy Ca2+ signals of different spatial extension, each with its unique potential functional meaning. It is then plausible to think that heterogeneous expressions of enzymes for IP3 production and degradation (Irvine et al.,, 2006), which has not been taken into account in our compartmental approach, could further contribute to the emergence of such functional parcelization of astrocytic anatomical domains – a prediction that is left for proof by future experimental and theoretical investigations.
Appendix A Numerical methods
Numerical integration of models in equations 1–10, 17–19, 21–23 was pursued by a fourth-order Runge-Kutta integration scheme with adaptive step size control and maximum step of 5 ms (Press et al.,, 1992). To construct bifurcation diagrams we deployed custom code in Fortran and C++ for standard methods of numerical codim-1 and codim-2 continuations (Guckenheimer and Holmes,, 1986; Kuznetsov,, 1998). For each value of the bifurcation parameter considered in a continuation, up to 150 peak values of Ca2+ and IP3 oscillations were stored, allowing to reliably detect multistability or chaotic oscillations. Regular vs. chaotic regimes were distinguished by numerical evaluation of Lyapunov eigenvalue spectrum of trajectories on the identified attractor (Shilnikov et al.,, 2001). Accordingly, the attractor was dubbed chaotic if the Lyapunov spectrum included at least one positive eigenvalue. The complexity of the attractor was instead estimated by numerical evaluation of its power spectrum (Shilnikov et al.,, 2001).
Stability of equilibria was pursued by numerical computation of the eigenvalue spectrum in the linearized model. Stability of limit cycles was instead assed by numerical estimation of Floquet multipliers of the corresponding fixed point in Poincaré sections according to classical methods of nonlinear dynamics theory (Guckenheimer and Holmes,, 1986).
In the study of Ca2+ propagation in astrocyte networks in Figure 5D, an astrocyte compartment was dubbed active if its intracellular Ca2+ increased beyond a threshold value of 0.4 M. Accordingly, an event was counted every time one or more connected compartments were simultaneously active in a time window of 0.1 s. Power-law fit of event number () vs. size () was pursued by linear fit of data points on log-log plots by Origin 8.0 software package (OriginLab Corp., Northampton MA).
Appendix B Parameter values of the different models
| Parameter | Description | Value | Unit |
| Compact single astrocyte model | |||
| Total cell free Ca2+ concentration | 2 | M | |
| Ratio between ER and cytosol volumes | 0.185 | – | |
| Maximal rate of Ca2+ release by IP3Rs | 6 | s-1 | |
| Maximal rate of Ca2+ leak from the ER | 0.11 | s-1 | |
| Maximal rate of Ca2+ uptake by SERCA pumps | 2.2 | Ms-1 | |
| Ca2+ affinity of SERCA pumps | 0.1 | M | |
| IP3 dissociation constant | 0.13 | M | |
| Ca2+ inactivation dissociation constant | 1.049 | M | |
| IP3 dissociation constant | 0.9434 | M | |
| Ca2+ activation dissociation constant | 0.082 | M | |
| IP3R binding rate for Ca2+ inhibition | 0.1335 | M-1s-1 | |
| IP3R unbinding rate for Ca2+ inhibition | 0.14 | s-1 | |
| Maximal rate of IP3 production by PLC | 0.15 | Ms-1 | |
| Ca2+ affinity of PLC | 0.5 | M | |
| Inhibition constant of PLC by IP3 | 1.0 | M | |
| Maximal rate of IP3 degradation by IP3-3K | free | Ms-1 | |
| Ca2+ affinity of IP3-3K | 0.5 | M | |
| IP3 affinity of IP3-3K | 1.0 | M | |
| Maximal rate of IP3 degradation by IP 5P | free | s-1 | |
| Astrocytic compartment model | |||
| Constant Ca2+ influx by plasmalemma membrane | 0.025 | Ms-1 | |
| Maximal Ca2+-dependent rate of Ca2+ influx by PMCA | 0.2 | Ms-1 | |
| Ca2+ affinity of PMCA | 1.0 | M | |
| Maximal rate of Ca2+ extrusion by PMCA | 0.5 | s-1 | |
| Strength of Ca2+ dependence of PLC | 0.8 | – | |
| Maximal rate of IP3 degradation | 0.1349 | s-1 | |
| IP3 diffusion rate | free | s-1 | |
References
- Aguado et al., (2002) Aguado, F., Espinosa-Parrilla, J. F., Carmona, M. A., and Soriano, E. (2002). Neuronal activity regulates correlated network properties of spontaneous calcium transients in astrocytes in situ. J. Neurosci., 22(21):9430–9444.
- Araque et al., (2014) Araque, A., Carmignoto, G., Haydon, P. G., Oliet, S. H. R., Robitaille, R., and Volterra, A. (2014). Gliotransmitters travel in time and space. Neuron, 81(4):728–739.
- Arizono et al., (2012) Arizono, M., Bannai, H., Nakamura, K., Niwa, F., Enomoto, M., Matsu-ura, T., Miyamoto, A., Sherwood, M. W., Nakamura, T., and Mikoshiba, K. (2012). Receptor-selective diffusion barrier enhances sensitivity of astrocytic processes to metabotropic glutamate receptor stimulation. Sci. Signal., 5(218):ra27.
- Bazargani and Attwell, (2016) Bazargani, N. and Attwell, D. (2016). Astrocyte calcium signaling: the third wave. Nature Neuroscience, 19(2):182–189.
- Berridge et al., (2003) Berridge, M. J., Bootman, M. D., and Roderick, H. L. (2003). Calcium signalling: dynamics, homeostasis and remodelling. Nat. Rev. Mol. Cell. Biol., 4:517–529.
- Bindocci et al., (2017) Bindocci, E., Savtchouk, I., Liaudet, N., Becker, D., and Carriero, G.and Volterra, A. (2017). Three-dimensional Ca2+ imaging advances understanding of astrocyte biology. Science, 356:6339.
- Bindschadler and Sneyd, (2001) Bindschadler, M. and Sneyd, J. (2001). A bifurcation analysis of two coupled calcium oscillators. Chaos: An Interdisciplinary Journal of Nonlinear Science, 11(1):237–246.
- Communi et al., (2001) Communi, D., Gevaert, K., Demol, H., Vandekerckhove, J., and Erneux, C. (2001). A novel receptor-mediated regulation mechanism of type I inositol polyphosphate 5-phosphatase by calcium/calmodulin-dependent protein kinase II phosphorylation. J. Biol. Chem., 276(42):38738–38747.
- Crank, (1980) Crank, J. (1980). The mathematics of diffusion. Oxford University Press, USA, 2 edition.
- De Pittà, (2013) De Pittà, M. (2013). Information Processing and Memory in Astrocyte-regulated Synapses. PhD thesis, Tel Aviv University.
- (11) De Pittà, M., Goldberg, M., Volman, V., Berry, H., and Ben-Jacob, E. (2009a). Glutamate-dependent intracellular calcium and IP3 oscillating and pulsating dynamics in astrocytes. J. Biol. Phys., 35:383–411.
- (12) De Pittà, M., Volman, V., Levine, H., and Ben-Jacob, E. (2009b). Multimodal encoding in a simplified model of intracellular calcium signaling. Cogn. Proc., 10(S1):55–70.
- De Pittà et al., (2008) De Pittà, M., Volman, V., Levine, H., Pioggia, G., De Rossi, D., and Ben-Jacob, E. (2008). Coexistence of amplitude and frequency modulations in intracellular calcium dynamics. Phys. Rev. E, 77(3):030903(R).
- De Young and Keizer, (1992) De Young, G. W. and Keizer, J. (1992). A single-pool inositol 1,4,5-trisphosphate-receptor-based model for agonist-stimulated oscillations in Ca2+ concentration. Proc. Natl. Acad. Sci. USA, 89:9895–9899.
- Destexhe et al., (2001) Destexhe, A., Rudolph, M., Fellous, J., and Sejnowski, T. (2001). Fluctuating synaptic conductances recreate in vivo-like activity in neocortical neurons. Neuroscience, 107(1):13–24.
- Di Castro et al., (2011) Di Castro, M., Chuquet, J., Liaudet, N., Bhaukaurally, K., Santello, M., Bouvier, D., Tiret, P., and Volterra, A. (2011). Local Ca2+ detection and modulation of synaptic release by astrocytes. Nat. Neurosci., 14:1276–1284.
- Dupont, (2014) Dupont, G. (2014). Modeling the intracellular organization of calcium signaling. Wiley Interdisciplinary Reviews: Systems Biology and Medicine, 6(3):227–237.
- Dupont and Goldbeter, (1993) Dupont, G. and Goldbeter, A. (1993). One-pool model for Ca2+ oscillations involving Ca2+ and inositol 1,4,5-trisphosphate as co-agonists for Ca2+ release. Cell Calcium, 14:311–322.
- Falcke, (2004) Falcke, M. (2004). Reading the patterns in living cells: the physics of Ca2+ signaling. Adv. Phys., 53(3):255–440.
- Fall et al., (2002) Fall, C. P., Marland, E. S., M., W. J., and J., T. J. (2002). Computational Cell Biology. Springer-Verlag New York Incorporated.
- Goldberg et al., (2010) Goldberg, M., De Pittà, M., Volman, V., Berry, H., and Ben-Jacob, E. (2010). Nonlinear gap junctions enable long-distance propagation of pulsating calcium waves in astrocyte networks. PLoS Comput. Biol., 6(8):e1000909.
- Goldbeter, (1997) Goldbeter, A. (1997). Biochemical Oscillations and Cellular Rhythms. Cambridge University Press, Cambridge, UK.
- Guckenheimer and Holmes, (1986) Guckenheimer, G. and Holmes, P. (1986). Nonlinear oscillations, dynamical systems, and bifurcations of vector fields. Springer-Verlag, New York, U.S.A., 2nd edition.
- Haider et al., (2013) Haider, B., Häusser, M., and Carandini, M. (2013). Inhibition dominates sensory responses in the awake cortex. Nature, 493(7430):97–100.
- Höfer, (1999) Höfer, T. (1999). Model of intercellular calcium oscillations in hepatocytes: synchronization of heterogeneous cells. Biophysical journal, 77(3):1244–1256.
- Höfer et al., (2002) Höfer, T., Venance, L., and Giaume, C. (2002). Control and plasticity of intercellular calcium waves in astrocytes: a modeling approach. J. Neurosci., 22(12):4850–4859.
- Houart et al., (1999) Houart, G., Dupont, G., and Goldbeter, A. (1999). Bursting, chaos and birhythmicity originating from self/modulation of the inositol 1,4,5-trisphosphate signal in a model for intracellular Ca2+ oscillations. Bull. Math. Biol., 61:307–330.
- Irvine et al., (2006) Irvine, R. F., Lloyd-Burton, S. M., Yu, J. C. H., Letcher, A. J., and Schell, M. J. (2006). The regulation and function of inositol 1,4,5-trisphopshate 3-kinase. Advan. Enzyme Regul., 46:314–323.
- Kang and Othmer, (2009) Kang, M. and Othmer, H. (2009). Spatiotemporal characteristics of calcium dynamics in astrocytes. Chaos, 19(3):037116.
- Kazantsev, (2009) Kazantsev, V. B. (2009). Spontaneous calcium signals induced by gap junctions in a network model of astrocytes. Phys. Rev. E, 79(1):010901.
- Kuga et al., (2011) Kuga, N., Sasaki, T., Takahara, Y., Matsuki, N., and Ikegaya, Y. (2011). Large-scale calcium waves traveling through astrocytic networks in vivo. J. Neurosci., 31(7):2607–2614.
- Kuznetsov, (1998) Kuznetsov, Y. (1998). Elements of Applied Bifurcation Theory. Springer, New York, U.S.A., 2nd edition.
- Lallouette et al., (2014) Lallouette, J., De Pittà, M., Ben-Jacob, E., and Berry, H. (2014). Sparse short-distance connections enhance calcium wave propagation in a 3D model of astrocyte networks. Front. Comput. Neurosci., 8:45.
- Lavrentovich and Hemkin, (2008) Lavrentovich, M. and Hemkin, S. (2008). A mathematical model of spontaneous calcium(ii) oscillations in astrocytes. Journal of Theoretical Biology, 251(4):553–560.
- Li and Rinzel, (1994) Li, Y. and Rinzel, J. (1994). Equations for InsP3 receptor-mediated [Ca2+]i oscillations derived from a detailed kinetic model: A Hodgkin-Huxley like formalism. J. Theor. Biol., 166:461–473.
- Maltsev et al., (2011) Maltsev, A. V., Maltsev, V. A., Mikheev, M., Maltseva, L. A., Sirenko, S. G., Lakatta, E. G., and Stern, M. D. (2011). Synchronization of stochastic Ca2+ release units creates a rhythmic Ca2+ clock in cardiac pacemaker cells. Biophysical Journal, 100(2):271–283.
- Matrosov and Kazantsev, (2011) Matrosov, V. V. and Kazantsev, V. B. (2011). Bifurcation mechanisms of regular and chaotic network signaling in brain astrocytes. Chaos, 21:023103.
- Nett et al., (2002) Nett, W. J., Oloff, S. H., and McCarthy, K. D. (2002). Hippocampal astrocytes in situ exhibit calcium oscillations that occur independent of neuronal activity. J. Neurophysiol., 87:528–537.
- Newman, (2005) Newman, M. E. J. (2005). Power laws, Pareto distributions and Zipf’s law. Contemporary Physics, 46(5):323–351.
- Panatier et al., (2011) Panatier, A., Vallée, J., Haber, M., Murai, K., Lacaille, J., and Robitaille, R. (2011). Astrocytes are endogenous regulators of basal transmission at central synapses. Cell, 146:785–798.
- Pasti et al., (1997) Pasti, L., Volterra, A., Pozzan, T., and Carmignoto, G. (1997). Intracellular calcium oscillations in astrocytes: a highly plastic, bidirectional form of communication between neurons and astrocytes in situ. J. Neurosci., 17(20):7817–7830.
- Pivneva et al., (2008) Pivneva, T., Haas, B., Reyes-Haro, D., Laube, G., Veh, R., Nolte, C., Skibo, G., and Kettenmann, H. (2008). Store-operated Ca2+ entry in astrocytes: different spatial arrangement of endoplasmic reticulum explains functional diversity in vitro and in situ. Cell Calcium, 43(6):591–601.
- Press et al., (1992) Press, W. H., Teukolsky, S. A., Vetterling, W. T., and Flannery, B. P. (1992). Numerical Recipes in C. Cambridge University Press, New York, NY. 2nd ed.
- Rebecchi and Pentyala, (2000) Rebecchi, M. J. and Pentyala, S. N. (2000). Structure, function, and control of phosphoinositide-specific phospholipase C. Physiol. Rev., 80(4):1291–1335.
- Rusakov, (2015) Rusakov, D. A. (2015). Disentangling calcium-driven astrocyte physiology. Nature Reviews Neuroscience, 16:226–233.
- Sasaki et al., (2011) Sasaki, T., Kuga, T., Namiki, S., Matsuki, N., and Ikegaya, Y. (2011). Locally synchronized astrocytes. Cereb. Cortex, page In press.
- Scemes, (2001) Scemes, E. (2001). Components of astrocytic intercellular calcium signaling. Mol. Neurobiol., 22(1-3):167–179.
- Schikorski and Stevens, (1997) Schikorski, T. and Stevens, C. F. (1997). Quantitative ultrastructural analysis of hippocampal excitatory synapses. J. Neurosci., 17(15):5858–5867.
- Schuster et al., (2002) Schuster, S., Marhl, M., and Höfer, T. (2002). Modelling of simple and complex calcium oscillations from single-cell responses to intercellular signalling. Eur. J. Biochem., 269:1333–1355.
- Shadlen and Newsome, (1998) Shadlen, M. N. and Newsome, W. T. (1998). The variable discharge of cortical neurons: implications for connectivity, computation, and information coding. Journal of Neuroscience, 18(10):3870–3896.
- Shilnikov et al., (2001) Shilnikov, L. P., Shilnikov, A. L., Turaev, D. V., and O., C. L. (2001). Methods of Qualitative Theory in Nonlinear Dynamics Part II. World Scientific Publishing Company, Singapore.
- Sims and Allbritton, (1998) Sims, C. E. and Allbritton, N. L. (1998). Metabolism of inositol 1,4,5-trisphosphate and inositol 1,3,4,5-tetrakisphosphate by the oocytes of Xenopus laevis. J. Biol. Chem., 273(7):4052–4058.
- Skupin et al., (2008) Skupin, A., Kettenmann, H., Winkler, U., Wartenberg, M., Sauer, H., Tovey, S. C., Taylor, C. W., and Falcke, M. (2008). How does intracellular Ca2+ oscillate: by chance or by clock? Biophys. J., 94:2404–2411.
- Sneyd et al., (1995) Sneyd, J., Keizer, J., and Sanderson, M. J. (1995). Mechanisms of calcium oscillations and waves: a quantitative analysis. The FASEB Journal, 9(14):1463–1472.
- Softky and Koch, (1993) Softky, W. and Koch, C. (1993). The highly irregular firing pattern of cortical cells is inconsistent with temporal integration of random EPSPs. J. Neurosci., 13:334–350.
- Stevens and Wang, (1995) Stevens, C. F. and Wang, Y. (1995). Facilitation and depression at single central synapses. Neuron, 14:795–802.
- Sul et al., (2004) Sul, J.-Y., Orosz, G., Givens, R. S., and Haydon, P. G. (2004). Astrocytic connectivity in the hippocampus. Neuron Glia Biol., 1:3–11.
- Ullah et al., (2006) Ullah, G., Jung, P., and Cornell-Bell, A. H. (2006). Anti-phase calcium oscillations in astrocytes via inositol (1, 4, 5)-trisphosphate regeneration. Cell calcium, 39(3):197–208.
- Vanag and Epstein, (2001) Vanag, V. K. and Epstein, I. R. (2001). Pattern formation in a tunable medium: The Belousov-Zhabotinsky reaction in an aerosol OT microemulsion. Physical review letters, 87(22):228301.
- (60) Verkhratsky, A., Rodriguez, J. J., and Parpura, V. (2012a). Neurotransmitters and integration in neuronal-astroglial networks. Neurochem. Res.
- (61) Verkhratsky, A., Rodriguez, R. R., and Parpura, V. (2012b). Calcium signalling in astroglia. Mol. Cell Endocrinol., 353(1-2):45–56.
- Volterra et al., (2014) Volterra, A., Liaudet, N., and Savtchouk, I. (2014). Astrocyte Ca2+ signalling: an unexpected complexity. Nature Reviews Neuroscience, 15:327–334.
- Volterra and Meldolesi, (2005) Volterra, A. and Meldolesi, J. (2005). Astrocytes, from brain glue to communication elements: the revolution continues. Nat. Rev. Neurosci., 6(8):626–640.
- Wallach et al., (2014) Wallach, G., Lallouette, J., Herzog, N., De Pittà, M., Ben-Jacob, E., Berry, H., and Hanein, Y. (2014). Glutamate-mediated astrocytic filter of neuronal activity. PLoS Comput. Biol., 10(12):e1003964.
- Wu et al., (2014) Wu, Y.-W., Tang, X., Arizono, M., Bannai, H., Shih, P.-Y., Dembitskaya, Y., Kazantsev, V., Tanaka, M., Itohara, S., Mikoshiba, K., and Semyanov, A. (2014). Spatiotemporal calcium dynamics in single astrocytes and its modulation by neuronal activity. Cell Calcium, 55(2):119–129.
- Zhang et al., (1993) Zhang, B.-X., Zhao, H., and Muallem, S. (1993). Calcium dependent kinase and phosphatase control inositol-1,4,5-trisphopshate-mediated calcium release: modification by agonist stimulation. J. Biol. Chem., 268(5):10997–11001.
- Zorec et al., (2012) Zorec, R., Araque, A., Carmignoto, G., Haydon, P., Verkhratsky, A., and Parpura, V. (2012). Astroglial excitability and gliotransmission: An appraisal of Ca2+ as a signaling route. ASN Neuro, 4(2):e00080.
- Zur Nieden and Deitmer, (2006) Zur Nieden, R. and Deitmer, J. W. (2006). The role of metabotropic glutamate receptors for the generation of calcium oscillations in rat hippocampal astrocytes in situ. Cereb. Cortex, 16:676–687.