Star Formation at in the Lensed Galaxy SDSS J11106459:
Star Formation down to 30 parsec scales
Abstract
We present measurements of the surface density of star formation, the star-forming clump luminosity function, and the clump size distribution function, for the lensed galaxy SGAS J111020.0645950.8 at a redshift of 2.481. The physical size scales that we probe, radii –50 pc, are considerably smaller scales than have yet been studied at these redshifts. The star formation surface density we find within these small clumps is consistent with surface densities measured previously for other lensed galaxies at similar redshift. Twenty-two percent of the rest-frame ultraviolet light in this lensed galaxy arises from small clumps, with 100 pc. Within the range of overlap, the clump luminosity function measured for this lensed galaxy is remarkably similar to those of galaxies. In this galaxy, star-forming regions smaller than 100 pc—physical scales not usually resolved at these redshifts by current telescopes—are important locations of star formation in the distant universe. If this galaxy is representative, this may contradict the theoretical picture in which the critical size scale for star formation in the distant universe is of order 1 kiloparsec. Instead, our results suggest that current telescopes have not yet resolved the critical size scales of star-forming activity in galaxies over most of cosmic time.
Subject headings:
galaxies: star formation — gravitational lensing: strong — ultraviolet: galaxiesI. Introduction
Deep field surveys with The Hubble Space Telescope (HST) have revealed that more than half of star-forming galaxies at exhibit clumpy morphologies in the rest-frame ultraviolet (Shibuya et al., 2016). Motivated by these results over the past decade, a theoretical picture has emerged in which 1 kiloparsec is a critical size scale, perhaps the critical scale, for star formation in the distant universe (Elmegreen & Elmegreen, 2005; Elmegreen et al., 2007, 2009; Förster Schreiber et al., 2011; Guo et al., 2011, 2015). In that scenario, such large clumps arise from gravitational instabilities in gas-rich disks (Toomre, 1964; Noguchi, 1999; Genzel et al., 2011), and are thought to highlight spots where cold gas may have accreted onto the disk (Kereš et al., 2005; Dekel & Birnboim, 2006; Brooks et al., 2009).
In this scenario, star formation at early times occurred in complexes that are preferentially much larger than in galaxies in the local universe. However, this hypothesis is hard to test, as structures much smaller than 1 kpc cannot normally be resolved by current telescopes. Even HST is unable to resolve star formation at these redshifts on spatial scales smaller than about 500 pc, due to the diffraction limit. As a result, the clumpy, complex morphology of star formation that is known to occur in nearby galaxies is normally inaccessible at the epoch when most of the stars in the universe were formed (see review by Madau & Dickinson 2014.)
A way to overcome current observational limits and test this theoretical picture is to use gravitational lensing by natural telescopes (Einstein, 1936; Zwicky, 1937). Distant galaxies can be strongly gravitationally lensed into giant arcs that are highly magnified. To date, this technique has been exploited for dozens of lensed galaxies at , which have revealed the importance of star-forming clumps with spatial scales down to several hundreds parsecs (e.g. Livermore et al. 2012; Jones et al. 2010.)
Our HST program (GO 13003) observed giant arcs behind 37 lensing clusters that were selected by the Sloan Giant Arcs Survey (SGAS; Gladders et al., in prep). SGAS is a survey for strongly lensed, highly magnified galaxies selected from the Sloan Digital Sky Survey (SDSS). Galaxy clusters were selected from the SDSS photometric catalog using the red sequence method (Gladders & Yee, 2000); cluster fields were then systematically searched for giant arcs. Candidates lenses were confirmed, then followed up with an extensive ground- and space-based observational campaign. A full description of the SGAS-HST program will appear in Sharon et al. (2017, in prep). This Letter concerns one target from that larger program, SGAS J111020.0645950.8, hereafter SGAS 1110.
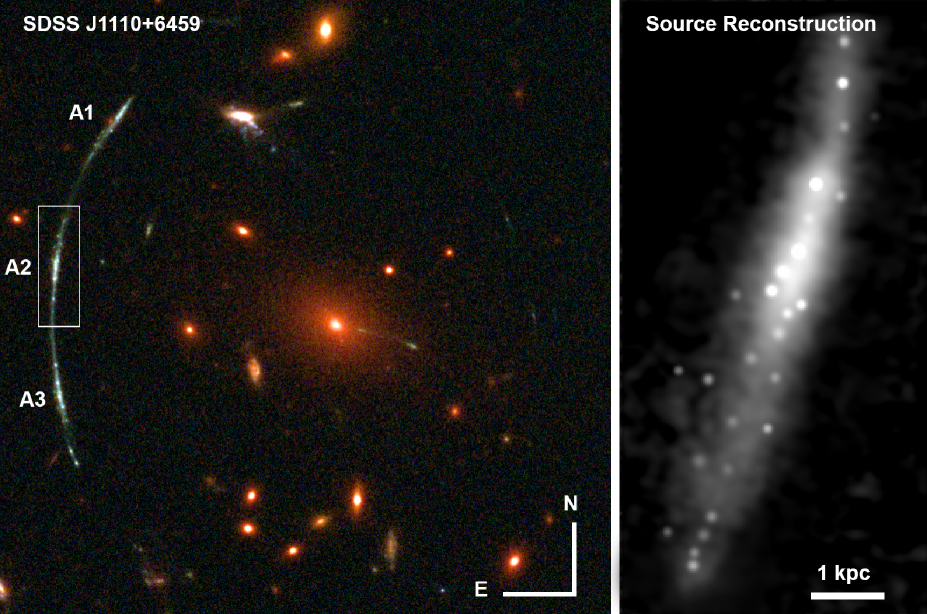
In this Letter, we use the gravitationally lensed galaxy arcname to provide a remarkably sharp view into how stars form in the distant universe. The giant arc, at redshift , is comprised of three images of the galaxy with a total magnification of (Figure 1.)
High spatial resolution, provided by rest-frame UV imaging with HST plus lensing magnification, and combined with a new forward-modelling technique (Johnson et al. 2017, hereafter Paper I), reveals that the morphology of star formation is extremely clumpy. There is also a spatially extended component with rest-frame UV color indistinguishable from that of the clumps (Rigby et al. 2017, hereafter Paper II). SGAS 1110 is forming stars at a rate of M⊙ yr-1 (uncertainties from SED fitting, and from the magnification uncertainty; Paper II.) The galaxy’s stellar mass is M⊙, with associated uncertainties of from SED fitting and from the magnification uncertainty (Paper II). This stellar mass is comparable to the median M⊙ for the lensed sample with H measurements from Livermore et al. (2015). The peak contribution to the global star formation rate density at comes from galaxies with about ten times higher stellar mass, with galaxies of the stellar mass of SGAS 1110 contributing three to five times less (Leja et al., 2015). Were SGAS 1110 not lensed, HST would measure it to be forming stars in a smooth, exponential disk, with a size and structure that is typical for galaxies of its redshift and stellar mass (Paper II).
Paper I produced a lens model of galaxy cluster SDSS J1110+6459, and also developed a novel forward–modeling technique that reconstructs the sizes and brightnesses of the clumps in the source plane. This method has advantages over traditional ray-tracing techniques in that it is able to effectively deconvolve the source from the “lensing point spread function” (PSF), which results as a combination of the telescope/instrumental PSF and asymmetric shear of lensing. Paper I used extensive simulations to determine the detectability of clumps as a function of intrinsic physical size and luminosity.
Accordingly, with star-forming clumps detected with sizes down to pc, SGAS 1110 provides the sharpest view of a galaxy yet obtained. In this Letter, we analyze the distribution of star formation surface density within SGAS 1110, as well as the clump luminosity function and size distribution function. In doing so, we probe, for the first time, star formation at cosmic noon on spatial scales well below 100 pc.
II. Methods
This Letter builds on the results from Paper I and Paper II. In Paper I, we constructed a source-plane model of the unlensed image of each of the emission clumps in SGAS 1110, modeling each clump as a Gaussian parameterized by its half-width-at-half-maximum (HWHM) size and its intrinsic flux normalization. Paper I also provides an estimate of the flux completeness limit of in F606W (the magnitude at which artificially injected clumps were recovered of the time), and quantifies the smallest spatial scales that can be distinguished in the source plane due to lensing PSF. The constraints on the stellar populations that are used in this Letter were derived in Paper II, from a spectral energy distribution analysis.
In this work, we estimate the star formation rates (SFR) of the clumps in SGAS 1110 as follows. To obtain the intrinsic rest-frame ultraviolet flux density, we integrate the 2D Gaussian that best fits the F606W source-plane reconstruction of each clump, and divide by () to correct for bandwidth compression. We use Equation 1 of Kennicutt (1998) to estimate the SFR, with a correction factor of 1.8 to convert the initial mass function from Salpeter to Chabrier. In calculating SFRs, we assumed no extinction, given the constraints of –0.2 derived from fitting the spectral energy distribution (Paper II).
In the following sections, we compare our results to measurements of SFR inferred from Paschen luminosities of H II regions in nearby galaxies (Liu et al., 2013). To convert the Paschen inferred rate, we use Equation 2 of Kennicutt (1998), with the same correction factor for the initial mass function. We take 8.45 as the intrinsic H/Pa ratio, which assumes Case B recombination, K, and cm-3.
We assume a flat cosmology with , , and km s-1 Mpc-1. In this cosmology, an angular size of 1″ corresponds to an angular diameter distance of 8.085 kpc at the redshift of SGAS 1110 at 2.481.
III. Results
The physical properties of individual star-forming clumps in SGAS 1110 can be compared to measurements of other galaxies from the literature, by examining the size–SFR space, and the distributions of sizes and SFRs of individual clumps or galaxies.
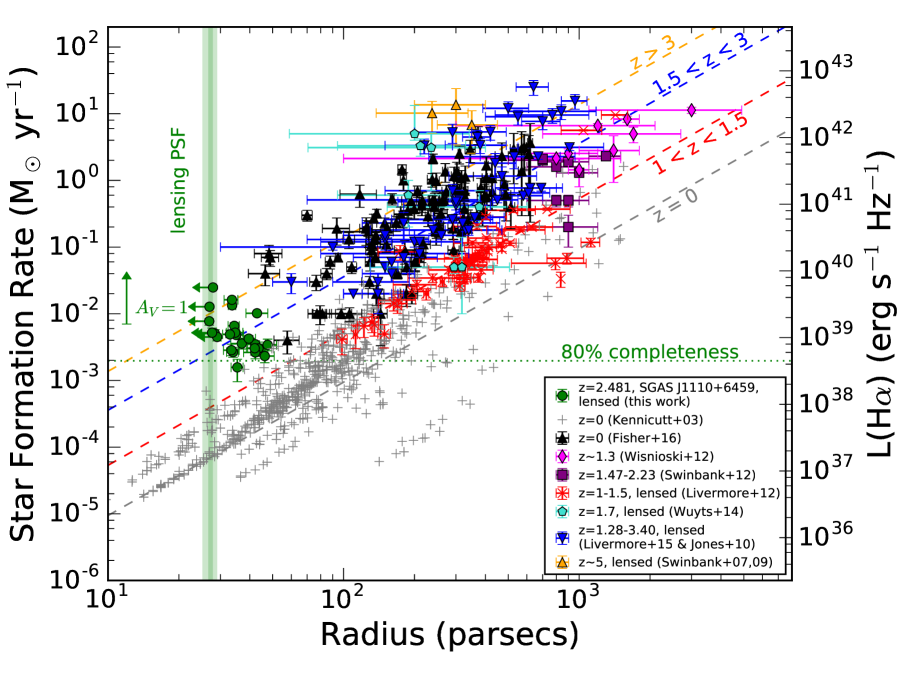
In Figure 2, we consider the surface density of star formation in the individual clumps in SGAS 1110. This plot, developed by Livermore et al. (2012) and Livermore et al. (2015), is a way to parameterize the intensity of star formation. We compare to literature measurements of galaxies at a range of redshifts, from to , both lensed and unlensed, mostly compiled by Livermore et al. (2015).
For SGAS 1110, the SFR is inferred from the rest-frame ultraviolet (F606W filter) as explained in § II. In the comparison samples, the star formation rates for most of the measurements come from H, with the exception of the Swinbank et al. (2007) and Swinbank et al. (2009) samples, which use the [O II] 3727, 3729 Å doublet. Local measurements come from the SINGS galaxy sample (Kennicutt Jr et al., 2003) and the DYNAMO sample (Fisher et al., 2016). Relative to Livermore et al. (2015), we have changed how the SINGS galaxies are plotted; since Livermore et al. (2015) did not probe as small clumps sizes as we do here, they had binned each galaxy and applied a surface brightness threshold, to match the spatial resolution and depth of their sample of lensed galaxies. Here, we re-measure the SINGS galaxies without binning. We note that of the galaxies, the samples of Swinbank et al. (2012) and Wisnioski et al. (2012) samples are not gravitationally lensed, whereas the other distant galaxy samples are lensed.
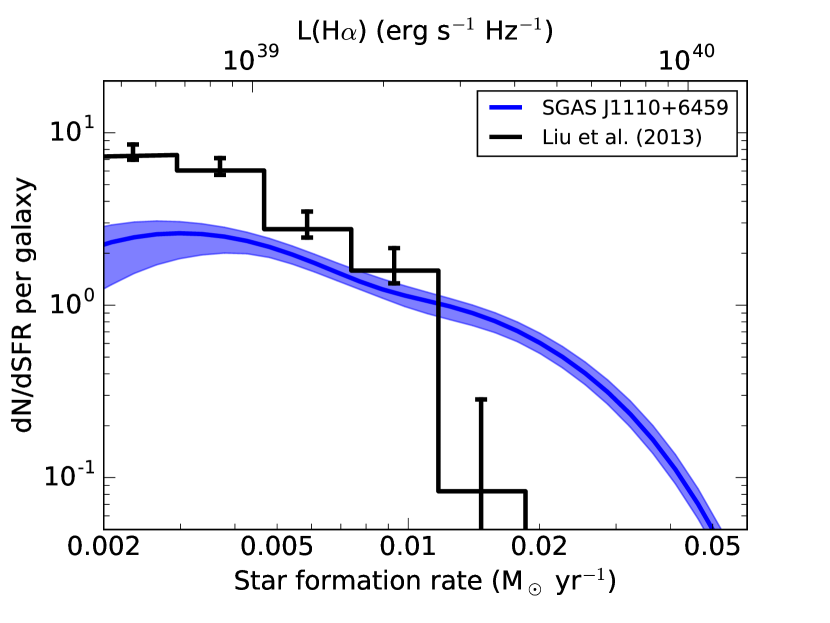
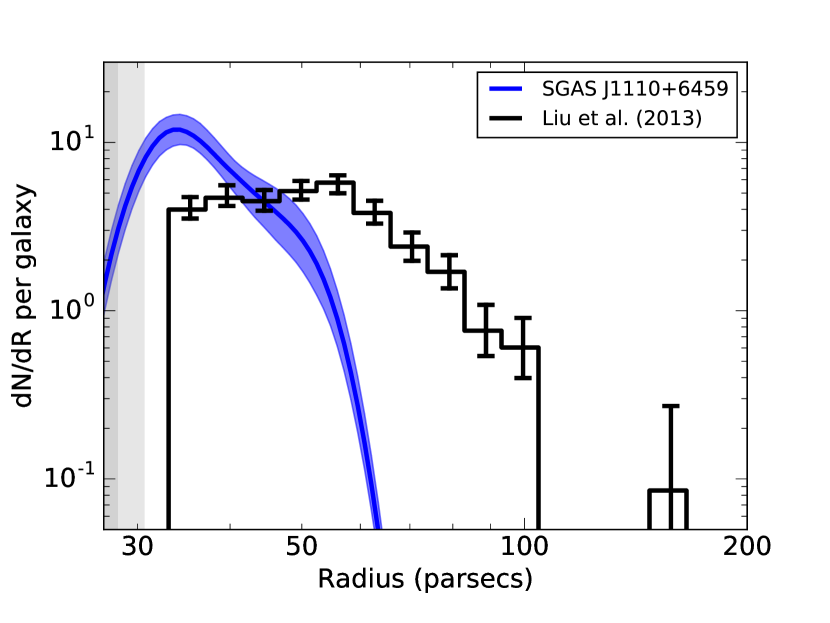
In Figures 3 and 4, we plot the differential luminosity function of clumps in SGAS 1110, and differential distribution of clump sizes, respectively, and compare them to measurements from the nearby universe (Liu et al., 2013).
We measure the SFR surface density at for star-forming clumps with radii below 100 pc. To the best of our knowledge, this is the first time that size scales well below 100 pc have been measured in the distant universe. In Figure 2, the clumps from SGAS 1110 follow the line of constant star formation surface density that has been measured (Livermore et al., 2015), for larger size scales, at this epoch. Thus, we confirm previous results (Livermore et al., 2012, 2015) that star-forming clumps in bright lensed galaxies have high star formation surface density, considerably higher than observed in the SINGS sample (Kennicutt Jr et al., 2003) comparison sample, and comparable to those observed in the Fisher et al. (2016) sample.
Twenty-two percent of the rest-frame ultraviolet light of SGAS 1110 arises from more than twenty star-forming clumps, with measured sizes of –50 pc. The largest clump we measure is pc.
The clump luminosity function shows a similar slope and normalization to that observed for Pa at . Figure 3 shows reasonably good agreement, in the range of overlap, between the luminosity function we measure for SGAS 1110 and that measured using Pa for nearby galaxies by Liu et al. (2013). A detailed comparison is premature given that we are only examining one galaxy, but this result indicates the value of expanding such comparisons to larger samples of lensed galaxies.
The distribution function of clump size (Figure 4) is dominated by smaller clumps (–40 pc), and shows a notable lack of the larger ( pc) clumps that dominate the size distribution seen for P at (Liu et al., 2013). Simulations (Paper I) indicate that the smallest size scale we can recover in SGAS 1110 is about pc. Stochasticity is doubtless a factor at the larger sizes, given that we are only examining one galaxy, and prevents any comparison of the slope with the power law observed at larger sizes by Liu et al. (2013).
IV. Discussion
Previous measurements (Livermore et al., 2012, 2015) of the evolution of star formation surface density over cosmic time shown in Figure 2 have been interpreted as evidence that galaxies become more extreme with increasing redshift, evolving toward higher star formation surface densities. However, there are important selection effects at work. The lensed galaxies plotted in Figure 2 are generally of high surface brightness. Since lensing preserves surface brightness, and surface brightness dimming scales as , we would expect only regions of high surface brightness to be observable in these galaxies (Calvi et al., 2014). Indeed, Figure 2 shows that for SGAS 1110, we could not recover clumps with the typical surface brightnesses of pc clumps from SINGS, but we could recover clumps with typical surface brightnesses of the DYNAMO sample (Fisher et al., 2016).
Given this, we cannot rule out a picture in which the star formation in SGAS 1110 is even clumpier than we can measure, and that the clumps we detect are only the brightest with highest surface brightness. This would explain why the spatially extended (“diffuse”) component shows the same rest-frame UV color as the clumps (Paper II).
The previous use of SINGS (Kennicutt Jr et al., 2003) as the comparison sample may have exaggerated the contrast between and , since the SINGS sample, by selection, does not include vigorously star-forming galaxies. By contrast, Figure 2 shows that the clumps from the DYNAMO galaxies (Fisher et al., 2016) have star formation surface densities an order of magnitude higher than those of the SINGS galaxies, and indeed just as high as those seen at .
In the future, it will be possible with JWST to make apples-to-apples comparisons between the most luminous clumps in nearby luminous infrared galaxies, and the most luminous clumps in lensed galaxies, for example using H integral field unit spectroscopy from NIRSpec, or Paschen integral field spectroscopy from MIRI.
Nevertheless, the measurements presented in this Letter indicate that at the epoch of galaxy assembly, star formation occurred on much smaller spatial scales than has been previously assumed. Such spatial scales have not been previously accessed in the distant universe, as without lensing magnification, they fall below the resolution limit of present day telescopes.
The lensed galaxy SGAS 1110 at 2.481 is forming stars at a rate of M⊙ yr-1 (uncertainties from SED fitting, and from the magnification uncertainty; Paper II.) High spatial resolution, provided by rest-frame UV imaging of HST plus lensing magnification, reveals that about of this star formation occurs in more than twenty star-forming knots with characteristic sizes of –50 pc. The rest of the star formation occurs in a spatially extended component with a rest-frame UV color indistinguishable from that of the clumps (Paper II).
The star formation rate surface density of the clumps in SGAS 1110 is consistent with previous measurements at for other lensed and unlensed galaxies. What is new is that much of the star formation is seen to occur on spatial scales as small as 30 pc—spatial scales not previously accessed in the distant universe, as without lensing magnification, they would be smaller than the resolution limit of present day telescopes.
To the best of our knowledge, the only other estimates for star forming regions as small as the ones we are measuring at these redshifts come from observations of the Frontier Fields (Lotz et al., 2017), using 140-orbits of HST per cluster. Vanzella et al. (2017b, a) report the discovery of three young, compact star clusters at redshift , behind the lensing clusters MACS J0416 and AS1063, with effective radii of pc.
In the local universe, star formation on such small spatial scales would not be surprising (c.f. Liu et al. 2013, Larson et al. in prep.). However, our result runs contrary to a theoretical picture that has emerged over the past decade: that 1 kiloparsec is a critical size scale, perhaps the critical scale, for star formation in the distant universe (Elmegreen & Elmegreen, 2005; Elmegreen et al., 2007, 2009; Förster Schreiber et al., 2011; Guo et al., 2011, 2015), driven by gravitational instabilities in gas-rich disks (Toomre, 1964; Noguchi, 1999; Genzel et al., 2011), in sites of cold gas accretion (Kereš et al., 2005; Dekel & Birnboim, 2006; Brooks et al., 2009). Our measurements form a cautionary counter-example to this picture, indicating that star formation can happen on much smaller scales in the distant universe.
This Letter examines just one of the SGAS lensed galaxies imaged by HST. Future application of the techniques of Paper I to the full sample will provide a much richer picture of star formation on small spatial scales at high redshift.
In conclusion, the exceptionally fortuitous lensing geometry in SGAS 1110, combined with new lensing methods (Paper I), provide an opportunity to probe spatial scales as yet unresolved by HST at this redshift. If the nature of SGAS 1110 is typical of its epoch, then much of the star-formation in the distant universe may take place on spatial scales much smaller than 1 kiloparsec. Our lensing–assisted measurements of SGAS 1110 suggest that the theoretical picture of star formation in the early universe requires revision, and that most star formation in the distant universe awaits resolution by future UV/optical space telescopes.
References
- Brooks et al. (2009) Brooks, A. M., Governato, F., Quinn, T., Brook, C. B., & Wadsley, J. 2009, ApJ, 694, 396
- Calvi et al. (2014) Calvi, V., Stiavelli, M., Bradley, L., Pizzella, A., & Kim, S. 2014, ApJ, 102
- Dekel & Birnboim (2006) Dekel, A. & Birnboim, Y. 2006, Monthly Notices of the Royal Astronomical Society, 368, 2
- Einstein (1936) Einstein, A. 1936, Science, 84, 506
- Elmegreen & Elmegreen (2005) Elmegreen, B. G. & Elmegreen, D. M. 2005, ApJ, 627, 632
- Elmegreen et al. (2009) Elmegreen, B. G., Elmegreen, D. M., Fernandez, M. X., & Lemonias, J. J. 2009, ApJ, 692, 12
- Elmegreen et al. (2007) Elmegreen, D. M., Elmegreen, B. G., Ravindranath, S., & Coe, D. A. 2007, ApJ, 658, 763
- Fisher et al. (2016) Fisher, D. B., Glazebrook, K., Damjanov, I., Abraham, R. G., Obreschkow, D., Wisnioski, E., Bassett, R., Green, A., & McGregor, P. 2016, Monthly Notices of the Royal Astronomical Society, 464, 491
- Förster Schreiber et al. (2011) Förster Schreiber, N. M., Shapley, A. E., Genzel, R., Bouché, N., Cresci, G., Davies, R., Erb, D. K., Genel, S., Lutz, D., Newman, S., Shapiro, K. L., Steidel, C. C., Sternberg, A., & Tacconi, L. J. 2011, ApJ, 739, 45
- Genzel et al. (2011) Genzel, R., Newman, S., Jones, T., Förster Schreiber, N. M., Shapiro, K., Genel, S., Lilly, S. J., Renzini, A., Tacconi, L. J., Bouché, N., Burkert, A., Cresci, G., Buschkamp, P., Carollo, C. M., Ceverino, D., Davies, R., Dekel, A., Eisenhauer, F., Hicks, E., Kurk, J., Lutz, D., Mancini, C., Naab, T., Peng, Y., Sternberg, A., Vergani, D., & Zamorani, G. 2011, ApJ, 733, 101
- Gladders & Yee (2000) Gladders, M. D., & Yee, H. K. C. 2000, AJ, 120, 2148
- Guo et al. (2015) Guo, Y., Ferguson, H. C., Bell, E. F., Koo, D. C., Conselice, C. J., Giavalisco, M., Kassin, S., Lu, Y., Lucas, R., Mandelker, N., McIntosh, D. M., Primack, J. R., Ravindranath, S., Barro, G., Ceverino, D., Dekel, A., Faber, S. M., Fang, J. J., Koekemoer, A. M., Noeske, K., Rafelski, M., & Straughn, A. 2015, ApJ, 800, 39
- Guo et al. (2011) Guo, Y., Giavalisco, M., Cassata, P., Ferguson, H. C., Dickinson, M., Renzini, A., Koekemoer, A., Grogin, N. A., Papovich, C., Tundo, E., Fontana, A., Lotz, J. M., & Salimbeni, S. 2011, ApJ, 735, 18
- Jones et al. (2010) Jones, T. A., Swinbank, A. M., Ellis, R. S., Richard, J., & Stark, D. P. 2010, Monthly Notices of the Royal Astronomical Society, 404, 1247
- Kennicutt (1998) Kennicutt, R. C. 1998, Annual Review of Astronomy and Astrophysics, 36, 189
- Kennicutt Jr et al. (2003) Kennicutt Jr, R. C., Armus, L., Bendo, G., Calzetti, D., Dale, D. A., Draine, B. T., Engelbracht, C. W., Gordon, K. D., Grauer, A. D., Helou, G., Hollenbach, D. J., Jarrett, T. H., Kewley, L. J., Leitherer, C., Li, A., Malhotra, S., Regan, M. W., Rieke, G. H., Rieke, M. J., Roussel, H., Smith, J. D. T., Thornley, M. D., & Walter, F. 2003, Publications of the Astronomical Society of the Pacific, 115, 928
- Kereš et al. (2005) Kereš, D., Katz, N., Weinberg, D. H., & Davé, R. 2005, Monthly Notices of the Royal Astronomical Society, 363, 2
- Leja et al. (2015) Leja, J., van Dokkum, P. G., Franx, M., & Whitaker, K. E. 2015, ApJ, 798, 115
- Liu et al. (2013) Liu, G., Calzetti, D., Kennicutt, R. C. J., Schinnerer, E., Sofue, Y., Komugi, S., Egusa, F., & Scoville, N. Z. 2013, ApJ, 772, 27
- Livermore et al. (2012) Livermore, R. C., Jones, T., Richard, J., Bower, R. G., Ellis, R. S., Swinbank, A. M., Rigby, J. R., Smail, I., Arribas, S., Rodriguez Zaurin, J., Colina, L., Ebeling, H., & Crain, R. A. 2012, Monthly Notices of the Royal Astronomical Society, 427, 688
- Livermore et al. (2015) Livermore, R. C., Jones, T. A., Richard, J., Bower, R. G., Swinbank, A. M., Yuan, T.-T., Edge, A. C., Ellis, R. S., Kewley, L. J., Smail, I., Coppin, K. E. K., & Ebeling, H. 2015, Monthly Notices of the Royal Astronomical Society, 450, 1812
- Lotz et al. (2017) Lotz, J. M., Koekemoer, A., Coe, D., Grogin, N., Capak, P., Mack, J., Anderson, J., Avila, R., Barker, E. A., Borncamp, D., Brammer, G., Durbin, M., Gunning, H., Hilbert, B., Jenkner, H., Khandrika, H., Levay, Z., Lucas, R. A., MacKenty, J., Ogaz, S., Porterfield, B., Reid, N., Robberto, M., Royle, P., Smith, L. J., Storrie-Lombardi, L. J., Sunnquist, B., Surace, J., Taylor, D. C., Williams, R., Bullock, J., Dickinson, M., Finkelstein, S., Natarajan, P., Richard, J., Robertson, B., Tumlinson, J., Zitrin, A., Flanagan, K., Sembach, K., Soifer, B. T., & Mountain, M. 2017, ApJ, 837, 97
- Madau & Dickinson (2014) Madau, P. & Dickinson, M. 2014, Annual Review of Astronomy and Astrophysics, 52, 415
- Noguchi (1999) Noguchi, M. 1999, ApJ, 514, 77
- Shibuya et al. (2016) Shibuya, T., Ouchi, M., Kubo, M., & Harikane, Y. 2016, ApJ, 821, 72
- Swinbank et al. (2007) Swinbank, A. M., Bower, R. G., Smith, G. P., Wilman, R. J., Smail, I., Ellis, R. S., Morris, S. L., & Kneib, J.-P. 2007, Monthly Notices of the Royal Astronomical Society, 376, 479
- Swinbank et al. (2012) Swinbank, A. M., Sobral, D., Smail, I., Geach, J. E., Best, P. N., McCarthy, I. G., Crain, R. A., & Theuns, T. 2012, Monthly Notices of the Royal Astronomical Society, 426, 935
- Swinbank et al. (2009) Swinbank, A. M., Webb, T. M., Richard, J., Bower, R. G., Ellis, R. S., Illingworth, G., Jones, T., Kriek, M., Smail, I., Stark, D. P., & van Dokkum, P. 2009, Monthly Notices of the Royal Astronomical Society, 400, 1121
- Thilker et al. (2000) Thilker, D. A., Braun, R., & Walterbos, R. A. M. 2000, arXiv, 3070
- Toomre (1964) Toomre, A. 1964, ApJ, 139, 1217
- Vanzella et al. (2017a) Vanzella, E., Calura, F., Meneghetti, M., Mercurio, A., Castellano, M., Caminha, G. B., Balestra, I., Rosati, P., Tozzi, P., de Barros, S., Grazian, A., D’Ercole, A., Ciotti, L., Caputi, K., Grillo, C., Merlin, E., Pentericci, L., Fontana, A., Cristiani, S., & Coe, D. 2017a, Monthly Notices of the Royal Astronomical Society, 467, 4304
- Vanzella et al. (2017b) Vanzella, E., Castellano, M., Meneghetti, M., Mercurio, A., Caminha, G. B., Cupani, G., Calura, F., Christensen, L., Merlin, E., Rosati, P., Gronke, M., Dijkstra, M., Mignoli, M., Gilli, R., de Barros, S., Caputi, K., Grillo, C., Balestra, I., Cristiani, S., Nonino, M., Giallongo, E., Grazian, A., Pentericci, L., Fontana, A., Comastri, A., Vignali, C., Zamorani, G., Brusa, M., Bergamini, P., & Tozzi, P. 2017b
- Wisnioski et al. (2012) Wisnioski, E., Glazebrook, K., Blake, C., Poole, G. B., Green, A. W., Wyder, T., & Martin, C. 2012, Monthly Notices of the Royal Astronomical Society, 422, 3339
- Wuyts et al. (2014) Wuyts, E., Rigby, J. R., Gladders, M. D., & Sharon, K. 2014, ApJ, 781, 61
- Zwicky (1937) Zwicky, F. 1937, Phys. Rev., 51, 290