Space Motions of the Dwarf Spheroidal Galaxies Draco and Sculptor
based on HST Proper Motions with -year Time Baseline
Abstract
We present new proper motion (PM) measurements of the dwarf spheroidal galaxies (dSphs) Draco and Sculptor using multi-epoch images obtained with the Hubble Space Telescope ACS/WFC. Our PM results have uncertainties far lower than previous measurements, even made with the same instrument. The PM results for Draco and Sculptor are and . The implied Galactocentric velocity vectors for Draco and Sculptor have radial and tangential components: ; and . We study the detailed orbital histories of both Draco and Sculptor via numerical orbit integrations. Orbital periods of Draco and Sculptor are found to be 1–2 and 2–5 Gyrs, respectively, accounting for uncertainties in the MW mass. We also study the influence of the Large Magellanic Cloud (LMC) on the orbits of Draco and Sculptor. Overall, the inclusion of the LMC increases the scatter in the orbital results. Based on our calculations, Draco shows a rather wide range of orbital parameters depending on the MW mass and inclusion/exclusion of the LMC, but Sculptor’s orbit is very well constrained with its most recent pericentric approach to the MW being 0.3–0.4 Gyr ago. Our new PMs imply that the orbital trajectories of both Draco and Sculptor are confined within the Disk of Satellites (DoS), better so than implied by earlier PM measurements, and likely rule out the possibility that these two galaxies were accreted together as part of a tightly bound group.
1 Introduction
The orbital histories of Milky Way (MW) satellites contain crucial information about the formation and assembly history of the MW halo. Direct access to proper motion (PM) measurements is required to derive their orbits. Despite the various efforts to measure PMs of MW satellites in the past decade or so, both the quantity and the quality of measurements are still lacking. The only clear solution to this problem is to directly measure PMs of tracer objects, but this has been technically challenging due to the difficulty in measuring very small apparent motions. The excellent astrometric capability of HST has eased the situation, and combined with our PM measurement technique using background galaxies as stationary reference sources (Sohn et al., 2012), we are now able to reach unprecedented PM accuracies using multi-epoch HST data.
As part of our HSTPROMO collaboration (van der Marel et al., 2014), we are carrying out HST programs to measure PMs of MW satellite objects. For example, we measured the PM of Leo I using multi-epoch ACS/WFC images separated by 5 years in time, and explored its orbits under realistic MW potentials (Sohn et al., 2013). In addition, by comparing the observed parameters based on our PM measurements to Leo I-like subhalos found in cosmological simulations, we constrained the virial mass of the MW (Boylan-Kolchin et al., 2013). We are continuing to measure PMs of distant satellites in the MW halo, including ultra-faint dwarfs and classical dwarf spheroidal galaxies (dSphs). This study focuses on two classical dSphs, Draco and Sculptor.
Draco and Sculptor are located at distances of 76 and 86 kpc, respectively. As dynamical tracers, they probe the MW mass at important distances where there are only a limited number of tracer objects with tangential velocities. The MW mass is generally estimated through equilibrium modeling using observed dynamical properties of halo tracers like satellites. Without the knowledge of tangential velocities, however, the mass estimates suffer from the (in)famous mass-anisotropy degeneracy. Watkins, Evans, & An (2010) used older PM measurements of Draco and Sculptor (Scholz & Irwin, 1994; Piatek et al., 2006), along with those of other dwarf satellites, to estimate the mass of the MW. However, the quality of these older PM measurements have limited their ability to constrain the MW mass with high confidence.
Draco and Sculptor are interesting because, while they are found at similar Galactocentric distances, they appear to be orbiting around the MW in opposite directions. This was first noted by Pryor, Piatek, & Olszewski (2008)who analyzed the space motions of galaxies with the PMs that existed at the time. Many of the satellite galaxies of the MW are found to be distributed on a “Disk of Satellites (DoS)”, an orbital plane claimed to be occupied by most of the classical dwarf satellites of the MW (Lynden-Bell, D., 1976; Kroupa et al., 2005; Metz et al., 2007). Most dwarfs that are believed to be members of the DoS and also have PM measurements are found to orbit in the same direction about the MW, with the notable exception of Sculptor. Interestingly, Sculptor seems to be orbiting around the plane in the opposite direction of most satellites. Pawlowski, Kroupa, & de Boer (2011) tried to explain this in the context of tidal-dwarf galaxies. Better PM measurements for a representative galaxy that rotates along the plane (Draco), and for a galaxy that seems to counter-rotate (Sculptor) are needed to shed new light on this matter.
This picture is further complicated by perturbations from the MW’s most massive satellite galaxy, the Large Magellanic Cloud (LMC). It is unclear whether the gravitational pull of the LMC might complicate the orbits of the classical satellites, causing their membership to the plane of satellites to be unstable. The recent capture of the LMC by the MW (Besla, 2007; Kallivayalil et al., 2013) may limit its dynamical influence on the DoS members, but this is impossible to properly assess without accurate PM measurements for the classical dwarfs. Draco and Sculptor, with their opposite sense of motions, and the coincidence of their orbital planes with that of the LMC, present an ideal test case for the influence of the LMC on the DoS.
As with other satellite objects in the MW halo, the first PM measurements of Draco and Sculptor were carried out using photographic plates (Scholz & Irwin, 1994; Schweitzer et al., 1995). The quality of these measurements is poor by modern standards.111The one-dimensional PM uncertainties were for Draco and for Sculptor. It was not until the use of HST that PM uncertainties were small enough that the results were meaningful. Piatek et al. (2006) used multi-epoch imaging data obtained with the Space Telescope Imaging Spectrograph (STIS) onboard HST to measure the PM of Sculptor. They used quasi-stellar objects (QSOs) in two fields as stationary reference sources to reach a final 1-d PM uncertainty of . For Draco, Pryor, Piatek, & Olszewski (2015) measured the PM using both QSOs and background galaxies in a single field to achieve a 1-d PM uncertainty of . Meanwhile, Casetti-Dinescu & Girard (2016) used ground-based images obtained with the Subaru Suprime-Cam to measure the PM of Draco with a smaller 1-d PM uncertainty of . Notwithstanding the level discrepancy found against the HST measurement by Pryor, Piatek, & Olszewski (2015), this study demonstrates what can be achieved using wide-field detectors on an 8-meter class telescope when extensive calibrations are carried out. It also provides hints on what to expect in the LSST era for PM measurements with large telescopes.
In this paper, we present our new PM measurements for Draco and Sculptor using multi-epoch HST imaging data separated by years in time. This paper is organized as follows. In Section 2, we describe the data, outline the analysis steps, and report the results of our PM measurements. In Section 3, we derive the Galactocentric space motions of Draco and Sculptor by correcting the measured PMs for the solar motions. In Section 4, we explore the implications for the past orbits of Draco and Sculptor under various assumptions for the mass of the MW, and also explore the gravitational influence of the Large Magellanic Cloud (LMC) on their orbits. Finally, in Section 5, we summarize the main results of our paper.
2 Proper Motions
2.1 Data
| Epoch 1 | Epoch 2 | |||||||
|---|---|---|---|---|---|---|---|---|
| R.A. | Decl. | Date | Exp. Time | Date | Exp. Time | |||
| Field | (J2000) | (J2000) | (Y-M-D) | (s) | (Y-M-D) | (s) | ||
| Draco | F606W | F606W | F814W | |||||
| F1 | 17:21:01.34 | 57:58:38.5 | 2004-10-19 | 430s19 | 2013-10-14 | 453s12 | 300s3 | |
| F2 | 17:21:51.69 | 58:01:41.0 | 2004-10-31 | 430s19 | 2012-10-24 | 501s12 | 300s3 | |
| F3 | 17:19:29.97 | 57:58:10.2 | 2004-10-30 | 430s19 | 2012-10-26 | 507s12 | 300s3 | |
| Sculptor | F775W | F775W | F606W | |||||
| F1 | 00:59:57.31 | 33:46:23.5 | 2002-09-28 | 417s5 | 2013-09-29 | 419s16 | 150s4 | |
| F2 | 00:59:48.61 | 33:48:47.1 | 2002-09-26 | 400s6 | 2013-09-29 | 419s16 | 150s4 | |
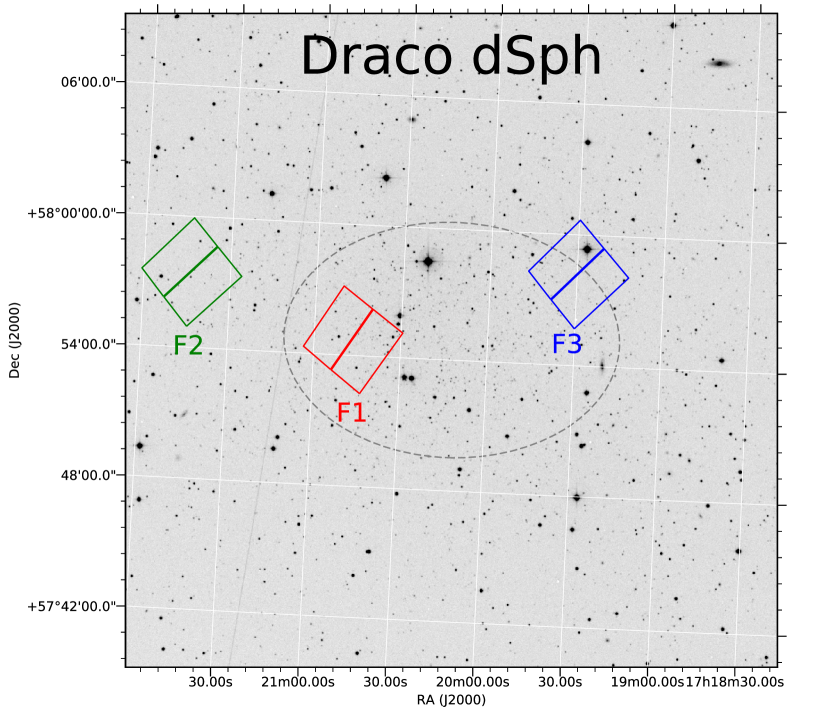
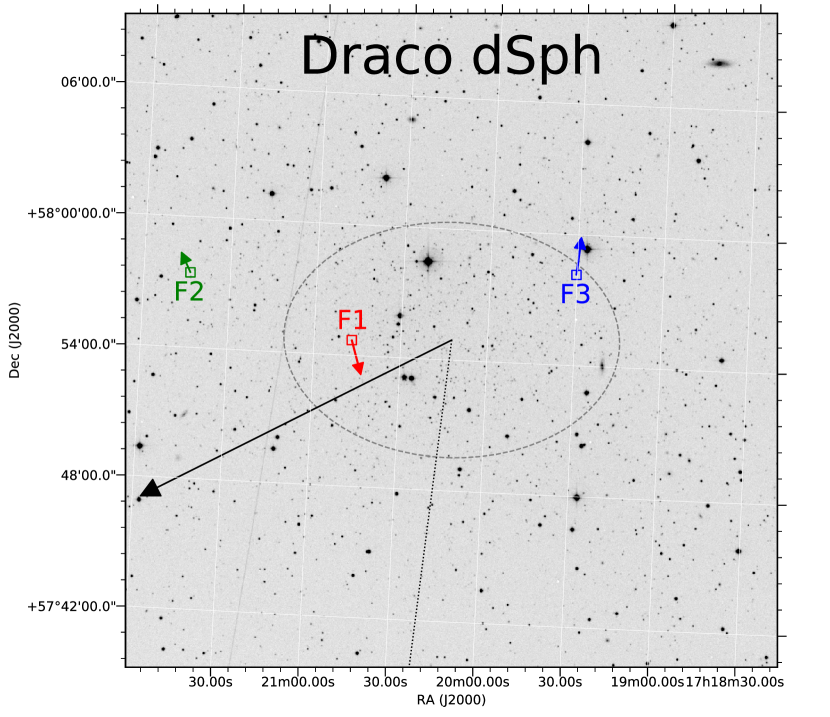
Figure 1 shows the HST ACS/WFC fields we used for measuring the PMs of Draco and Sculptor. The first-epoch ACS/WFC data for Draco were observed in 2004 October through the HST program GO-10229 (PI: S. Piatek). 222Our DRACO-F1, -F2, and -F3 fields are identical to the Dra 2, Dra 3, and Dra 1 fields of Pryor, Piatek, & Olszewski (2015), respectively. Field DRACO-F1 was observed with ACS/WFC again two years later in 2006 October through HST program GO-10812 to measure the PM of Draco. Results using these two-year baseline data have been reported in Pryor, Piatek, & Olszewski (2015). The DRACO-F1 and -F2 fields were observed in F606W, while the DRACO-F3 field was observed in F555W to avoid saturating the quasi-stellar objects (QSOs). Due to the failure of ACS/WFC in 2006–2007, fields DRACO-F2 and -F3 were observed with WFPC2 in 2007 December. However, we did not consider using the WFPC2 data for PM measurements for the same reasons as discussed in our Leo I paper (Sohn et al., 2013).
All three Draco fields were re-observed through our HST program GO-12966 (PI: R. van der Marel) using the same configurations (i.e., filters, telescope pointings, and orientations) as in the 2004–2006 observations. The DRACO-F1 field was observed in 2013 October, and DRACO-F2 and -F3 in 2012 October. All three target fields of Draco have QSOs in them as well as plenty of bright and compact background galaxies that can be used as stationary reference objects.
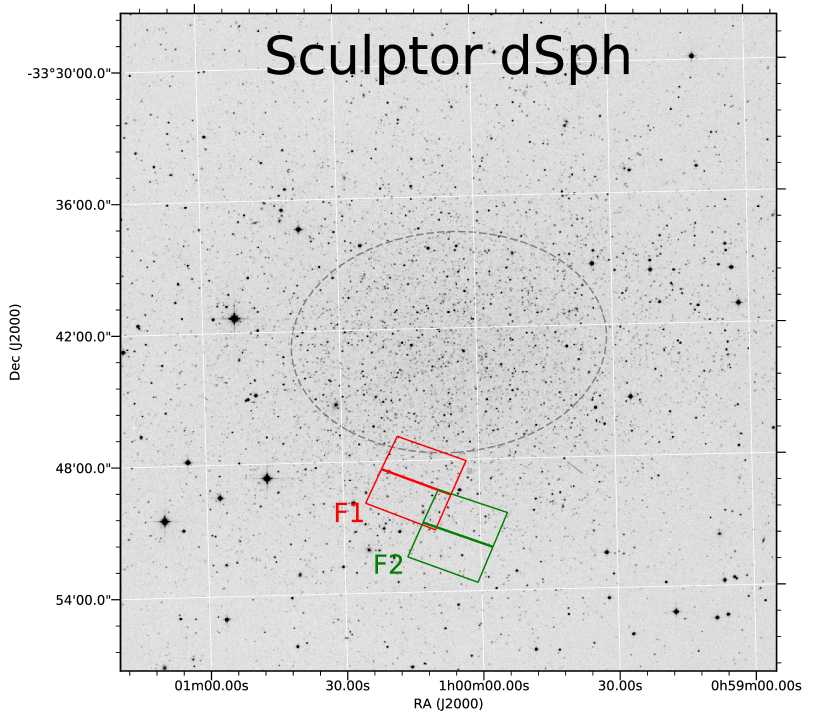
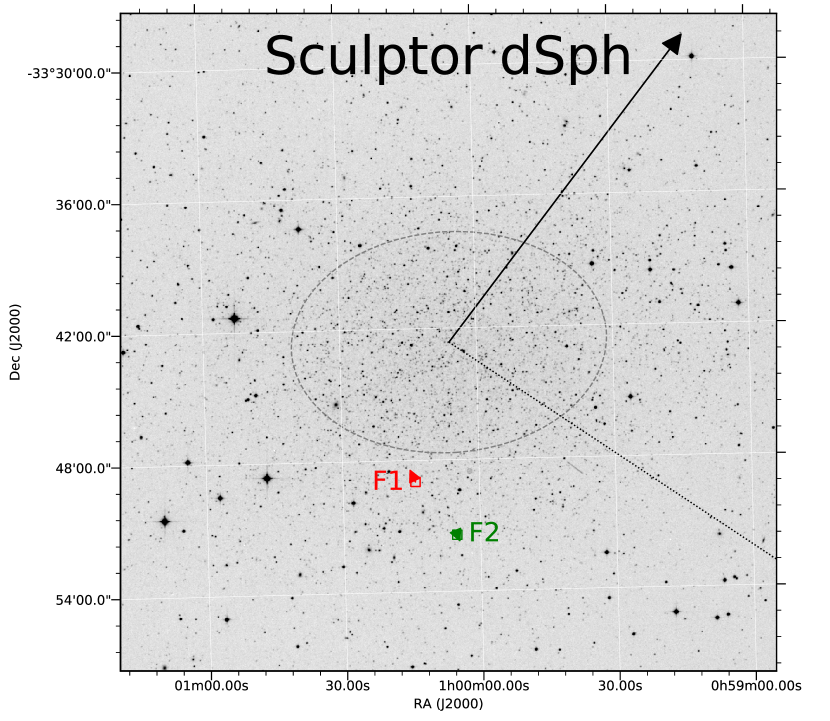
For Sculptor, we used two fields just outside the core radius as shown in Figure 1. The first-epoch data for Sculptor were observed in 2002 September through HST program GO-9480 to measure the weak lensing (or cosmic shear) of background galaxies. We re-observed these two fields in 2013 September, again using the same telescope pointings and orientations as in the 2002 observations.
In the course of our second-epoch observations through program GO-12966, we also acquired short exposures in different filters (F814W for the Draco fields, and F606W for the Sculptor fields) to construct color-magnitude diagrams (CMDs) of stars in our target fields. A summary of observations for each target galaxy is shown in Table 1.
The primary goal of our HST GO-12966 program is to study the internal PM dynamics of stars in Draco and Sculptor, and we are in the process of analyzing the results which will be presented in a separate forthcoming paper. All of the exposures obtained through our HST GO-12966 program made use of the experimental POST-FLASH capability to mitigate the impact from charge transfer efficiency (CTE) losses. This was important because the typical exposure time for individual images were all about 500 sec, which is significantly less than those in our other studies (e.g., Sohn et al., 2013).
2.2 Measurements
We compared the two epochs of F606W/F555W (for Draco) and F775W (for Sculptor) observations to measure the absolute PMs of our target galaxies. This was accomplished by determining the shifts of member stars in the dSphs with respect to two different types of stationary objects, galaxies and QSOs, in the distant background. Our methodology generally follows that of our previous works on M31 and Leo I (Sohn et al., 2012, 2013), and so we refer readers interested in the the details to those papers. Here we outline the main features of our PM derivation process.
2.2.1 Initial Analysis Steps
We downloaded both the regular flat-fielded _flt.fits and corrected _flc.fits images from the Mikulski Archive for Space Telescopes (MAST). The latter images are pre-processed for the imperfect charge transfer efficiency (CTE) using the pixel-based correction algorithms of Anderson & Bedin (2010). The PM measurements were performed using both sets of images since we were uncertain how the current version of the CTE correction routine we used performs on images obtained using the POST-FLASH option. We found that the _flc.fits images taken with the POST-FLASH option were somewhat overcorrected for the imperfect CTE which causes systematics in our PM measurements. Therefore, the final results were all derived from the _flt.fits images. We carefully examined the individual _flt.fits images for both epochs and found that the level of CTE loss for the images taken in 2012–2013 are comparable to those of the 2004–2006 data thanks to the 2012-2013 POST-FLASH observations. In the end, this has worked to our advantage for PM measurements since the impact of CTE loss on astrometry was found to almost cancel out when taking the difference in positions of objects between the two epochs. As we discuss below, we also used local corrections for mitigating the residual systematics.
As the first step, we processed the _flt.fits images using the img2xym_WFC.09x10 program from Anderson & King (2006) to obtain a position and a flux for each star in each exposure. We applied corrections to the the positions using the known ACS/WFC geometric distortions. We then created a high-resolution stacked image for each field using the first- (for the Draco dSph) and second-epoch (for the Sculptor dSph) images. Stars and galaxies were then identified from the stacked images. Photometric measures from the img2xym_WFC.09x10 program were used to create a CMD for each field, and this was used to identify member stars of our target dSphs. The subsequent analysis steps are different depending on which type of background objects are used as stationary references sources. We discuss further steps for each case below.
2.2.2 Background Galaxies as Stationary Reference Sources
For each star and background galaxy, a template was constructed from the high-resolution stacked image. This template was used to measure a position for each object in each individual exposure in each epoch. Templates were fitted directly to the images of the epoch from which they were created (first-epoch for Draco, and second-epoch for Sculptor). For fitting templates to the images of the other epoch, we included pixel convolution kernels to allow for PSF differences between epochs. These kernels were derived using bright and isolated Draco/Sculptor stars distributed throughout the fields.
The template-based positions of stars for multiple exposures were averaged and used to define first- (for the Draco dSph) or second-epoch (for the Sculptor dSph) reference frames. We used the positions of the stars in each of the second- (Draco) or first-epoch (Sculptor) exposures to transform the template-measured positions of the galaxies into the reference frames. We then took the difference between the first- and second-epoch positions of galaxies to obtain the relative displacement of the galaxies with respect to the dSph stars. To remove any remaining systematic PM residuals associated with the detector position and brightness of sources (e.g., due to imperfect CTE corrections) we derived and applied a local correction for each background galaxy using stars of similar brightness that lie in the vicinity. Finally, we multiply the relative displacements of the galaxies by to obtain the mean absolute displacement of the dSph stars, since in reality the galaxies/QSOs are stationary and the stars are moving. Multiplying the resulting displacements by the pixel scale of our reference images (), and dividing by the time baseline turns our results into actual PMs.
For the DRACO-F1 field, we have data obtained in 2004, 2006, and 2013 as described in Section 2.1. For the final PM measurement, we used the 2004 and 2013 data as our first and second epoch, respectively. The 2006 data were used to provide an extra check (see Section 2.3.1), but they were not included in our final results.
Because the DRACO-F3 field was observed with F555W, which has only about half the bandwidth of F606W, the background galaxies are significantly fainter than those detected in the F606W images. After attempting to construct and fit templates to the background galaxies in this field, we concluded that the overall quality of positional measurements were too poor to include in our results. For this reason, the PM results for DRACO-F3 field are only reported using QSOs as stationary reference sources (see Section 2.2.3).
2.2.3 QSOs as Stationary Reference Sources
All three of our Draco fields include QSOs in them, and we use these objects to provide an independent measurement of the Draco PM. For the DRACO-F1 field, Pryor, Piatek, & Olszewski (2015) used two QSOs, one detected in the top ACS/WFC chip (WFC1), and the other detected in the bottom chip (WFC2). Both QSOs were easily identified in our images thanks to Figure 2 of Pryor, Piatek, & Olszewski (2015). However, due to the increase in individual exposure times for our GO-12966 data, we found that the QSO located in WFC1 is slightly saturated in the images taken in 2012, making its positional measurement unreliable. We therefore decided to only use the QSO detected in WFC2. This QSO, and the QSOs in the other two Draco fields were detected in the 2012 data with counts well below the saturation limits.
For measuring PMs using QSOs as reference sources, we used the positions of QSOs and stars measured based on the library PSFs by the img2xym_WFC.09x10, instead of using the template-based positions described in Section 2.2.2. This is because the PSFs of QSOs are virtually indistinguishable from the PSFs of stars, and because the library-based positions are more accurate than the template-based positions. We start by only selecting member stars of Draco, based on their CMD properties, that are detected on the same ACS/WFC image quadrant as the QSO. The positions of these stars in each individual image are corrected for the known geometric distortions, and subsequently averaged separately for the first- and second-epoch data. The positions of stars in the first epoch data are used to define a reference frame. We then used the positions of stars in the second epoch to transform the position of the QSO into the reference frame. As a result, the PM of Draco stars can be inferred by taking the difference between the first-epoch reference QSO position and the second-epoch transformed QSO position, multiplying the results by , converting pixels to mas, and dividing by the time baseline.
The QSOs we used for measuring PMs are typically brighter than most of the Draco member stars we used for setting up the reference frame. For example, in the same quadrant as the QSO located in the DRACO-F1 field, there are only 18 out of 132 Draco stars that are brighter than the QSO. For the other two fields, the situation is worse: only two and one out of 68 and 42 Draco stars are brighter than the QSOs in fields DRACO-F2 and F3, respectively. This can potentially cause CTE-related systematics since the CTE degradation is known to be a strong function of the brightness of a source, and we are using stars of different brightnesses than the QSOs to define the reference frame. To correct for this effect, the procedure described above was iterated using Draco stars in different brightness ranges to define the reference frame. In our first iteration, the measurement was carried out using stars brighter than an instrumental magnitude of . 333The instrumental magnitude is defined as , where is the number of counts in the pixels around the brightest pixel. In subsequent iterations, we decreased this limit in steps of 0.5 mags until the faint limit was . For each step, we compute the PMs of the QSOs and the median magnitude of stars used in the transformation process. This provides a relation between the brightness of stars and the measured PMs. We fit a line to this relation, and computed the PM for the case of stars having the same brightness as the QSOs. These relations are monotonic implying that we are indeed correcting for the residual CTE effect. The final PMs of Draco stars with respect to the stationary QSOs were then derived using the same procedure as outlined in Section 2.2.2. The final PM uncertainties were obtained by taking the quadrature sum of the uncertainties in the average positions at the two epochs, and the uncertainties from fitting the lines to the PM versus brightness relation.
As with the case of using background galaxies as stationary references, we used the DRACO-F1 field’s 2006 data only as an extra check, and our final PM for this field was obtained using 2004 versus 2013 data.
2.3 Results
2.3.1 Draco Dwarf Spheroidal Galaxy
| aaProper motion in direction of West. Note that . | bbProper motion in direction of North. Note that . | |||
|---|---|---|---|---|
| Field | () | () | ||
| F1 (Galaxies) | ||||
| F1 (QSO) | ||||
| F2 (Galaxies) | ||||
| F2 (QSO) | ||||
| F3 (QSO) | ||||
| Weighted average | ||||
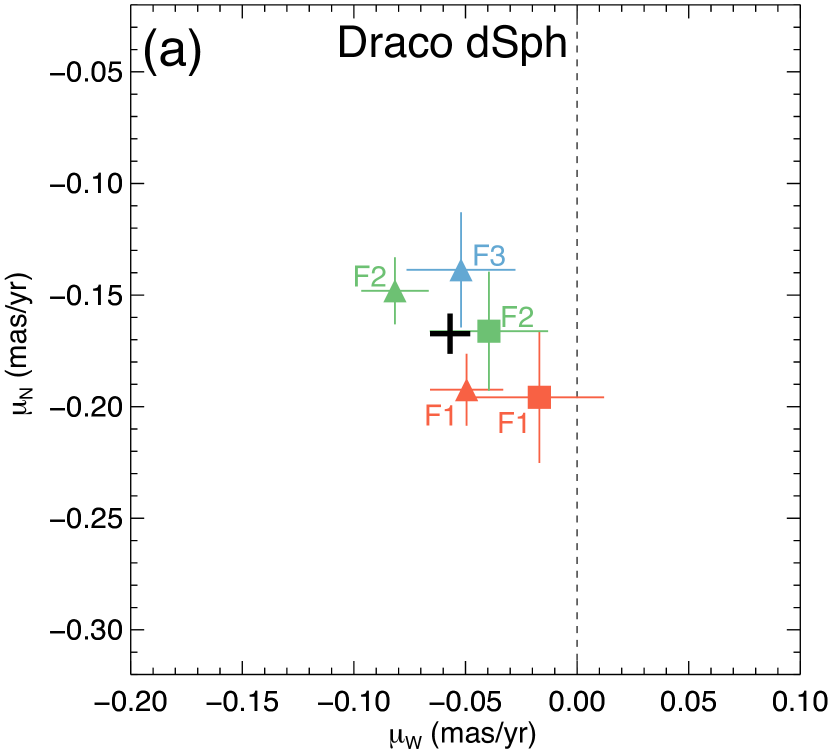
Our PM results for the Draco dSph are presented in Table 2, and the corresponding PM diagram is shown in Figure 2a. PM measurements using different background sources are plotted in different symbols, and results from each field are plotted in different colors. The PM results for the DRACO-F1 field in Table 2 was derived using a data set with a time baseline of 9 yr (2004 versus 2013). However, since we have images acquired in 2006 for this field, we used them as an external check by measuring PMs of Draco stars using 2006 data as the first epoch, and 2014 data as the second epoch. We followed the same procedure outlined in Section 2.2 to obtain PMs using both QSO and background galaxies as stationary references. The resulting 7 yr-baseline PMs are consistent within compared to the 9 yr-baseline PMs listed in the first two lines of Table 2 with slightly larger uncertainties as expected from the shorter time baseline.444We obtain using background galaxies, and using QSO as stationary references. This provides an additional check on our PM results for the DRACO-F1 field.
The uncertainties in the measurements are dominated by the random errors in the reference frame set by background galaxies or QSOs. These random errors are independent from each other. We therefore calculate the average PM of Draco by taking the error-weighted mean of the five measurements provided in Table 2, which yields
| (1) |
The final average of the five data points and associated uncertainties in each coordinate are plotted as a black cross in Figure 2a.
Overall, we find that measurements using different objects as stationary references agree well with each other. This provides confidence on our Draco PM results, and more generally on the PM measurement technique using background galaxies as stationary objects. Measurements for different fields also agree to within the error bars. To test the statistical agreement among the individual measurements listed in Table 2, we calculate the quantity
| (2) |
This quantity is expected to follow a probability distribution with an expectation value of the number of degrees of freedom () with a dispersion of . Since we have five independent measurements each in two directions on the sky, the is then expected to have a value of . From Table 2 and Equation 2, we find . Therefore, we find that our measurements in Table 2 are consistent within our quoted uncertainties.
Our final 1d PM uncertainty for Draco is in each direction. This is smaller than any other measurement uncertainties we have achieved using our PM measurement techniques, and therefore may appear to be beyond HST’s astrometric capabilities. However, this small uncertainty is mainly due to the time baselines being longer than our previous studies. For example, in our M31 study (Sohn et al., 2012), we achieved a 1d PM uncertainty of for time baselines of 5–7 years averaging results from three separate fields. Our Draco data also consists of measurements from three separate fields, but the time baselines are about 2.5 years longer than the M31 work. Simply scaling uncertainties of the M31 work by this time baseline ratio gives an estimated uncertainty of , which is consistent with our measured uncertainty for Draco. In our Leo I study (Sohn et al., 2013), we achieved a 1d PM uncertainty of using two epochs of ACS/WFC data separated by 5 yrs for a single field. Scaling by the time baseline ratio, and dividing by to account for the difference in the number of fields used for the measurement gives , which again is consistent with our PM uncertainty for Draco. We conclude that our PM measurement uncertainties for Draco are in line with expectations from our previous studies.
In both our previous studies mentioned above, we carried out detailed analyses to argue that there were no systematic errors in excess of the random errors. Since our smaller random errors here are merely due to a longer time baseline (which reduces random and systematic errors equally) and the higher number of fields, the same conclusions should hold true. Nevertheless, the difference between QSO and background galaxy results for DRACO-F1 and -F2 may indicate a small systematic effect. This is likely a problem with the QSO measurements since they (1) sample only one region on the detector, (2) do not average over multiple background sources, and (3) require a magnitude correction as demonstrated in Section 2.2.3. However, systematics are a problem only if they are correlated between different measurements, but we find no evidence for any such effects. Therefore, upon averaging, these systematics should decrease as as we have assumed in the averaging of our results.
As shown in Figure 1, our field locations for measuring the absolute PM are offset from the center of Draco by angular distances of 12–30′. If the internal motions of Draco stars in tangential directions are significantly large, our PM measurement may not represent the center of mass (COM) motion of Draco. This is particularly true if the tangential motions show a systematic pattern (e.g., clockwise or counter-clockwise rotation). To check this, we have subtracted the average PM of Draco from the PMs of each of our target fields and plotted the residual 2d motions on the sky in the left panel of Figure 4. We do not detect any rotational sign from the residual motions.
We also carried out additional checks as follows. Whereas so far, there are no internal PM measurements of Draco, the line-of-sight (LOS) velocity shows a slight rotation sign at the level of at a radius of 30′ along Draco’s major axis (Kleyna et al., 2001). However, given that this is smaller than the central LOS velocity dispersion of Draco (; Wilkinson et al., 2004), it has been claimed as non-significant (Kleyna et al., 2002). At the distance of Draco, is equivalent to , which is about twice the size of our final random error in Table 2. If Draco is rotating at this speed on the sky, our residual motions above would have shown systematic rotational signs, but we do not detect such sign. We note that Draco appears quite elongated on the sky (; Odenkirchen et al., 2001) suggesting that it is seen at high inclination. This implies that the rotation in the plane of the sky should be less than that along the LOS. Finally, even if the rotational motion was systematically affecting our PM results for each field, the final average should represent the systemic tangential motions of Draco given that our three target fields sample stars on both sides of the dwarf near the major axis at similar angular distances. For the reasons stated above, we adopt our PM results in Equation 1 as our final measurement for Draco.
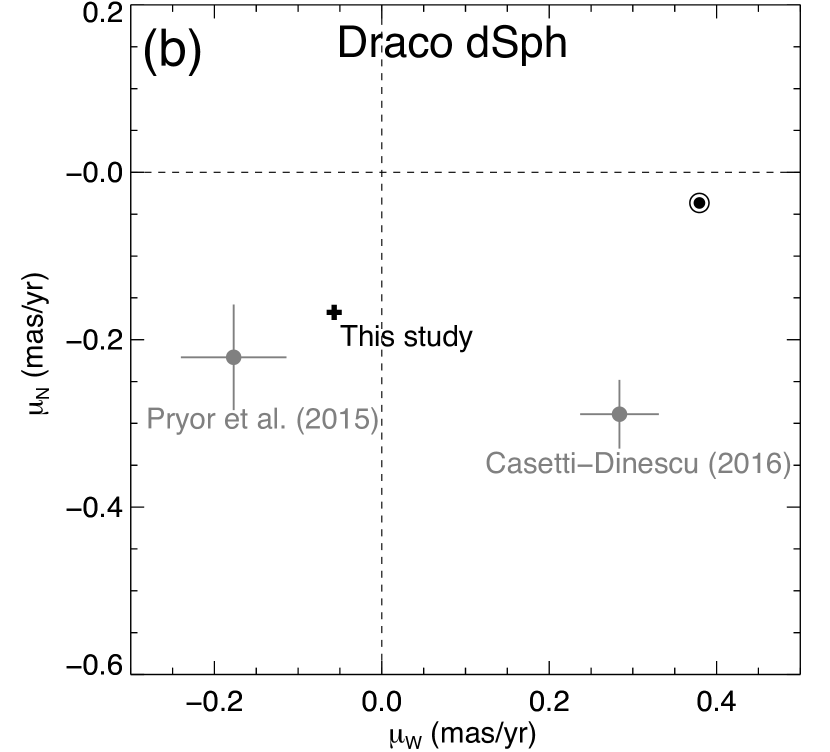
In Figure 2b, we compare our new PM results with the two recent PM measurements using data obtained with HST (Pryor, Piatek, & Olszewski, 2015) and the Subaru Telescope (Casetti-Dinescu & Girard, 2016). As mentioned in Section 2.1, the measurement by Pryor, Piatek, & Olszewski (2015) was obtained using a 2-year time baseline data for the DRACO-F1 field. While the two HST results are consistent within 1 in , they are discrepant at the level in , despite using the same field (albeit with a shorter time baseline), the same type of objects (QSOs and background galaxies), and similar techniques as used in this study. The source of this discrepancy is unclear, but it is reasonable to assume that PM results with longer time baselines (in this case, our results) are less subject to systematics. The comparison with the Subaru results show even larger discrepancies. Given that HST is less prone to systematics related to atmospheric effects and instrumental change, we believe our results are more reliable.
2.3.2 Sculptor Dwarf Spheroidal Galaxy
| Field | () | () | ||
|---|---|---|---|---|
| F1 (Galaxies) | ||||
| F2 (Galaxies) | ||||
| Weighted average | ||||
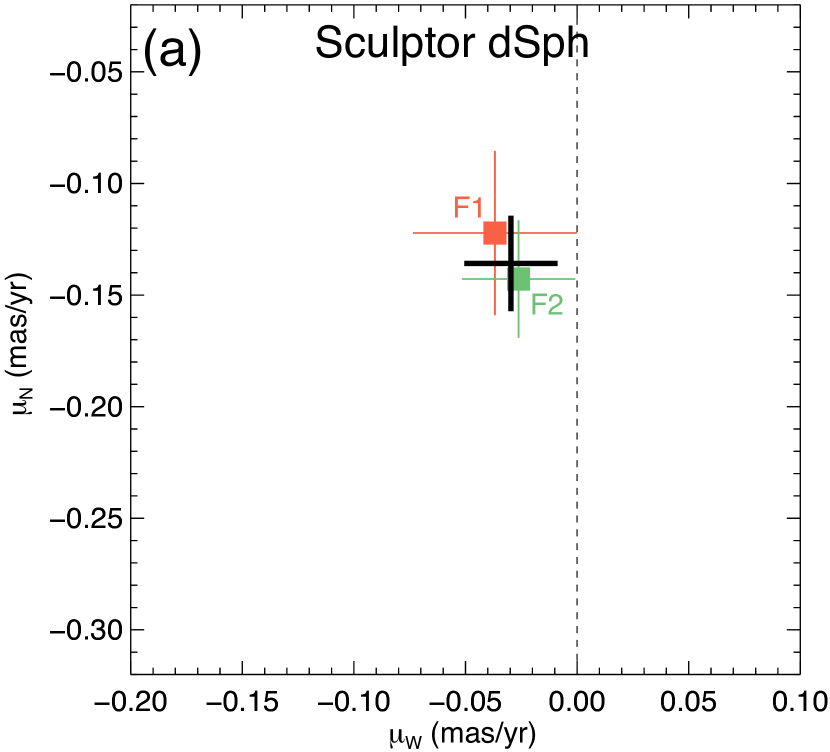
Our PM results for the Sculptor dSph are presented in Table 3, and the corresponding PM diagram is shown in Figure 3a. Since we only used background galaxies as stationary references for this galaxy, each field has a single measurement. The error-weighted mean of the two fields in Table 3 gives
| (3) |
As evident in Figure 3a, the independent measurements from our two observed fields are consistent with each other within . Indeed, we find which is in line with the expected value of .
For Sculptor, Battaglia et al. (2008) find a radial velocity gradient of per deg along its projected major axis, probably due to intrinsic rotation. Our target fields are located near the minor axis at 7–9 arcmin from the center of Sculptor. The residual 2d motions of our target fields after subtracting the average PM of Scultpor are shown as color arrows in the right panel of Figure 4. We note that the residual motions are too small to show compared to the average PM of Sculptor, demonstrating that the internal motions among the fields are negligible. Indeed, our 1d PM uncertainty at the distance of Sculptor is , so even if we assume that Sculptor has tangential motions at the same level of the radial velocity gradient, our PM uncertainties are comparable to this. Therefore, no correction for the COM motion of Sculptor is required, and we adopt Equation 3 as our final PM measurement for Sculptor.
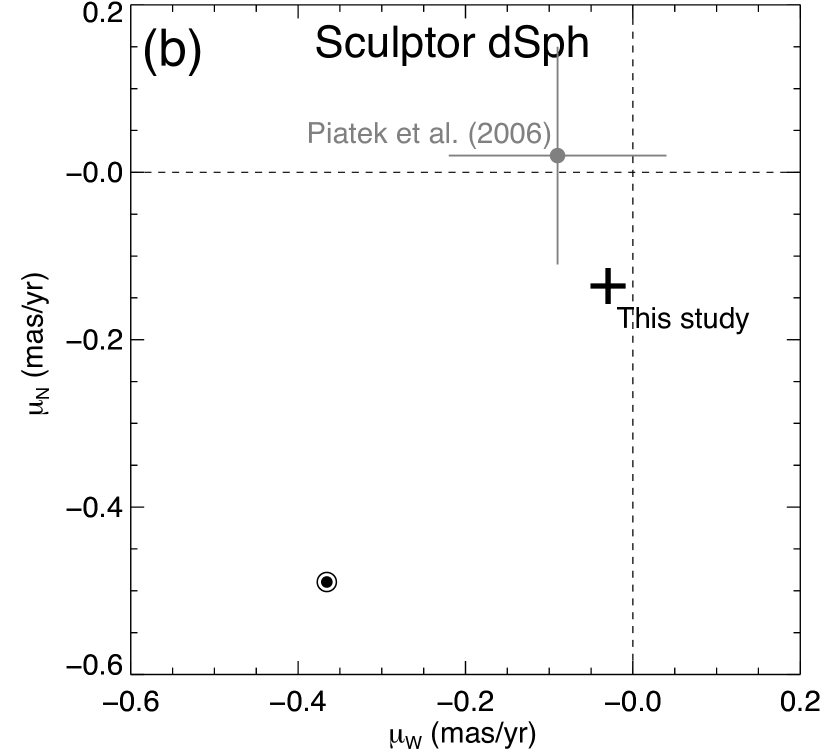
We compare our PM results with the HST measurement by Piatek et al. (2006). In their study, Piatek et al. (2006) used QSOs in two different fields to measure the absolute PM of Sculptor. The two measurements agree with each other within , with our 1d PM uncertainty being times smaller than that of Piatek et al. (2006). While both measurements employed the astrometric powers of HST, Piatek et al. (2006) used STIS data with time baselines of 2–3 yrs, while we used ACS/WFC data separated by 11 yrs. Field locations are significantly different, and so these two measurements can be considered as completely independent. The agreement between the two PM measurements, despite using different types of background sources in different fields observed with different detectors, highlights the success in using HST instruments as tools for measuring absolute PMs of dwarf galaxies in the MW halo.
3 Space Motions
3.1 Systemic Motions of Draco and Sculptor on the Sky
Our PM results in Section 2.3 include contributions from the motion of the Sun with respect to the MW. To obtain the systemic motions of Draco and Sculptor on the sky, we are required to subtract these contributions as follows. We adopt values of McMillan (2011) for the Galactocentric distance and the rotational velocity of the Local Standard of Rest (LSR): and . For the solar peculiar velocity with respect to the LSR, we adopt values of Schönrich et al. (2010): with uncertainties of . For heliocentric distances to Draco and Sculptor, we adopt (Bonanos et al., 2004), and (Pietrz’nsky et al., 2008), respectively. The contributions of solar motions in for each dwarf galaxy is then for Draco and for Sculptor. These are indicated as sun symbols in Figures 2b and 3b. Subtracting these solar motions from our PM measurements provides the net 2d motions of Draco and Sculptor on the sky: for Draco; and for Sculptor. These motions are illustrated in Figures 4 as black arrows along with the directions toward the Galactic Center as shown in dotted lines.
3.2 Space Velocities in the Galactocentric Rest Frame
We adopt the same Cartesian Galactocentric coordinate system () we used in our earlier studies of M31 and Leo I (Sohn et al., 2012, 2013) to describe the space velocities of Draco and Sculptor. In this system, the origin is at the Galactic Center, the -axis points in the direction from the Sun to the Galactic Center, the -axis points in the direction of the Sun’s Galactic rotation, and the -axis points toward the Galactic north pole. The position and velocity of Draco and Sculptor in this frame can be derived from the observed sky positions, distances, line-of-sight velocities, and PMs.
3.2.1 Draco Dwarf Spheroidal
For Draco, the Galactocentric position is
| (4) |
To calculate the 3-d space velocity of Draco, we adopt a heliocentric LOS velocity of , estimated by applying the chemo-dynamical model of Walker et al. (2015a) to the spectroscopic data set of Walker et al. (2015b). Combining this with our PM results in Section 2.3.1, the Galactocentric velocity of Draco becomes
| (5) |
The uncertainties listed here and hereafter were obtained from a Monte Carlo (MC) scheme by propagating all observed uncertainties (distance, velocity, and their correlations) including those for the Sun. The corresponding Galactocentric radial and tangential velocities are then
| (6) |
and the observed total velocity of Draco with respect to the MW is
| (7) |
3.2.2 Sculptor Dwarf Spheroidal
For Sculptor, the Galactocentric position is
| (8) |
We adopt a heliocentric LOS velocity of , obtained by applying the model of Walker et al. (2015a) to the spectroscopic data of Walker et al. (2009), and combining this with our PM results for Sculptor, we obtain a Galactocentric velocity of
| (9) |
The Galactocentric radial and tangential velocities are
| (10) |
and the total velocity of Sculptor with respect to the MW is
| (11) |
3.2.3 Escape Velocities
The escape velocity of a tracer object provides first-order insights into the enclosed mass at its distance. The escape velocity for a point mass is defined as
| (12) |
where is the Galactocentric distance to the tracer object. According to cosmological simulations, it is unlikely to find an unbound satellite at the present epoch near a MW-size galaxy (Boylan-Kolchin et al., 2013, but see Section 4.2 of this paper). Therefore, by forcing Draco and Sculptor to be bound to the MW, we can use the equation above to calculate the lower limit on the enclosed MW mass. Using the total velocities from Equations 7 and 11, we arrive at lower limits of the enclosed MW mass and at distances of kpc and 86 kpc, respectively.
Using the older PM measurement by Pryor, Piatek, & Olszewski (2015) and Piatek et al. (2006), the total velocities of Draco and Sculptor become and , respectively. These imply lower limits of enclosed MW masses of and at kpc and 86 kpc, respectively. In conclusion, our new PM measurements allow significantly lower MW masses based on the escape velocities.
4 The Orbits of the Draco and Sculptor Dwarf Spheroidal Galaxies
4.1 Orbital Properties of Draco and Sculptor
To explore the past orbital histories of Draco and Sculptor, we have numerically integrated their orbits backwards in time using the current Galactocentric positions and velocities derived in Section 3. The orbital integration scheme follows the same methodology used in Besla (2007), Sohn et al. (2013), and Patel et al. (2017).
In summary, the MW’s potential is modeled as a static, axisymmetric, three component model consisting of a dark matter halo, disk, and stellar bulge. We adopt the same three mass models for the MW as in Sohn et al. (2013) with total virial masses () of 1.0, 1.5, and 2.0. The MW disk mass was varied in each model such that the total rotation curve of the combined halo, disk and bulge peak at (McMillan, 2011). In addition, the MW’s dark matter halo is adiabatically contracted using the CONTRA code (Gnedin et al., 2004). The model parameters (concentrations, virial radii, and masses of the disks) for each MW model can be found in Table 2 of Sohn et al. (2013).
Draco and Sculptor are each modeled as Plummer spheres, with a total mass of . The softening lengths () are 2.3 kpc and 3.9 kpc for Draco and Sculpor, respectively. These values are chosen such that the halo mass matches the inferred total mass within the outermost data point of the empirical velocity dispersion profile, referred to as in Walker et al. (2009).
For our orbital integrations, we included the damping effects of dynamical friction. Since we are integrating orbits backwards in time, the damping of satellite orbits due to dynamical friction acts as an accelerating force. Dynamical friction is approximated by the Chandrasekhar formula (Chandrasekhar, 1943):
| (13) |
where and is the one-dimensional galaxy velocity dispersion. Here, is an approximation for an NFW profile, which was derived in Zentner & Bullock (2003). For three body encounters between Draco/Sculptor, the LMC, and the MW, the Coulomb logarithm, ln, takes the form of the 10:1 mass ratio parametrization described in van der Marel et al. (2012b, Appendix A) for the decay of the LMC’s orbit. For Draco and Sculptor, we have adopted the Coulomb logarithm from Hashimoto et al. (2003), which is . For Draco and Sculptor, the impact of dynamical friction on their orbits is minimal.
Following Patel et al. (2017), but in contrast to Besla (2007) and Sohn et al. (2013), the MW is not fixed in space in these calculations. Instead, the MW moves in response to the gravitational influence of the satellites, particularly from the LMC (see Section 4.2), throughout the integration period (see also Gomez et al., 2015).
The equations of motion corresponding to the gravitational potentials described above are then integrated backwards in time for 6 Gyr using a symplectic leap frog algorithm (Springel et al., 2001). Over longer timescales, the orbits of satellites are highly uncertain, e.g. owing to the accretion history of the MW itself (Lux et al., 2010).
| Period | |||||
|---|---|---|---|---|---|
| () | (kpc) | (Gyr) | (kpc) | (Gyr) | (Gyr) |
| Draco | |||||
| 1.0 | |||||
| 1.5 | |||||
| 2.0 | |||||
| Sculptor | |||||
| 1.0 | |||||
| 1.5 | |||||
| 2.0 | |||||
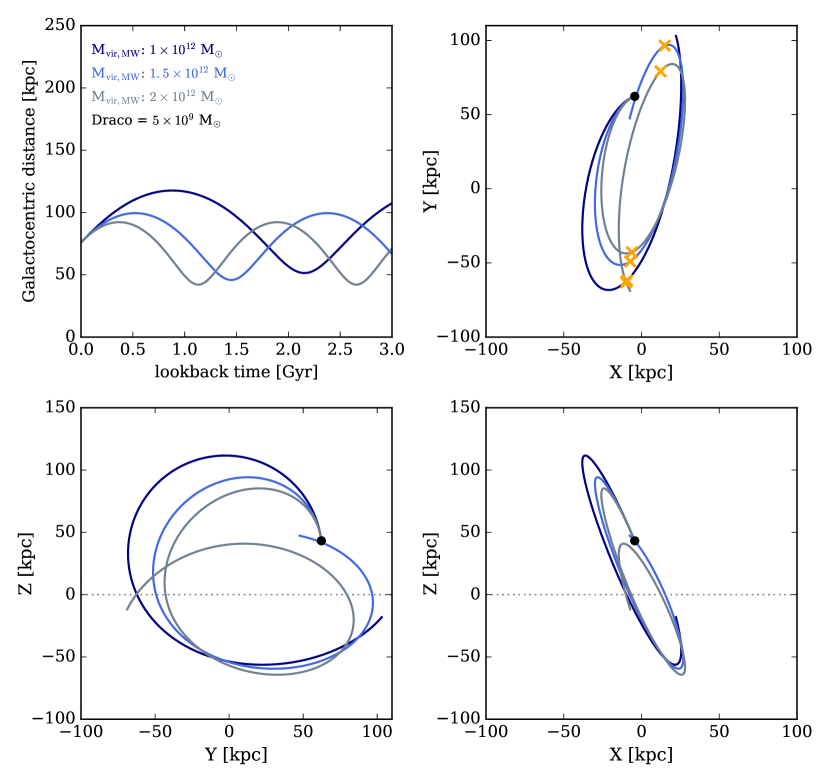
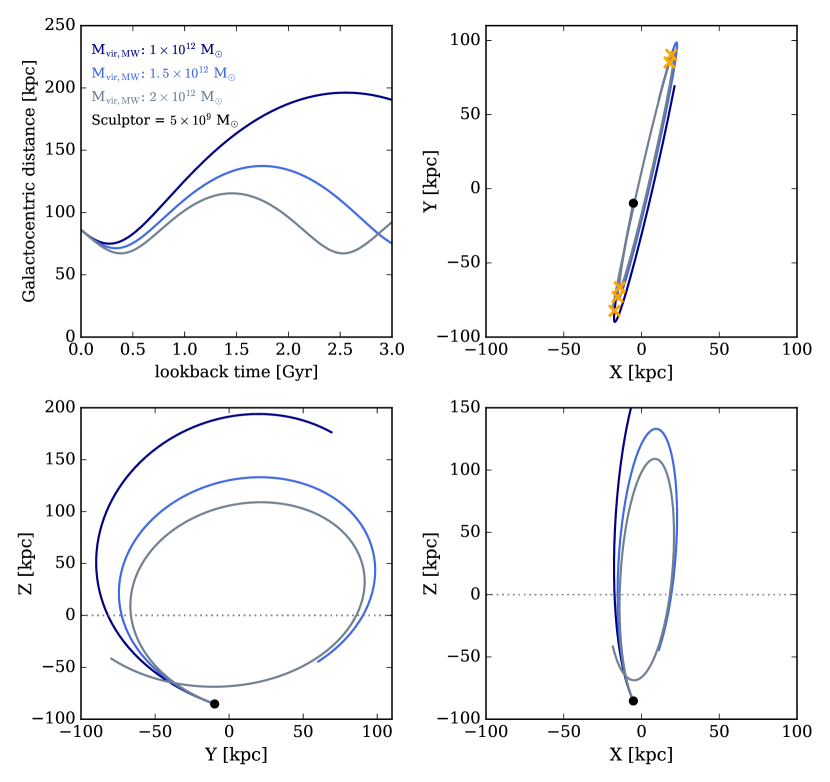
The orbital trajectories for Draco and Sculptor calculated using their mean positions (Equations 4 and 8) and velocities (Equations 5 and 9) for the past 3 Gyr are shown in Figures 5 and 6. The LMC is not yet included in these calculations. To explore the full range of plausible orbital histories, we use the 10,000 Monte Carlo realizations (see Section 3.2), which sample the uncertainties in distances, radial velocities, and PMs from normal distributions with means and standard deviations taken from the observed uncertainties. We then use positions and velocities for each realization to integrate orbits in the three MW mass models. This resulted in 60,000 orbital integrations in total for Draco and Sculptor combined.
Table 4 lists the distance and look-back time of the most recent pericentric and apocentric passages of Draco and Sculptor along with the orbital period, in the case where two pericentric passages exist within 6 Gyr. In the majority of cases, both Draco and Sculptor complete multiple orbits around the MW and remain within its virial radius over the past 6 Gyr. Only of Sculptor’s orbits in the model were in a “first-infall” orbit implying that it has not completed an orbit about the MW. No such cases for either dwarf occur in the higher mass MW models, i.e., 100% of orbits exhibit both a pericenter and an apocenter.
From our orbital analysis, we conclude that Draco passed the apogalacticon of its orbit 0.4–0.9 Gyr ago at a distance of 93–119 kpc, and is now approaching perigalacticon with an orbital period of 1–2 Gyr. Sculptor, on the other hand, recently passed perigalacticon 0.3–0.4 Gyr ago at a distance of 67–76 kpc, and is now moving further away from the Galactic center. Sculptor also has a longer orbital period of 2–5 Gyr. However, their average orbital eccentricities are similar – both are mildly elliptical at and for Draco and Sculptor, respectively.
In addition to being in different phases of their orbit, the two satellites have orbital angular momenta in almost the opposite direction on the celestial sphere, indicating that they orbit around the MW in opposite directions. This is most clearly seen when comparing the orbits of the two galaxies in the Y-Z plane (bottom left panels of Figures 5 and 6). We discuss these orbital features in the context of the DoS in Section 4.3.
4.2 The Dynamical Influence of the Large Magellanic Cloud
Other massive members of the Local Group may exert dynamical influence on the orbital histories of Draco and Sculptor. Given the distances of these satellites and their most likely association with the MW over the past 5 Gyr (see Section 4.1), the most relevant perturber to their current orbital motion is the LMC. To examine its dynamical influence on the orbits of Draco and Sculptor, we added the LMC to the orbital calculations. We adopted the same strategy as outlined in Section 4.1 for integrating orbits and analyzed the three-body interactions separately for the Draco-MW-LMC and the Sculptor-MW-LMC systems. These orbital calculations sample the full 4 error space of the LMC’s space motion and distance (Kallivayalil et al., 2013), in addition to the error space associated with Draco or Sculptor. Thus, each orbital realization randomly draws a set of position and velocity vectors from the 10,000 Monte Carlo drawings for the LMC and simultaneously for Draco or Sculptor. We note that the orbital angular momentum vector of the LMC is roughly aligned with that of Draco.
Gomez et al. (2015) showed that the orbital barycenter of the MW-LMC system significantly changes over time, depending on the mass of the LMC. Therefore, as noted earlier, the MW is not held fixed in space, but rather moves in response to the force of the LMC as a function of time. Our numerical orbit integration scheme therefore includes not only the LMC’s gravitational torque acting on Draco and Sculptor, but also the response of the MW’s COM to the presence the LMC.
The LMC is modeled as a Plummer sphere, and we consider three LMC mass models: 0.3, 1.0, and 2.5, respectively with softening lengths of 5.9, 13.1, and 19.5 kpc. This mass range encompasses observational constraints and cosmological expectations (see, Patel et al., 2017).
| Period | |||||||||
|---|---|---|---|---|---|---|---|---|---|
| () | () | (%) | (kpc) | (Gyr) | (%) | (kpc) | (Gyr) | % | (Gyr) |
| 0.3 | 100 | 100 | 99 | ||||||
| 1.0 | 1.0 | 96 | 96 | 77 | |||||
| 2.5 | 8 | 8 | 2 | ||||||
| 0.3 | 100 | 100 | 100 | ||||||
| 1.5 | 1.0 | 100 | 100 | 99 | |||||
| 2.5 | 93 | 93 | 45 | ||||||
| 0.3 | 100 | 100 | 100 | ||||||
| 2.0 | 1.0 | 100 | 100 | 100 | |||||
| 2.5 | 100 | 100 | 86 |
| Period | |||||||||
|---|---|---|---|---|---|---|---|---|---|
| () | () | (%) | (kpc) | (Gyr) | (%) | (kpc) | (Gyr) | (%) | (Gyr) |
| 0.3 | 100 | 99 | 99 | ||||||
| 1.0 | 1.0 | 100 | 89 | 74 | |||||
| 2.5 | 100 | 15 | 3 | ||||||
| 0.3 | 100 | 100 | 100 | ||||||
| 1.5 | 1.0 | 100 | 100 | 100 | |||||
| 2.5 | 100 | 99 | 99 | ||||||
| 0.3 | 100 | 100 | 100 | ||||||
| 2.0 | 1.0 | 100 | 100 | 100 | |||||
| 2.5 | 100 | 100 | 100 |
Tables 5 and 6 list the distance and look-back time of the most recent pericentric and apocentric passages of Draco and Sculptor about the MW, now accounting for the 3-body interactions of Draco/Sculptor-LMC-MW. In these tables, we also added columns that indicate the fraction of orbits that have a perigalactic approach () and an apogalacticton () within an integration time of 6 Gyr. Cases that do not have an apogalaticon have not completed an orbit, and are considered to be on their first infall to the MW. The final two columns list the fraction of orbits where two pericenters have occurred () and the average orbital period computed using the time of these close passages.
In the previous section, where the LMC was not included, most orbits had both an apocenter and pericentric approach to the MW within 6 Gyr. Here, we find that the LMC introduces significant scatter to the results. In the most extreme case of the lowest MW mass () and the highest LMC mass (), only 9% of Draco’s and 15% of Sculptor’s 10,000 MC realizations had closed orbits. In other words, for this light-MW heavy-LMC model, both galaxies were likely on their first approach to the MW within the past 6 Gyr. Based on these calculations, we can not rule out the possibility that Draco and/or Sculptor are making their first approaches to the MW.
Overall, we find that the orbital period and apocenter for both Draco and Sculptor systematically increases with the inclusion of the LMC. The timing of Sculptor’s most recent pericentric approach (0.3–0.4 Gyr ago) is a robust quantity, being largely unaffected by changes in MW or LMC mass. However, Sculptor’s pericentric distance decreases as the LMC mass increases. Draco’s orbit, on the other hand, is more strongly affected by the LMC’s inclusion than that of Sculptor.
4.3 The Association of Draco and Sculptor with the Disk of Satellites
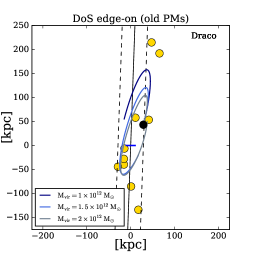
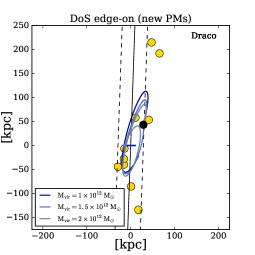
Draco and Sculptor are classical dSphs that have traditionally been included in the DoS. In light of our new PM estimates for these satellites, we revisit their dynamical association with the DoS. We define the DoS as in Kroupa et al. (2010), where 24 satellite galaxies within 254 kpc, including the 11 classical satellites are fit to a plane with a minimum disk height of 28.9 kpc.
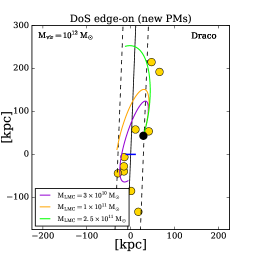
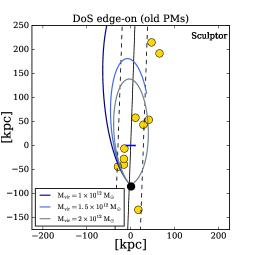
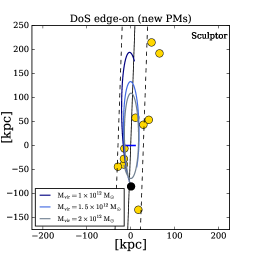
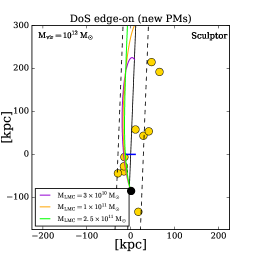
Figures 7 and 8 illustrate the orbital trajectory of Draco and Sculptor, respectively, over the past 3 Gyr in a viewing perspective such that the DoS is seen edge on. This perspective roughly coincides with the Galactocentric X–Z plane. The current positions of Draco and Sculptor are shown in black dots, while the other classical dSphs are shown in yellow. We compare orbital trajectories using the previous PM measurements (left panels) with those using the new PMs in this study (middle panels). The previous PM measurements were adopted from Pryor, Piatek, & Olszewski (2015) for Draco, and Piatek et al. (2006) for Sculptor, both of which are measured using HST data. Orbits are plotted for our 3 different MW mass models as indicated in the figure legends. Despite the fact that Draco and Sculptor are orbiting in opposite directions about the MW, both orbit within the thin DoS for the past 3 Gyr, regardless of the assumed MW mass. The agreement between the orbital trajectories of Draco and Sculptor and the DoS is substantially improved with the new PMs, especially for Sculptor.
We now examine whether perturbations from the LMC can affect the strong agreement between the orbits derived using the new velocity measurements and the DoS. In the right panels of Figures 7 and 8, the orbits of Draco and Sculptor for the lowest MW mass model () are plotted. We selected the lowest MW mass model to explore the configuration that yields the maximal perturbation on the satellites’ orbits by the LMC. The different trajectories are for the three different LMC mass models used in Section 4.2. We find that despite increasing the LMC mass to as high as , the orbits of Draco and Sculptor are still confined well within the DoS. This indicates that, while the LMC can substantially increase the apocenteric distance of the orbits of Draco and Sculptor, it does not introduce torques out of their orbital plane. This is not surprising since the LMC itself is orbiting within the DoS.
It remains unclear how such a tight agreement between the orbital planes of Draco and Sculptor can occur, given that these satellites are orbiting in opposite directions about the MW. Our results likely rule out a scenario in which Draco and Sculptor were accreted together as part of a tightly bound group. Cosmological simulations show that in such a scenario, the orbital angular momenta of all group members should be well aligned (Sales et al., 2011). This analysis, however, does not rule out that Draco and Sculptor were accreted as part of a loose group or tidal structures, which was split apart upon infall (e.g., Pawlowski, Kroupa, & de Boer, 2011).
Our newly-measured PMs place a new spotlight on an interesting problem. While it has been known that Draco and Sculptor are moving in opposite directions, we now know that their orbital planes are strongly confined within the DoS. Detailed studies of infalling groups of satellites may reveal how such satellite orbital configurations are created around MW-size galaxies.
5 Conclusions
We used HST ACS/WFC images to measure the proper motions of Draco and Sculptor. By comparing bulk motions of numerous stars in Draco and Sculptor with respect to distant background galaxies or QSOs, we find the PMs of Draco and Sculptor to be and . These are the most precise PMs measured so far for any satellite dSph in the MW halo. We compare our new PM results with previous measurements in the literature and find that they are mostly consistent at the 1–2 levels. However, our results are significant improvements over previous ones with 1d PM uncertainties being at least 5–7 times smaller.
To derive space velocities of Draco and Sculptor in the Galactocentric frame, we combined our PMs with known line-of-sight velocities and corrected for the solar reflex motions. As a result, our Galactocentric radial and tangential velocities are and . We used the total velocities of Draco and Sculptor to provide lower limits on the enclosed MW masses at the satellite distances. The resulting limits are and at distances of kpc and 86 kpc, respectively.
We used the PM results to revisit the orbital histories of Draco and Sculptor over the past 6 Gyr. Orbital periods of Draco and Sculptor are found to be 1–2 and 2–5 Gyrs, respectively, accounting for uncertainties in the mass of the MW. The inclusion of the LMC increases the scatter in these results. In the most extreme example of a low mass MW () and high mass LMC (), orbital solutions favor a scenario where Draco and Sculptor are on their first infall towards the MW. The inclusion of the LMC systematically increases the orbital period. However, Sculptor’s most recent pericentric approach to the MW at 0.3–0.4 Gyr ago is the most robustly determined orbital property, with little variation over a factor of 2 (10) change in halo mass for the MW (LMC).
The new PMs measured by this work imply a better agreement between the direction of motions of Draco and Sculptor and the purported DoS (Kroupa et al., 2005; Metz et al., 2007; Kroupa et al., 2010; Pawlowski & Kroupa, 2013). Specifically, the new PMs reveal that the orbital trajectories of both Draco and Sculptor are confined within the DoS for at least the past 3 Gyr. This result is robust to changes in MW halo mass and perturbations from the LMC, and likely rule out the possibility that Draco and Sculptor were accreted together as part of a tightly bound group.
References
- Anderson & King (2006) Anderson J., & King, I. R. 2006, ACS/ISR 2006-01, PSFs, Photometry, and Astrometry for the ACS/WFC (Baltimore: STScI) (AK06)
- Anderson & Bedin (2010) Anderson, J. & Bedin, L. R. 2010, PASP, 122, 1035
- Battaglia et al. (2008) Battaglia, G., Helmi, A., Tolstoy, E., et al. 2008, ApJ, 681, L13
- Bertin & Arnouts (1996) Bertin, E., & Arnouts, S. 1996, A&AS, 117, 393
- Besla (2007) Besla, G., Kallivayalil, N., Hernquist, L., et al. 20070, ApJ, 668, 949
- Besla (2010) Besla, G., Kallivayalil, N., Hernquist, L., et al. 2010, ApJ, 721, 97
- Bonanos et al. (2004) Bonanos, A. Z., Stanek, K. Z., Szentgyorgyi, A. H., Sasselov, D. D., & Bakos, G. Á. 2004, AJ, 127, 861
- Boylan-Kolchin et al. (2013) Boylan-Kolchin, M., Bullock, J. S., Sohn, S. T., Besla, G., & van der Marel, R. P. 2013, ApJ, 768, 140
- Casetti-Dinescu & Girard (2016) Casetti-Dinescu, D. I., & Girard, T. M. 2016, MNRAS, 461, 271
- Chandrasekhar (1943) Chandrasekhar, S. 1943, ApJ, 97, 255
- Efron & Tibshirani (1993) Efron, B., & Tibshirani, R. 1993, An Introduction to the Bootstrap (Chapman & Hall/CRC)
- Gomez et al. (2015) Gómez, F. A. and Besla, G. and Carpintero, D. D. and Villalobos, Á. and O’Shea, B. W. and Bell, E. F. 2015, ApJ, 802, 128
- Gnedin et al. (2004) Gnedin, O. Y., Kravtsov, A. V., Klypin, A. A., Nagai, D. 2004, ApJ, 616, 16
- Hashimoto et al. (2003) Hashimoto, Y. and Funato, Y. and Makino, J. 2003 , ApJ, 582, 196
- Kallivayalil et al. (2013) Kallivayalil, N., van der Marel, R. P., Besla, G., Anderson, J., & Alcock, C. 2013, ApJ, 764, 161
- Kleyna et al. (2001) Kleyna, J. T., Wilkinson, M. I., Evans, W., & Gilmore, G. 2001, ApJ, 563, L115
- Kleyna et al. (2002) Kleyna, J. T., Wilkinson, M. I., Evans, W., Gilmore, G., & Frayn, C. 2002, MNRAS, 330, 792
- Kroupa et al. (2005) Kroupa, P. and Theis, C. & Boily, C. M. 2005, A&A, 431, 517
- Kroupa et al. (2010) Kroupa, P., et al. 2010, A&A, 523, A23
- Lux et al. (2010) Lux, H., Read, J. I., & Lake, G. 2010, MNRAS, 406, 2312
- Lynden-Bell, D. (1976) Lynden-Bell, D. 1976, MNRAS, 174, 695
- Mahmud & Anderson (2008) Mahmud N., & Anderson, J. 2008, PASP, 120, 907
- McMillan (2011) McMillan, P. J. 2011, MNRAS, 414, 2446
- Metz et al. (2007) Metz, M., Kroupa, P., & Jerjen, H. 2007, MNRAS, 374, 1125
- Odenkirchen et al. (2001) Odenkirchen, M., Grebel, E. K., Harbeck, D., et al. 2001, AJ, 122, 2538
- Patel et al. (2017) Patel, E., Besla, G., Sohn, S.T. 2017, MNRAS, 464, 3825
- Pawlowski, Kroupa, & de Boer (2011) Pawlowski, M., Kroupa, P., & de Boer, K. S. 2011, A&A, 532, A118
- Pawlowski & Kroupa (2013) Pawlowski, M., Kroupa, P. 2013, MNRAS, 435, 2116
- Piatek et al. (2006) Piatek, S., Pryor, C., Bristow, P., et al. 2006, AJ, 131, 1445
- Pietrz’nsky et al. (2008) Pietrz’nsky, G., Gieren, W., Szewczyk, O., et al. 2008, AJ, 135, 1993
- Pryor, Piatek, & Olszewski (2008) Pryor, C., Piatek, S., & Olszewski, E. W. 2008, in Galaxies in the Local Volume, Astroph. & Space Sci. Proceedings, ed. B. .S. Koribalski, & H. Jerjen (Netherlands: Springer), 323
- Pryor, Piatek, & Olszewski (2015) Pryor, C., Piatek, S., & Olszewski, E. W. 2015, AJ, 149, 42
- Sales et al. (2011) Sales, L., Navarro, J. F., Cooper, A. P., White, S. D. M, Frenk, C. S, & Helmi, A. 2011, MNRAS, 418, 648
- Scholz & Irwin (1994) Scholz, R. -D., & Irwin, M. J. 1994, in IAU Symp. 161, Astronomy from Wide Field Imaging, ed. H. T. MacGillvray et al. (Dordrecht: Kluwer), 535
- Schönrich et al. (2010) Schönrich, R., Binney, J., & Dehnen, W. 2010, MNRAS, 403, 1829
- Schweitzer et al. (1995) Schweitzer, A. E., Cudworth, K. M., Majewski, S. R., & Suntzeff, N. B. 1995, AJ, 110, 2747
- Sirianni et al. (2005) Sirianni, M., Jee, M. J., Benítez, N., et al. 2005, PASP, 117, 1049
- Sohn et al. (2010) Sohn, S. T., Anderson, J., & van der Marel, R. P. 2010, in 2010 Space Telescope Science Institute Calibration Workshop - Hubble after SM4. Preparing JWST, ed. S. Deustua, & C. Oliveira (Baltimore, MD: STScI), 35
- Sohn et al. (2012) Sohn, S. T., Anderson, J., & van der Marel, R. P. 2012, ApJ, 753, 7
- Sohn et al. (2013) Sohn, S. T., Besla, G., van der Marel, R. P, et al. 2013, ApJ, 768, 139
- Springel et al. (2001) Springel, V. and Yoshida, N. and White, S. D. M. 2001, New A, 6, 79
- van der Marel et al. (2012a) van der Marel, R. P., Fardal, M., Besla, G., et al. 2012a, ApJ, 753, 8
- van der Marel et al. (2012b) van der Marel, R. P., Besla, G., Cox, T.J. et al. 2012b, ApJ, 753, 9
- van der Marel et al. (2014) van der Marel, R. P., Anderson, J., Bellini, A., et al. 2014, in ASP Conf. Ser. 480, Structure and Dynamics of Disk Galaxies, ed. M. S. Seigar & P. Treuthardt (San Francisco, CA: ASP), 43
- Walker et al. (2009) Walker, M. G., Mateo, M., Olszewski, E. W., et al. 2009, AJ, 137, 3100
- Walker et al. (2015a) Walker, M. G., Mateo, M., Olszewski, E. W., et al. 2015a, ApJ, 808, 108
- Walker et al. (2015b) Walker, M. G., Olszewski, E. W., & Mateo, M. 2015b, MNRAS, 448, 2717
- Watkins, Evans, & An (2010) Watkins, L. L., Evans, N. W., & An, J. H. 2010, MNRAS, 406, 264
- Westfall et al. (2006) Westfall, K. B., Majewski, S. R., Ostheimer, J. C., et al. 2006, AJ, 131, 375
- Wilkinson et al. (2004) Wilkinson, M. I., Kleyna, J. T., Evans, N. W., et al. 2004, ApJ, 611, L21
- Zentner & Bullock (2003) Zentner, A. R., & Bullock, J. S. 2003, ApJ, 598, 49