Stability of Surface Nanobubbles: A Molecular Dynamics Study
Abstract
The stability and growth or dissolution of a single surface nanobubble on a chemically patterned surface are studied by Molecular Dynamics (MD) simulations of binary mixtures consisting of Lennard-Jones (LJ) particles. Our simulations reveal how pinning of the three-phase contact line on the surface can lead to the stability of the surface nanobubble, provided that the concentration of the dissolved gas is oversaturated. We have performed equilibrium simulations of surface nanobubbles at different gas oversaturation levels . The equilibrium contact angle is found to follow the theoretical result of Lohse and Zhang[1], namely , where L is the pinned length of the footprint and a capillary length scale, with the surface tension and the ambient pressure. For undersaturation the surface nanobubble dissolves and the dissolution dynamics shows a "stick-jump" behaviour of the three-phase contact line.
1 Introduction
Surface nanobubbles are gaseous nanoscopic entities on an immersed surface that are less than 1 m in height [2]. The presence of surface nanobubbles has significant implications to many physical and chemical processes at solid-liquid interfaces, for example, in fabrication of bubble-templated nanostructures [3, 4, 5], propelling microscopic swimmers fuelled by catalytic reactions [6, 7], light conversion by plasmonic effects[8], heterogeneous cavitation under ultrasound[9, 10], onset of boiling on microscopic scale [11], and flotation in mineral processing [12, 13]. Hence the stability and the dynamics of surface nanobubbles is interesting from both a fundamental and from an applied point of view [2].
Experimental studies have shown that surface nanobubbles have long lifetime, even for only a mild oversaturation level supplied to the system[14, 15, 16, 17, 18]. When a bubble dissolves or grows, the morphological features of the bubble suggest a stick-slip motion of the contact line [19, 20]. The origin of pinning is attributed to intrinsic features of the solid surface. Different theories were proposed to explain the stability of surface nanobubbles [21, 22, 23, 24]. Recently Lohse and Zhang[1] provided the exact calculation for the stability of a single surface nanobubble[1]. Their derivation assumes pinning and builds on, not more than only the diffusion equation, Henry’s law, and the Laplace equation. Their calculation reveals that contact line pinning and the gas oversaturation in the bulk liquid are crucial for the equilibrium of the single surface nanobubble to be stable. Here is the gas oversaturation, the gas concentration, and the gas solubility. For a given gas oversaturation , there exists an equilibrium in which the outflux of gas molecules from the nanobubble due to the large Laplace pressure is compensated by the influx into the bubble due to gas oversaturation, i.e., there is no net flux. Though the flux of gas particles out or into the nanobubble is not spatially uniform along the interface as shown by Weijs et al.[25] and Yasui et al.[26], the net flux integrated over the whole interface is zero. The contact angle of the surface nanobubble is not given by Young’s equation, but determined by the equilibrium,
| (1) |
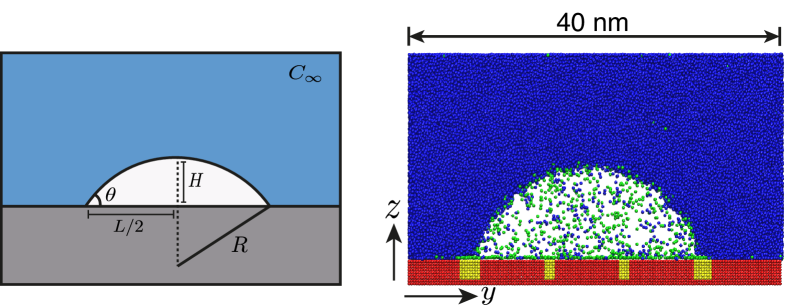
where L is the pinned length of the footprint and a capillary length scale, with the surface tension and the ambient pressure as shown in the sketch in Figure 1.
Meanwhile, molecular dynamics (MD) simulations have provided important insight into the dynamics of surface nanobubbles, in particular under the conditions that are difficult to achieve in experiments. Weijs et al.[25] performed molecular dynamics (MD) simulations of surface nanobubbles without any heterogeneities and found that nanobubbles are not stable. Liu and Zhang[27, 28] showed with the help of kinetic lattice density functional theory and MD simulations that contact line pinning on geometrical heterogeneities also leads to stable surface nanobubble. However, it remains unknown how exactly the oversaturation in the liquid and chemical patterns with a nanoscale dimension on a surface can mediate the stability of nanobubbles. Moreover, given that it is extremely difficult to confirm eq 1 experimentally, in this work we want to confirm it with the help of MD simulations.
We will present our simulations of the dynamics (stability, growth, and dissolution) of a single surface nanobubble on a chemically patterned surface, in response to different oversaturation levels. The chemical patterns act as pinning sites enabling us to study the growth or dissolution of surface nanobubbles on a more realistic solid substrate, exhibiting pinning and de-pinning of the contact line.
2 Approach and methodology
Molecular Dynamics (MD) simulations were performed to simulate the nanobubble on a solid substrate for which we used the open source code GROMACS[29]. We have used four types of particles or molecules in our simulations: two types of solid particles ( and ), which remain fixed in a fcc lattice during the whole simulation, and two types of moving particles, Liquid (L) and Gas (G). The particles form the pinning sites, and have different interaction strength towards the two types of moving particles. The L particles form a bulk liquid phase (and hence we refer to these as "liquid particles") as the system temperature and pressure are below the critical point of L particles whereas the G particles form a bulk gaseous phase (to which we refer as "gas particles") because the critical point for G particles is much below the thermodynamic conditions at which we are performing our simulations. A typical simulation box is shown in Figure 1.
The interaction between the particles is described by a Lennard-Jones potential:
| (2) |
in which is the interaction strength between particles and , and is the characteristic size of particles. The potential is truncated at a relatively large cut-off radius () of . The time step for updating the particle velocities and positions was set at , where is mass of the liquid particles and is the Lennard-Jones interaction parameter for the liquid particles. The time step has been chosen such that its value is sufficiently less than the shortest time scale available in the system[30]. Periodic boundary conditions have been employed in all three directions, which suggest that same solid substrate is also present above the liquid layer.
Simulations have been performed in a ensemble where the temperature is fixed at , which is below the critical point for the Lennard-Jones parameters (, ) that we have set for the liquid particles. Semi-isotropic pressure coupling is used for maintaining constant pressure which means that the simulation box can expand or contract only in the z-direction to keep the pressure constant. This has been done to avoid the creation of gaps along the solid surface boundaries in the x and y directions. Simulations were performed in a quasi-2D manner in which the length of the simulation box along the x-axis is considerably smaller than the lengths in the other two directions, which means the shape of the nanobubble is cylindrical instead of spherical. Simulations of cylindrical nanobubbles save computation time; of course the effect of the modified shape on the Laplace pressure is taken into consideration. The complete set of Lennard-Jones parameters that we have used in our simulations are given in table 1. The typical system size is in x, y and z direction respectively, where we note that the length of the z dimension changes during the simulation to keep the pressure constant.
| , nm | , kJ/mol | |
|---|---|---|
| -L | 0.34 | 1.8 |
| -L | 0.34 | 1.5 |
| -G | 0.40 | 2.0 |
| -G | 0.40 | 5.0 |
| L-G | 0.40 | 1.55 |
| G-G | 0.46 | 0.8 |
| L-L | 0.34 | 3.0 |
In the initial configuration, gas and liquid particles are arranged in a fcc lattice above the solid substrate. Initially, the liquid near the surface is highly oversaturated with gas particles in order to aid the bubble nucleation on the surface which decreases the equilibration time, which is around time steps (around 9 ns). For simulations at different pressures, we have used the final configuration of the previous simulation as an initial configuration to save computation time. In Figure 1 we show a typical equilibrium profile of a nanobubble on a chemical heterogenous surface.
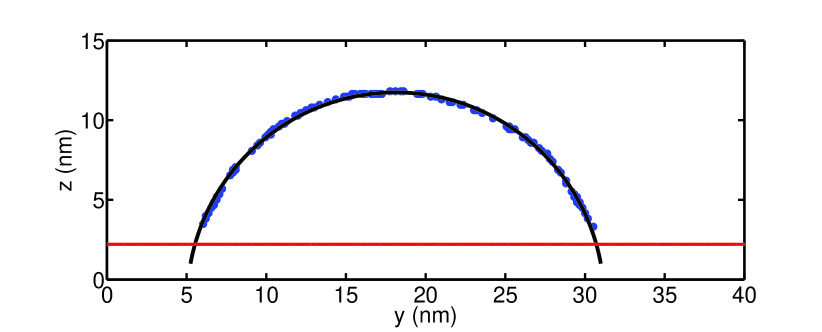
After the equilibrium has been reached, the time-average density field of liquid particles is calculated, correcting for the center of mass motion in the lateral direction. Quantities like the radius of curvature of the bubble and the contact angle are obtained by fitting a circle to the iso-density contour of of the normalised density field, , defined as , where and are the bulk vapour and liquid density, respectively. Since the liquid very near to the solid substrate is subject to layering, we have excluded the density field in the range of from the substrate for the circular cap fitting. From the intersection of the circular fit with the substrate, the contact angle and the radius of curvature are evaluated (see figure 2). In order to study the time evolution for these quantities, we have calculated these time-averages for subsequent subsets of 25000 time steps.
The contact line is pinned by the pinning sites, which are formed by the solid particles with higher hydrophobicity () as shown by different colours in Figure 1, which means that the interaction strength with gas particles is much higher than for the liquid particles. Exact values for the interaction strengths are tabulated in table 1. One can also notice from Figure 1 that the gas particles accumulate near the solid surface. This is due to the hydrophobic nature of the solid surface which strongly attracts the gas particles, as discussed in [31].
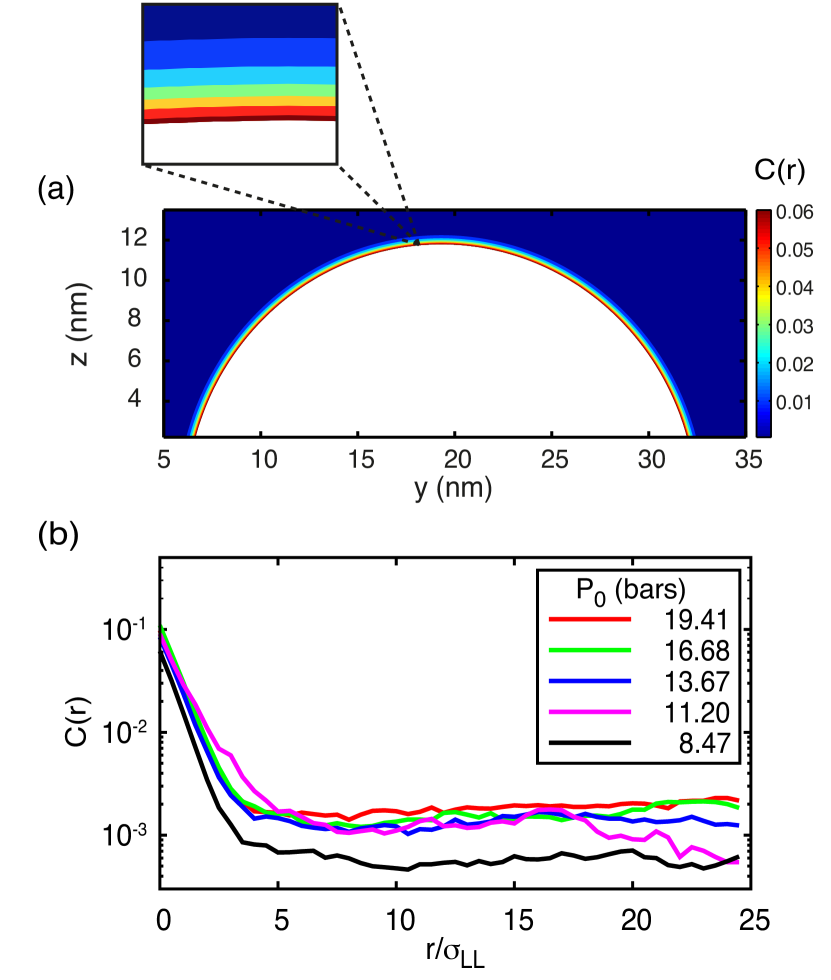
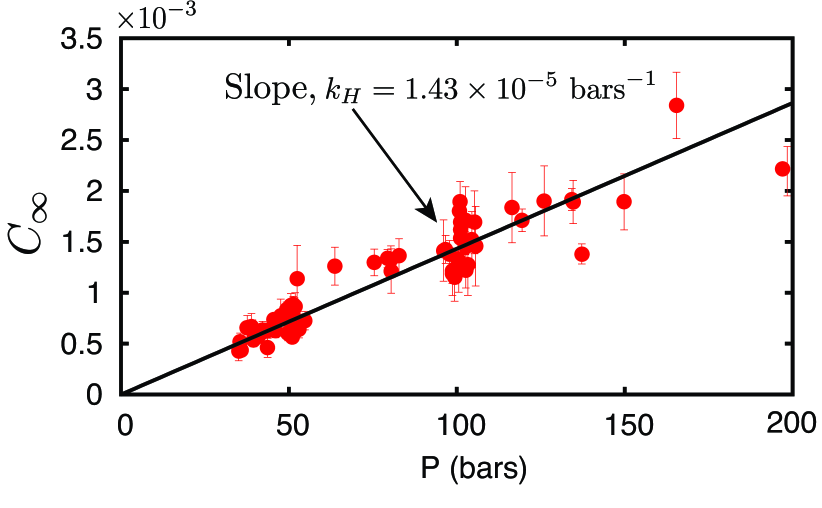
The oversaturation of gas particles in the bulk liquid is given by , which involves the calculation of and . We have defined the concentration in this work as the ratio of gas particles to liquid particles in a certain amount of fixed volume, which is equivalent to the mole fraction of gas particles in the liquid. The oversaturation is controlled by changing the system pressure, since Henry’s law dictates that the solubility of gas in the liquid increases linearly with the system pressure. In our simulations, first a nanobubble is formed on the chemically heterogenous surface by a NVT simulation, and then the pressure coupling is switched on, to keep the solubility of gas particles in the bulk liquid fixed. To change the solubility, and hence the oversaturation level, the system pressure is slowly increased or decreased which respectively leads to the dissolution or growth of the bubble. For dissolution, the system pressure is increased which results in the increase of solubility. Because of the finite system size, an increase in solubility leads to the migration of gas particles from the nanobubble to the bulk liquid, which leads to the dissolution of the nanobubble. In order to determine , we have divided the liquid domain into concentric shells of thickness , concentric around the nanobubble, and then calculated , the ratio of gas to liquid particles in each shell (see Figure 3). is then calculated by averaging over the range of to , where it is almost constant. In Figure 4 we show as a function of the pressure of the gas phase, which at equilibrium is equal to the sum of the bulk pressure and the Laplace pressure. Our data are found to obey Henry’s law, where we estimate Henry constant as . Note that the concentration of gas particles around the nanobubble is assumed to vary with radial distance only. In general, it varies in both radial and azimuthal direction but it is a very weak function of the azimuthal angle when contact angle is around [32]. In our simulations the contact angle is varying between and , so the azimuthal angle dependence of the concentration field can be neglected.
3 Results and Discussion
3.1 Pinning provides stability to surface nanobubbles
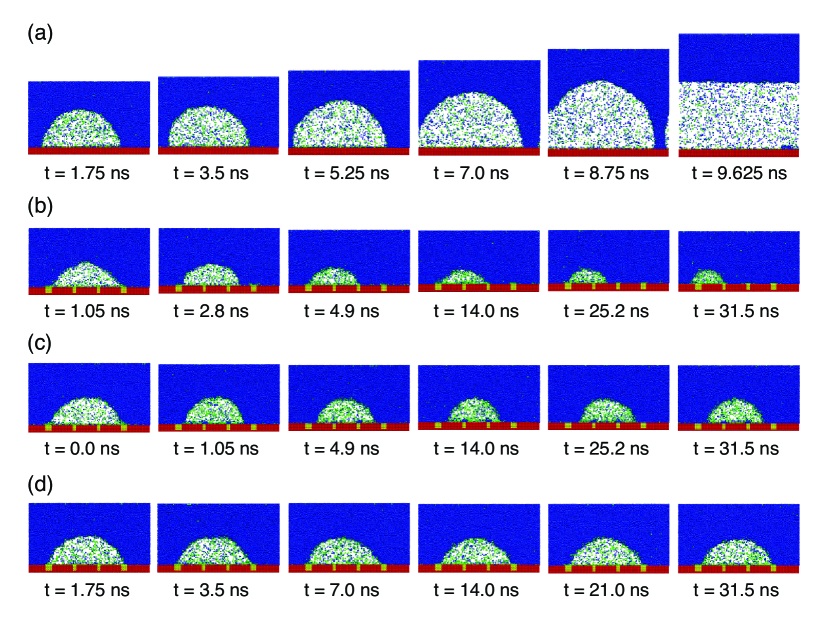
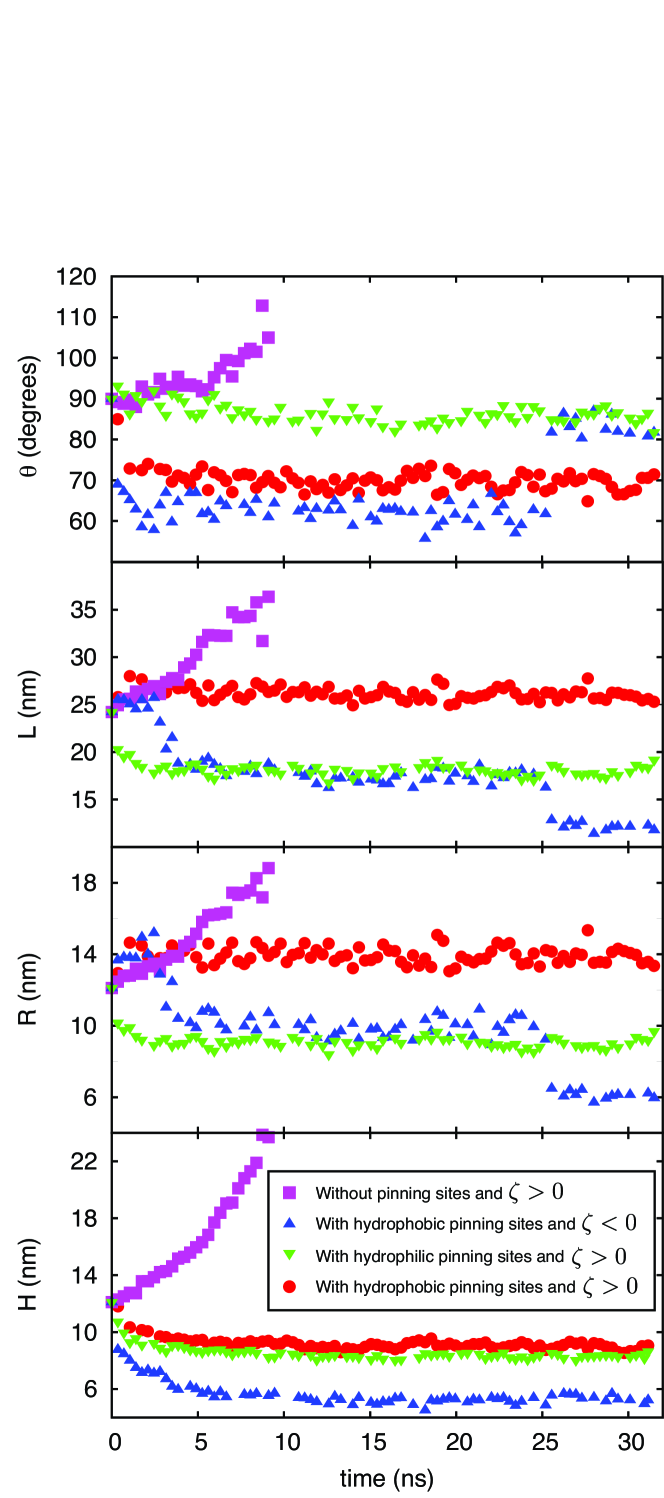
We start with testing the prerequisite conditions for the stability of nanobubbles given by Lohse and Zhang[1]. They theoretically showed that pinning of three-phase contact line by hydrophobic heterogeneities in a gas oversaturated liquid leads to stability of nanobubbles. We now show systematically by performing MD simulations that these pinning conditions are indeed sufficient to get a stable surface nanobubble. To this end we have performed four MD simulations at the same temperature and pressure, the time evolution of which is shown in Figures 5 (snapshots) and 6 (, L , R, and H as function of time). Figure 5 (a) shows the time evolution of a nanobubble on a homogenous solid substrate, i.e. without any pinning sites, at a particular gas oversaturation, . We find that the nanobubble in this simulation grows quickly due to large oversaturation of gas particles in the bulk liquid, so that after the few nanoseconds it comes into contact with its periodic image, and ultimately forms a vapour liquid equilibrium with a planar interface. It clearly shows the importance of heterogeneities on the solid surface without which it is impossible to form a stable nanobubble. This behaviour is also shown in terms of the variation of , L, R and H of the nanobubble with time in Figure 6. It is apparent from the plot that , L, R and H increase rapidly with time and couldn’t form a stable nanobubble.
Figure 5 (b) shows the time evolution of a nanobubble on a chemical heterogeneous surface with hydrophobic pinning sites at a particular gas undersaturation, . One can observe that the nanobubble slowly shrinks and dissolves with time. The nanobubble is not stable because the surrounding liquid is undersaturated with gas particles and it shows the "stick-jump" mechanism during the dissolution, which means that the contact line remains pinned to the hydrophobic pinning sites. This "stick-jump" dissolution mode is evident from Figure 6, especially from the variation of L and R with time. This kind of motion of the contact line in the dissolution of nanobubbles is very similar to the dissolution mode exhibited by microdrops dissolving in an another liquid[33]. This simulation clearly demonstrates the necessity of having gas oversaturation () for the stability of nanobubbles.
Figure 5 (c) shows the time evolution of a nanobubble on a chemical heterogeneous surface with hydrophilic pinning sites at a particular gas oversaturation, . Hydrophilicity is introduced by interchanging the value of and . In this case we have not observed pinning of the three-phase contact line and the nanobubble eventually dissolves, although the dissolution time is quite high. Though it looks like from Figure 6 that a stable nanobubble is formed but in reality it slowly (compared to the undersaturation case) dissolves. Time scale for dissolution of a bubble for unpinned contact line case is given by the classical theory of Epstein and Plesset[34, 1, 35], namely
| (3) |
where is the radius of curvature of the bubble, the gas density, and the diffusion coefficient of gas particles in the liquid, which are extracted from MD simulation of the nanobubble with hydrophilic pinning sites. Accoding to this eq 3, the lifetime of the nanobubble in our case is calculated as . Simulating as long times as is still very challenging for MD simulations; therefore we could not show the whole dissolution dynamics in this case. However, one can infer from this simulation that only hydrophobic pinning sites lead to the pinning of the contact line and hence stable nanobubble.
Figure 5 (d) shows the time evolution of a nanobubble on a chemical heterogeneous surface with hydrophobic pinning sites at a particular gas oversaturation, . In this case, the nanobubble on the solid surface remains stable throughout the simulation as chemical heterogeneities fixate the contact line, and the outflux due to Laplace pressure is balanced by the influx due to the oversaturation of the gas particles in the bulk liquid. From Figure 6, it is clear that in tis case , L, R and H remain constant with time and form a stable equilibrium. These four simulations confirm that hydrophobic chemical heterogeneities and gas oversaturation () are necessary and sufficient conditions for forming a stable nanobubble. Note that also geometrical pinning sites lead to the stability of nanobubbles as already shown by Liu and Zhang[28].
3.2 Stable surface nanobubbles at equilibrium
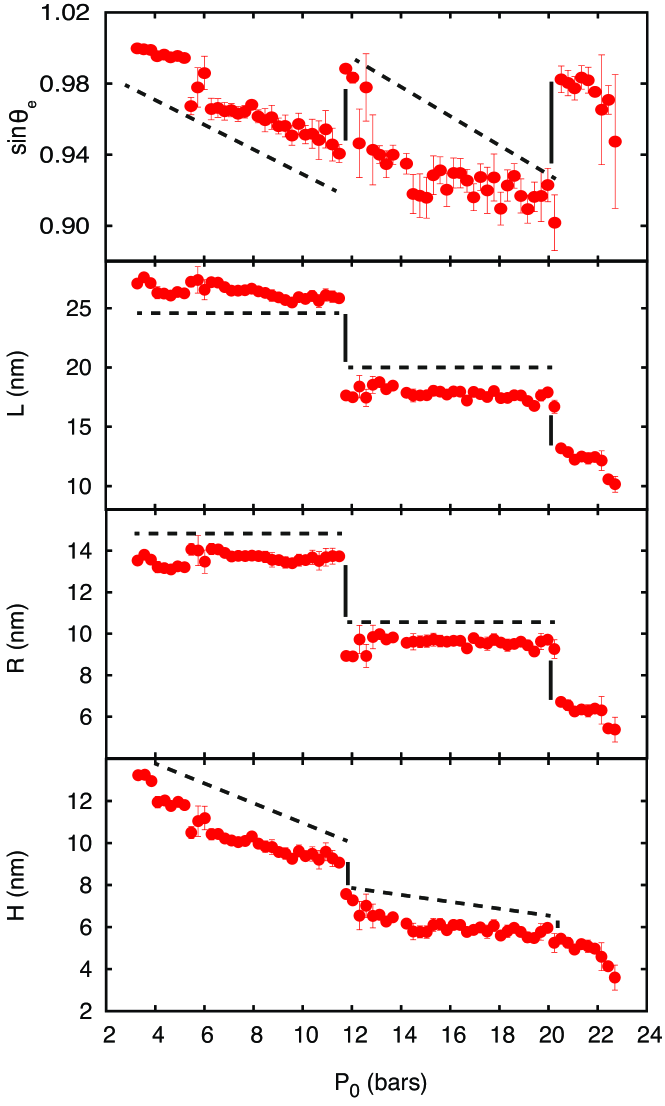
In this section we study the stable configurations of surface nanobubbles at equilibrium at various gas oversaturation levels. The primary aim of this section is to validate the expression for the equilibrium contact angle of a surface nanobubble derived by Lohse and Zhang[1]. In the previous section we have qualitatively shown the necessary conditions for forming a stable nanobubble. Here, we systematically and quantitavely study the stable nanobubble at equilibrium with the help of MD simulations. To this end, a nanobubble is nucleated on a chemical heterogenous surface with the help of local oversaturation at a particular temperature and pressure. After reaching equilibrium, the system pressure is slightly increased which results in an increase of the solubility of gas particles in the bulk liquid. After increasing the pressure, the simulation was run for another 21 ns to ensure equilibrium of the system. As explained before, the increased solubility (and the fixed number of the gas particles in the system) will lead to the dissolution of the surface nanobubble. This mechanism results in a sudden jump of the three phase contact line, at some particular pressure, towards a new pinning site, decreasing the lateral length and suddenly increasing the contact angle of the nanobubble. Figure 7 shows the contact angle , the footprint diameter L, the radius of curvature R of nanobubble, and its height H, as function of the bulk pressure . One can clearly observe the discontinuities in the variation which corresponds to the jump of the three-phase contact line over the pinning sites. The magnitude of change in the footprint diameter at discontinuities is equal to the distance between the pinning sites which confirms the "jump" of the contact line on the pinning sites. We would like to emphasise that for each data point shown in Figure 7, the system is at equilibrium for that particular pressure.
Note that is the bulk liquid pressure which is calculated in a liquid slab away from the interface. Although all the simulations are performed in a NPT ensemble, where the pressure is controlled by semi-isotropic coupling, there is a large difference between the pressure set in GROMACS, and the bulk pressure , on which we elaborate in the appendix.
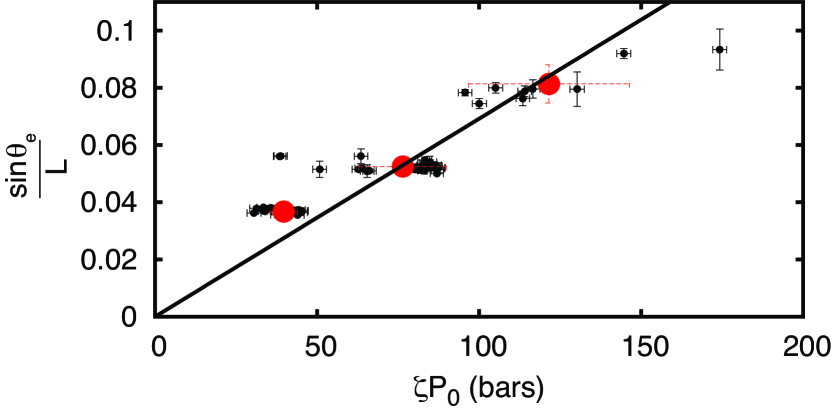
Theoretically, the equilibrium contact angle of a single surface nanobubble is given by eq 1 . Note that here we had to modify the definition of from to , owing to the fact that for cylindrical bubbles the Laplace pressure is equal to , instead of the usual value that holds for spherical bubbles. Since Henry’s law is obeyed in our simulations, we can write and , where is the pressure inside the nanobubble and is the ambient bulk pressure. Note that now is calculated from the actual MD simulations and not evaluated from the expression as given in the appendix. We have plotted against the oversaturation in Figure 8, which shows that the equilibrium contact angle obeys eq 1. Note that there are some data points which are slightly away from the theoretical line, which is mainly due to the large errors in the pressure calculation. Because of the relatively small system size, the instantaneous value for the pressure can deviate significantly from the mean which leads to large error bars[29]. Another reason for this deviation is the assumption of the surface tension being independent of pressure. The pressure inside the bubble directly affects the concentration of gas particles at the interface, which can have an influence on the magnitude of the surface tension. The three points in the Figure 8 corresponds to the three radii of curvature or footprint diameter levels as shown in Figure 7. Each of the three points is the average of all the small data points for a nanobubble pinned on two particular pinning sites, which is also shown in Figure 8.
Note that is plotted against instead of , as we do not a priori know the value of the surface tension . In fact we can use eq 1, to obtain an estimate for the surface tension . since the slope of the straight line in Figure 8 is , which yields a surface tension N/m.
4 Conclusions
Molecular dynamics simulations were performed for single surface nanobubbles on a chemical heterogenous surface and in a gas oversaturated liquid. Heterogeneities act as pinning sites which fix the three-phase contact line and stabilise the equilibrium, in which the gas influx due to the gas oversaturation is balanced by the outflux due to the Laplace pressure. The theoretically predicted conditions[1] for stable single surface nanobubble were tested with MD simulations, finding full confirmation. We have found that only hydrophobic heterogeneities lead to the pinning of the contact line and not the hydrophilic ones. In addition, we have also studied the dissolution of surface nanobubbles on a chemical heterogenous surface in a gas undersaturated liquid. The dissolution of a surface nanobubble shows "stick-jump" behaviour which is very similar to the behaviour shown by the dissolution of microdrops in another liquid[33, 36, 37]. We have also simulated the stable nanobubble at various levels of oversaturation and showed the variation of the contact angle, the footprint diameter, the radius of curvature and the height of the nanobubble with system pressure. The equilibrium contact angle is following the analytical expression calculated in ref. [1], which herewith we thus confirm. The next step will be to simulate interacting surface nanobubbles.
We thank Shantanu Choudhary for assistance with parallelizing some of the codes, Michiel van Limbeek for fruitful discussions and Sander Wildeman, Varghese Mathai, Poorvi Shukla for constructive comments on the manuscript, SURFsara (funded by NWO) for providing the computational facilities for the simulations, and FOM for financial support.
5 Appendix
In this section we describe the calculation of , that we have used in Figures 7. We have performed NPT simulations in which the pressure is prescribed. Yet, there is a clear difference between the input pressure and the actual bulk liquid pressure, that we have used. The pressure in any MD simulation with pair interaction can be calculated from:
| (4) |
As one can notice from the eq 4, that calculation of pressure involves the interaction between all the possible pairs of particles which include the interaction between solid and moving particles also, which is thus included in the pressure that is set for GROMACS. However, due to the finite size of the system, this interaction between fixed solid and moving particles can have a huge effect on the overall pressure. In order to evaluate the "true" bulk pressure , we have excluded this interaction from solid particles, that is, is calculated by considering only the interactions in a rectangular slab above the bubble. In the calculation of , we have also considered the interaction between the pairs of which are intersecting the boundary planes. Relation between the input pressure in GROMACS and is shown in Figure 9.
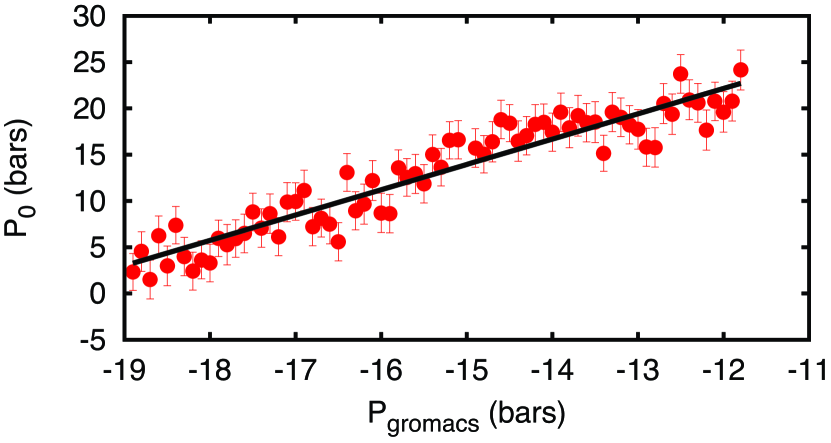
It can be noticed that is directly proportional to the input pressure in GROMACS and a straight line is fitted to get the relation between the two, which is given as . in Figure 7 is calculated from the input pressure using this relation, whereas in Figure 8, is the actual calculated value from the MD simulation. Now the question arises, why we chose to use this relation instead of using directly calculated from the simulations. From Figure 9, it is clear that on an average is increasing linearly with input pressure but there are still some local fluctuations in the pressure which overcasts the jump in , L, R, and H of surface nanobubble shown in Figure 7.
, used in Figure 8 for calculation of , is the pressure inside the nanobubble which is calculated by considering the virial function of all pairs of particles within the bubble and half the virial function of the pairs whose vector is intersecting the bubble boundary.
References
- Lohse and Zhang [2015a] D. Lohse and X. Zhang. Pinning and gas oversaturation imply stable single surface nanobubble. Phys. Rev. E, 91:031003(R), 2015a.
- Lohse and Zhang [2015b] Detlef Lohse and Xuehua Zhang. Surface nanobubble and surface nanodroplets. Rev. Mod. Phys., 87:981–1035, 2015b.
- Fan and Wang [2005] Y.W. Fan and R.Z. Wang. Submicrometer-sized vaterite tubes formed through nanobubble-templated crystal growth. Adv. Mater., 17(19):2384–2388, 2005.
- Hui et al. [2009] F. Hui, B. Li, P. He, J. Hu, and Y. Fang. Electrochemical fabrication of nanoporous polypyrrole film on hopg using nanobubbles as templates. Electrochem. Comm., 11:639–642, 2009.
- Darwich et al. [2011] S. Darwich, K. Mougin, L. Vidal, E. Gnecco, and H. Haidara. Nanobubble and nanodroplet template growth of particle nanorings versus nanoholes in drying nanofluids and polymer films. Nanoscale, 3(3):1211–1217, 2011.
- Paxton et al. [2004] WF Paxton, KC Kistler, CC Olmeda, A Sen, SK St Angelo, YY Cao, TE Mallouk, PE Lammert, and VH Crespi. Catalytic nanomotors: Autonomous movement of striped nanorods. J. Am. Chem. Soc., 126(41):13424–13431, 2004.
- Wilson et al. [2012] Daniela A Wilson, Roeland J M Nolte, and Jan C M van Hest. Autonomous movement of platinum-loaded stomatocytes. Nat. Chem., 4(4):268–274, 2012.
- Fang et al. [2013] Z. Fang, Y. R. Zhen, O. Neumann, A. Polman, F. J. Garcia de Abajo, P. Nordlander, and N. J. Halas. Evolution of light-induced vapor generation at a liquid-immersed metallic nanoparticle. Nano Lett., 13:1736–1742, 2013.
- Belova et al. [2011] Valentina Belova, Dmitry G. Shchukin, Dmitry A. Gorin, Alexey Kopyshev, and Helmuth Moehwald. A new approach to nucleation of cavitation bubbles at chemically modified surfaces. Phys. Chem. Chem. Phys., 13(17):8015–8023, 2011.
- Belova et al. [2013] Valentina Belova, Marta Krasowska, Dayang Wang, John Ralston, Dmitry G. Shchukin, and Helmuth Moehwald. Influence of adsorbed gas at liquid/solid interfaces on heterogeneous cavitation. Chem. Sci., 4(1):248–256, 2013.
- Zhang et al. [2014] Xuehua Zhang, Henri Lhuissier, Chao Sun, and Detlef Lohse. Surface nanobubbles nucleate microplets. Phys. Rev. Lett., 112:144503, 2014.
- Hampton and Nguyen [2009] Marc A. Hampton and Anh V. Nguyen. Accumulation of dissolved gases at hydrophobic surfaces in water and sodium chloride solutions: Implications for coal flotation. Minerals Engineering, 22(9-10):786 – 792, 2009.
- Hampton and Nguyen [2010] M. A. Hampton and A. V. Nguyen. Nanobubbles and the nanobubble bridging capillary force. Adv. Coll. Int. Sci., 154:30–55, 2010.
- Parker et al. [1994] J. L. Parker, P. M. Claesson, and P. Attard. Bubbles, cavities and the long-ranged attraction between hydrophobic surfaces. J. Phys. Chem., 98(34):8468–8480, 1994.
- Stevens et al. [2005] H. Stevens, R. F. Considine, C. J. Drummond, R. A. Hayes, and P. Attard. Effects of degassing on the long-range attractive force between hydrophobic surfaces in water. Langmuir, 21:6399–6405, 2005.
- Lou et al. [2000] S.-T. Lou, Z.-Q. Ouyang, Y. Zhang, X.-J. Li, J. Hu, M.-Q. Li, and F.-J. Yang. Nanobubbles on solid surface imaged by atomic force microscopy. J. Vac. Sci. Technol. B, 18:2573–2575, 2000.
- Zhang et al. [2007] X. H. Zhang, A. Khan, and W. A. Ducker. A nanoscale gas state. Phys. Rev. Lett., 98:136101, 2007.
- Zhang et al. [2013] Lijuan Zhang, Binyu Zhao, Lian Xue, Zhi Guo, Yaming Dong, Haiping Fang, Renzhong Tai, and Jun Hu. Imaging interfacial micro- and nano-bubbles by scanning transmission soft x-ray microscopy. J. Synchrotron Rad., 20(3):413–418, 2013.
- Zhang et al. [2013] Xuehua Zhang, Derek Y. C. Chan, Dayang Wang, and Nobuo Maeda. Stability of Interfacial Nanobubbles. Langmuir, 29(4):1017–1023, 2013.
- German et al. [2014] Sean R. German, Xi Wu, Hongjie An, Vincent S. J. Craig, Tony L. Mega, and Xuehua Zhang. Interfacial nanobubbles are leaky: Permeability of the gas/water interface. ACS Nano, 8:6193–6201, 2014.
- Ducker [2009] W. A. Ducker. Contact angle and stability of interfacial nanobubbles. Langmuir, 25:8907–8910, 2009.
- Brenner and Lohse [2008] M. P. Brenner and D. Lohse. Dynamic equilibrium mechanism for surface nanobubble stabilization. Phys. Rev. Lett., 101:214505, 2008.
- Weijs and Lohse [2013] Joost H. Weijs and Detlef Lohse. Why Surface Nanobubbles Live for Hours. Phys. Rev. Lett., 110:054501, 2013.
- Petsev et al. [2013] N. D. Petsev, M. S. Shell, and L. G. Leal. Dynamic equilibrium explanation for nanobubbles’ unusual temperature and saturation dependence. Phys. Rev. E, 88:010402(R), 2013.
- Weijs et al. [2012] J. H. Weijs, J. H. Snoeijer, and D. Lohse. Surface nanobubbles: formation and universality of the contact angle. Phys. Rev. Lett., 108:104501, 2012.
- Yasui et al. [2015] Kyuichi Yasui, Toru Tuziuti, Wataru Kanematsu, and Kazumi Kato. Advanced dynamic-equilibrium model for a nanobubble and a micropancake on a hydrophobic or hydrophilic surface. Phys. Rev. E, 91(3):033008, 2015.
- Liu and Zhang [2013] Y. Liu and Xianren Zhang. Nanobubble stability induced by contact line pinning. J. Chem. Phys., 138:014706, 2013.
- Liu and Zhang [2014] Y. Liu and Xianren Zhang. A unified mechanism for the stability of surface nanobubbles: Contact line pinning and supersaturation. J. Chem. Phys., 141:134702, 2014.
- Hess et al. [2008] Berk Hess, Carsten Kutzner, David van der Spoel, and Erik Lindahl. Gromacs 4: Algorithms for highly efficient, load-balanced, and scalable molecular simulation. J. Chem. Theory Comput., 4:435–447, 2008.
- Frenkel and Smit [2002] Daan Frenkel and Berend Smit. Understanding Molecular Simulation. Academic Press, London, 2002.
- Dammer and Lohse [2006] S. M. Dammer and D. Lohse. Gas enrichment at liquid-wall interfaces. Phys. Rev. Lett., 96:206101, 2006.
- Popov [2005] Y. O. Popov. Evaporative deposition patterns: Spatial dimensions of the deposit. Phys. Rev. E, 71:036313, 2005.
- Dietrich et al. [2015] E. Dietrich, E. S. Kooij, Xuehua Zhang, H. J. W. Zandvliet, and D. Lohse. Stick-jump mode in surface droplet dissolution. Langmuir, 31:4696–4703, 2015. doi: 10.1021/acs.langmuir.5b00653.
- Epstein and Plesset [1950] P. S. Epstein and M. S. Plesset. On the stability of gas bubbles in liquid-gas solutions. J. Chem. Phys., 18:1505–1509, 1950.
- Ljunggren and Eriksson [1997] S. Ljunggren and J. C. Eriksson. The lifetime of a colloid- sized gas bubble in water and the cause of the hydrophobic attraction. Colloids Surf., A, 151:129–130, 1997.
- Dietrich et al. [2016] Erik Dietrich, Sander Wildeman, Claas Willem Visser, Kevin Hofhuis, E. Stefan Kooij, Harold J. W. Zandvliet, and Detlef Lohse. Role of natural convection in the dissolution of sessile droplets. J. Fluid Mech., In Press, 2016.
- Liu and Zhang [2013] Yawei Liu and Xianren Zhang. Evaporation dynamics of nanodroplets and their anomalous stability on rough substrates. Phys. Rev. E, 88:012404, 2013.