Decoupling of translational and rotational diffusion in quasi-2D colloidal fluids
Abstract
We observe the translational and rotational diffusion of dimer tracer particles in quasi-2D colloidal samples. The dimers are in dense samples of two different sizes of spherical colloidal particles, with the area fraction of the particles varying from dilute to nearly glassy. At low rotational and translational diffusion have a ratio set by the dimer size, as expected. At higher dimers become caged by their neighboring particles, and both rotational and translational diffusion slow. For short dimers we observe rapid reorientations so that the rotational diffusion is faster than translational diffusion: the two modes of diffusion are decoupled and have different dependence. Longer dimers do not exhibit fast rotations, and we find their translational and rotational diffusion stay coupled for all . Our results bridge prior results that used spheres (very fast rotation) and long ellipsoids (very slow rotation).
I Introduction
A comprehensive explanation for the dramatic increase in viscosity on approaching the glass transition is still lacking, although there are a variety of theories.Biroli and Garrahan (2013); Ediger and Harrowell (2012a); Cavagna (2009) What makes the matter more complicated is the inadequacy of the traditional concept of viscosity and its relation with microscopic diffusion in supercooled liquids. In liquids, the Stokes-Einstein-Sutherland equationEinstein (1905); Sutherland (1905) relates microscopic translational diffusion () as inversely proportional to solvent viscosity . Rotational diffusion () is also inversely proportional to , known as the Stokes-Einstein-Debye relation. Further, the ratio of translational to rotational diffusion constants () should be independent of viscosity and temperature. However, many experiments and simulationsFujara et al. (1992); Chang et al. (1994); Berthier, Chandler, and Garrahan (2004); Kumar, Szamel, and Douglas (2006) have shown a violation of the Stokes-Einstein and Stokes-Einstein-Debye relations in supercooled liquids. These violations can manifest as and/or no longer being inversely related to , and also no longer being a constant.
Pioneering experiments in the early 1990’s observed a violation of these relations on approaching the glass transition in orthoterphenyl.Fujara et al. (1992); Chang et al. (1994) Rotation and translational diffusion constants were measured indirectly through spin-relaxations. They observed an enhancement of translation relative to rotation approaching the glass transition. At the time, this strange difference was attributed to spatial distribution of relaxation timescales , and measured rotation and translation measurements being sensitive to different moments of this distribution.Ediger (2000) But it was thought that on the single molecule scale, translation and rotation remain coupled.
However, recent simulations and colloidal experiments have found that decoupling occurs even at the single particle level.Chong et al. (2005); Chong and Kob (2009); Kim et al. (2011); Edmond et al. (2012) The current hypothesis is that decoupling occurs due to translation and rotation degrees encountering different dynamic length scales.Ediger and Harrowell (2012b) Moreover, some studies found that translation was enhanced relative to rotation,Zheng, Wang, and Han (2011); Edmond et al. (2012); Zheng et al. (2014) whereas others found rotation was enhanced relative to translation.Chong et al. (2005); Chong and Kob (2009); Kim et al. (2011) These different experiments had different probe shapes and conditions so direct comparison of the observations is challenging.
In this study we examine how the probe details influence translational-rotational decoupling in colloidal samples. Colloidal samples at high concentration have been established as model glass formers,Pusey and van Megen (1986); Weeks (2017) and have the advantage that individual particles can be visualized. Here we use naturally occurring anisotropic silica dimers of different aspect ratio as tracers, and find that the dimer length determines translation-rotation decoupling.
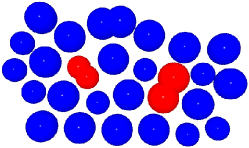
These dimers are at a very low concentration, less than 5 percent and the experiments are the same as previously published (where we studied only the monomer particlesVivek et al. (2017)). We find that for dimers of smaller lengths, rotations do not slow down as much as translations, on approaching the glass transition, similar to the case of spheres as probes.Kim et al. (2011) However we find that in our longest dimers, and remain coupled at all concentrations, i.e. constant. Figure 1 shows an example computer rendering of a long dimer and short dimer in one of our samples. Our key result is that the shorter dimer can rotate more easily as it is easier to relax the steric hindrance of the neighboring particles.
II Materials and methods
II.1 Experimental methods
For this work we reanalyze movies corresponding to previously published data.Vivek et al. (2017) In the experiments we use gravity to confine bidisperse non-functionalized silica particles to a monolayer (diameters and m, Bangs Laboratories, SS05N). The number ratio is , and varies from sample to sample. The control parameter is the area fraction , with glassy samples found for ; the data we present here are all with . The particles are sedimented to the microscope coverslip of our sample chamber prior to observation. The coverslip is made hydrophobic by treatment with Alfa Aesar Glassclad 18 to prevent particle adhesion, and indeed we do not observe any particles stuck to the glass. We do not add salt. We verify that in all experiments, only one layer of particles is present (ensured by keeping the overall particle concentration below the level that requires a second layer to form). We use brightfield microscopy and a CCD camera to record movies of particles diffusing.
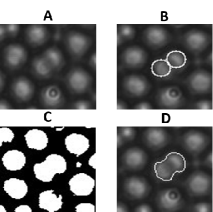
The samples have naturally occurring dimers at dilute concentrations from %. The dimers are stable during our observations. All dimers are made of identical particles (either two small particles or two large particles), indicating they are formed prior to the experiment; they seem to be present in the samples as received. Rather than being two spheres barely touching, they are somewhat fused together, as can be seen in Fig. 2. The aspect ratio (length/width) is always less than two, and varies from dimer to dimer.
II.2 Imaging and tracking dimers
We need to follow the translational and rotational motion of the dimers. We start by using standard particle tracking softwareCrocker and Grier (1996) to track the two particles of a dimer, as shown in Fig. 2. Next we select the region of the image (ROI) that included dimers. Based on brightness, we threshold this ROI to get a black and white image (Fig. 2). We identify connected regions in this thresholded image, and selected the largest such region as the dimer of interest. The length of the longest axis of this connected region is measured as , and then we identify the length of the short axis as the longest distance across the connected region perpendicular to the long axis. The aspect ratio then is .
Recent work has shown that two-dimensional glass-forming systems need to be analyzed slightly differently than 3D systems.Vivek et al. (2017); Shiba et al. (2016); Illing et al. (2017) The key concern is that 2D systems are subject to Mermin-Wagner fluctuations which move particles locally but do not lead to structural rearrangements.Peierls (1934); Landau (1937); Mermin and Wagner (1966); Mermin (1968); Klix, Maret, and Keim (2015); Illing et al. (2017) Particles are “caged” by their neighbors, but Mermin-Wagner fluctuations result in coherent motion of the cage. Analyzing the motion of particles relative to their caging neighbors removes the influence of these fluctuations, making apparent the motions that lead to structural relaxation.Mazoyer et al. (2009)
Accordingly, to determine the relaxation time scale for our samples, we define the cage relative translational correlation function as: where where denotes the nearest neighbors of the particle at the initial time , and the sum is over all neighbors. The relaxation timescale is the timescale when reaches , and defines the time scale over which the sample has significant structural rearrangements.Vivek et al. (2017)
The cage relative mean square displacement (MSD) is defined using the same displacements . We measure the long time translational diffusion coefficient from the cage relative MSD. For our tracers, we do not see a significant difference between the MSD and the cage-relative MSD in the observed area fraction range. However, softer samples are known to have larger differences.Vivek et al. (2017); Illing et al. (2017) We are interested in the behavior, so distinctions between motion along the dimer axis and perpendicular to that axis will not be important to us.Han et al. (2006) Rotational mean square displacements (MSDR) do not require cage-relative analysis. For the MSDR we identify the instantaneous angle of a dimer (in radians); unwrap this angle so that it can take values smaller than 0 or larger than ; and then compute the MSDR from this unwrapped angle.
II.3 Hydrodynamic theory
The dimers we analyze have an aspect ratio , whereas perfect dumbbells have aspect ratio 2. Nonetheless, a reasonable starting approximation is to model our dimers as dumbbells. For dumbbells in a liquid the ratio of translational to rotational diffusion coefficients is given asCugliandolo, Gonnella, and Suma (2015)
| (1) |
where is the diameter of particles in the dumbbell. This predicts a ratio of 1.60 m2 for a dimer composed of two small particles in our experiment and 2.86 m2 for a dimer composed of two large particles.
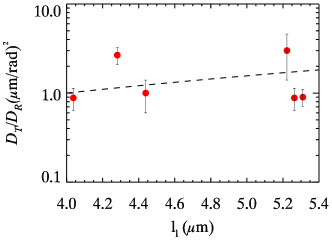
Figure 3 shows as a function of dimer length in a medium-concentration sample. The data are scattered with no systematic dependence on . The dashed line shows Eqn. 1 and the data are within a factor of two of this prediction. This is reasonable, as (1) our dimers are not the perfect dumbbell shape as assumed by theory, and (2) Eqn. 1 does not take into account the hydrodynamic influence of the bottom wall,Sarmiento-Gómez et al. (2016) which affects translational and rotational modes differently.Han et al. (2006); Bhattacharya, Blawzdziewicz, and Wajnryb (2005) It is also possible that the different values of for dimers ostensibly made from identical particles give rise to dimers of different shapes (different amounts of overlap of the two particles) which could account for the scatter in our data. In sum, we recognize an inherent uncertainty for the ratio of of about a factor of 2, and will look for this ratio to vary by more than a factor of two as we approach the glass transition.
III Results
Figure 4 shows translational and rotational MSDs in medium concentration (,) and high concentration (,) samples corresponding to different length dimers. For the medium concentration samples () all MSDs rise diffusively, MSD , as can be seen by comparing the data to the straight black line which has slope = 1. The long dimer diffuses a bit slower, as seen by the blue diamonds lying below the red circles in (,). Interestingly at large concentration (), we see that the translational MSD is similar for the short and long dimers (Fig. 4), while the rotational MSD is much different (Fig. 4). Comparing Fig. 4 and , we see that both long and short dimers show a similar slow down in translation. However, Fig. 4 and are very different. Here, long dimers (blue diamonds in this graph) show a much larger slowdown in rotation as compared with short dimers (red circles) at high concentration.
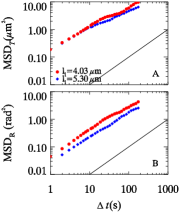
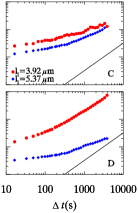
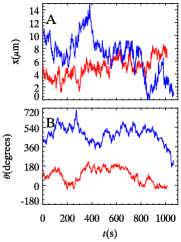
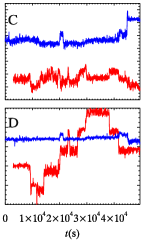
Figure 5 shows the trajectories of the dimers corresponding to Fig. 4. For the medium concentration sample (), long and short dimers have similar trajectories. In contrast, the concentrated sample () shows that the long dimer (blue) spends more time localized (perhaps with a reversible cage rearrangement event in the middleVollmayr-Lee (2004) and an irreversible jump at the end). The shorter dimer (red) moves more frequently.
Additionally, we track the angular motion of each dimer, shown in Fig. 5 and . This is easy to measure as we can track both particles in the dimer, and hence compute the instantaneous angle . We keep track of the number of rotations so that is unbounded. In the medium concentration sample, shown in Fig. 5, long and short dimers have similar angular displacements. However in the concentrated sample shown in Fig. 5, clearly the short dimer (red) shows much larger angular displacements than the long dimer (blue). Thus the small dimer is able to rotate much easier than the long dimer. In particular, it often rotates by , suggesting that the cage of neighboring particles expands slightly, the dimer has a chance to rotate, and then the cage contracts locking the dimer into the original orientation or else rotated.
The short dimer shows jumps in angle at certain times. Figure 6 shows this dimer at three consecutive time points , , and during which a large jump takes place. The time between each is the recording rate of 16.5 seconds per image (used for the concentrated sample). shows this characteristic jump zoomed in. Clearly, the dimer rotates fairly quickly. While it is possible we miss rotations that are more than between video frames, we believe this is unlikely. We examine the probability distributions of angular jumps between video frames, , and find that the probability of large jumps is nearly zero for . This suggests that larger jumps with are even rarer.

To compare all our data we fit the large behavior of all MSD curves to measure diffusion constants. The translation diffusion coefficient is measured as (using cage-relative displacements). The average is over all particles and all initial times. The rotational diffusion coefficients are measured similarly, through , where is angular displacement in . Figure 7 plots as a function of (defined in Sec. II) for all samples. Here we see that all dimers follow the black line, which is the measured bulk of the spherical particles in the sample. A fit to the bulk data (not shown) finds , which is in the range of exponents observed in other experiments.Mazza et al. (2007); Chong and Kob (2009)
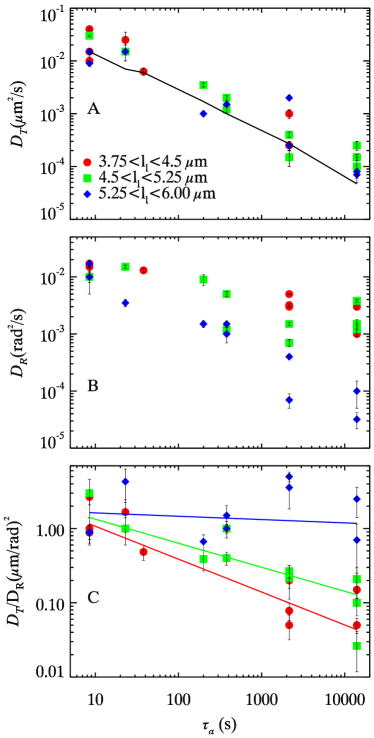
Rotational diffusion also slows for glassy samples as shown by the data for in Fig. 7. In contrast with , these data become more scattered for the samples closer to the glass transition (larger ). It is apparent that the slowest rotational diffusion is seen for the longest dimers (blue diamonds) which slow by as grows by . In contrast, the shortest dimers (red circles) decrease by only over the same range. The difference between of the long and short dimers is more than an order of magnitude at the largest . The mild decrease in for the short dimers is similar to that seen with spherical colloids in a prior experiment.Kim et al. (2011) Overall, this is what we expect based on the conceptual sketch of Fig. 1: long dimers require their neighbors to move out of the way to facilitate their rotation, whereas short dimers are constrained less by their neighbors. Likewise this is supported by Fig. 5 where the short dimer makes large jumps in angle.
We examine decoupling of rotational and translational diffusion by plotting in Fig. 7. The long dimers (blue diamonds) show a constant independent of ; here the two diffusion constants are coupled at all area fractions. In contrast, the short dimers (red circles) show a decrease in with increasing . The colored lines show power-law fits for the three different dimer length regimes. Some of the observed spread in data could be due to dynamical heterogeneity. Closer to the glass transition, dynamical heterogeneity causes differences in diffusivities across the sample.Weeks et al. (2000) This could cause different particles of similar shape to differ in depending on their local environment. However, at the largest , the difference between of the long and short dimers is more than an order of magnitude. We see decoupling: while both rotational and translational diffusion slow as the glass transition is approached, rotational diffusion slows less dramatically – at least for the short dimers.
Organizing the data based on dimer length shows a clear trend from long dimers (no decoupling) to short dimers (decoupling); another possible variable is the aspect ratio. Figure 8 shows plotted as a function of , equivalent to Fig. 7, but here different colors denote aspect ratio instead of dimer length. There is no clear trend with aspect ratio, in strong contrast to Fig. 7. Hence the longest axis seems to be the relevant parameter, rather than aspect ratio. A final way to think about the data is motivated by Fig. 5 showing that the short dimers can rotate by ; this is presumably because their cage of neighboring particles expands slightly, allow the rotation. The expansion distance can be estimated as , arguing that the neighbors start away from the middle of the dimer and expand to to allow the long axis to rotate past them. This suggests that the dependence [Fig. 7] could be a dependence on . This seems plausible; Fig. 8 shows the data with color indicating different ranges of , which reasonably well separates the faster rotating dimers (red dimers, small ) from the slower rotating dimers (green squares, large ). The fact that works slightly better [Fig. 7] may be because the number of neighbors that need to move scales as , independent of . Note that the slight cage expansion allowing the rotation is likely unrelated to dynamical heterogeneity. While the cage expansions are uncommon events, the fluctuations in cage size occur on a short time scale which is not directly related to long-time-scale rearrangement motions.Weeks et al. (2000)

Previous simulations found that quantifying translation-rotation decoupling depends on the analysis method.Chong and Kob (2009); Lombardo, Debenedetti, and Stillinger (2006) The “Debye method” uses dot products of the initial and final orientation of a tracer; using this method to measure changed the nature of decoupling.Chong and Kob (2009); Lombardo, Debenedetti, and Stillinger (2006) We also measured from this formalism, in the same way as by Edmond et al.Edmond et al. (2012) We find that both methods to measure give the same result within error, as also found by Edmond et al.
Our results indicate that the longest dimension controls how the particle rotation is sterically constrained by the neighbors on approaching the glass transition. Figure 1 suggests this may be because the longest dimension determines how many neighboring particles can restrict rotational motion. Of course, all of our results are for a particular colloidal sample with particles having a size ratio . It is possible that the results would differ in other samples. With a larger size ratio, cages surrounding dimer tracers would vary strongly in composition which might change the frequency of the fluctuations that allow rotations such as Fig. 6.Kurita and Weeks (2010)
IV Discussion
Prior groups have studied glass transitions in colloidal glasses composed of anisotropic particles.Zheng, Wang, and Han (2011); Zheng et al. (2014); Kim et al. (2011) Kim et al.Kim et al. (2011) studied rotation and translation of optically anisotropic spheres (aspect ratio 1). Here, in the concentrated regime was almost 2 orders of magnitude smaller than the dilute limit.Kim et al. (2011) As spheres rotate without any steric hindrance from neighboring spheres, in this experiment, translation slows down more than rotation approaching the glass transition.Weeks (2017); Kim et al. (2011) More precisely, translation slow down dramatically, but rotation only slows slightly.
Other experiments by Zheng et al. looked at ellipsoids of aspect ratios varying from 2.3 to 6.Zheng, Wang, and Han (2011); Zheng et al. (2014) For the small aspect ratio of 2.3, did not change approaching the glass transition, similar to what we see with our long dimers. For the large aspect ratio 6, however, was an order of magnitude higher than the dilute limit, indicating that rotation slows down more than translation. This study concluded that the decoupling with enhanced translational motion occurs for situations with aspect ratio .Zheng et al. (2014) A similar observation of enhanced diffusion was seen by Edmond et al. who studied tetrahedral cluster tracers in a 3D sample of spherical particles.Edmond et al. (2012) There, the ratio between the longest dimension of the cluster to the mean particle size was 2.9. While a direct comparison between 2D ellipsoids and 3D tetrahedra seems dubious, nonetheless the observations of Edmond et al.Edmond et al. (2012) is in conceptual agreement with the observation of Zheng et al.Zheng et al. (2014)
Our dimer experiments bridge the gap between aspect ratio . We see that close to the glass transition, small changes in dimer length cause significant changes in rotational diffusion. Smaller dimers show a weaker slowdown in rotation on approaching the glass transition. This is because smaller dimers rotate more freely even in a dense sample. Figure 5 shows that this easier rotation is likely due to slight motions of neighboring particles which momentarily allow a rotation of for the short dimers. The results of Kim et al.Kim et al. (2011) with spheres are the logical limit of our results, where a particle can rotate freely with only hydrodynamic interactions with neighbors, but no steric hindrance to rotation. Summarizing all of the experimental observations from short to long particle shape: there are spheres that rotate easily,Kim et al. (2011) short dimers that can make rapid jumps (Fig. 6), longer dimers with coupled translational and rotational diffusion (blue diamonds of Fig. 7),Zheng, Wang, and Han (2011); Zheng et al. (2014), and still longer particles for which rotations are strongly inhibited and slower than translational motion.Edmond et al. (2012); Zheng, Wang, and Han (2011); Zheng et al. (2014) Increasing the particle length relative to the cage size changes from decoupled fast rotation to coupled translation/rotation to decoupled slow rotation. Of course, length is only one aspect of particle anisotropy;Glotzer and Solomon (2007) our results suggest that steric hindrance from the cage surrounding a tracer is a useful idea which may inform coupling or decoupling of more complex particles.
In our experiments, translational diffusion is not affected as much by the dimer length. This is in marked contrast to previous experiments in polymer glasses, where translational diffusion was found to be affected by tracer shape, and not rotational diffusion;Hall et al. (1998) in polymer experiments, translational diffusion slowed down more than rotational diffusion as the glass transition was approached. These results are different from what we see, but more like the long ellipsoid experiments.Zheng, Wang, and Han (2011); Zheng et al. (2014)
In summary, our results bridge the prior colloidal observations, and collectively these observations show that steric interactions affecting rotational diffusion depend in an important way on the longest dimension of the tracer particles. This highlights the importance of steric interactions for understanding decoupling of translational and rotational diffusion near the glass transition.
We thank J. C. Crocker for helpful discussions. This work was supported by the National Science Foundation (CMMI-1250235 for S.V. and DMR-1609763 for E.R.W.).
References
- Biroli and Garrahan (2013) G. Biroli and J. P. Garrahan, “Perspective: The glass transition,” J. Chem. Phys. 138, 12A301 (2013).
- Ediger and Harrowell (2012a) M. D. Ediger and P. Harrowell, “Perspective: Supercooled liquids and glasses,” J. Chem. Phys. 137, 080901 (2012a).
- Cavagna (2009) A. Cavagna, “Supercooled liquids for pedestrians,” Phys. Rep. 476, 51–124 (2009).
- Einstein (1905) A. Einstein, “Über die von der molekularkinetischen Theorie der Wärme geforderte Bewegung von in ruhenden Flüssigkeiten suspendierten Teilchen,” Ann. Phys. 322, 549–560 (1905).
- Sutherland (1905) W. Sutherland, “A dynamical theory of diffusion for non-electrolytes and the molecular mass of albumin,” Phil. Mag. Series 6 9, 781–785 (1905).
- Fujara et al. (1992) F. Fujara, B. Geil, H. Sillescu, and G. Fleischer, “Translational and rotational diffusion in supercooled orthoterphenyl close to the glass transition,” Z. für Physik B Cond. Matt. 88, 195–204 (1992).
- Chang et al. (1994) I. Chang, F. Fujara, B. Geil, G. Heuberger, T. Mangel, and H. Sillescu, “Translational and rotational molecular motion in supercooled liquids studied by NMR and forced Rayleigh scattering,” J. Non-Crystalline Solids 172, 248–255 (1994).
- Berthier, Chandler, and Garrahan (2004) L. Berthier, D. Chandler, and J. P. Garrahan, “Length scale for the onset of Fickian diffusion in supercooled liquids,” Europhys. Lett. 69, 320 (2004).
- Kumar, Szamel, and Douglas (2006) S. K. Kumar, G. Szamel, and J. F. Douglas, “Nature of the breakdown in the Stokes-Einstein relationship in a hard sphere fluid,” J. Chem. Phys. 124, 214501 (2006).
- Ediger (2000) M. D. Ediger, “Spatially heterogeneous dynamics in supercooled liquids,” Ann. Rev. Phys. Chem. 51, 99–128 (2000).
- Chong et al. (2005) S.-H. Chong, A. J. Moreno, F. Sciortino, and W. Kob, “Evidence for the weak steric hindrance scenario in the supercooled-state reorientational dynamics,” Phys. Rev. Lett. 94, 215701 (2005).
- Chong and Kob (2009) S.-H. Chong and W. Kob, “Coupling and decoupling between translational and rotational dynamics in a supercooled molecular liquid,” Phys. Rev. Lett. 102, 025702 (2009).
- Kim et al. (2011) M. Kim, S. M. Anthony, S. C. Bae, and S. Granick, “Colloidal rotation near the colloidal glass transition,” J. Chem. Phys. 135, 054905 (2011).
- Edmond et al. (2012) K. V. Edmond, M. T. Elsesser, G. L. Hunter, D. J. Pine, and E. R. Weeks, “Decoupling of rotational and translational diffusion in supercooled colloidal fluids,” Proc. Nat. Acad. Sci. 109, 17891–17896 (2012).
- Ediger and Harrowell (2012b) M. Ediger and P. Harrowell, “Perspective: Supercooled liquids and glasses,” J. Chem. Phys. 137, 080901 (2012b).
- Zheng, Wang, and Han (2011) Z. Zheng, F. Wang, and Y. Han, “Glass transitions in quasi-two-dimensional suspensions of colloidal ellipsoids,” Phys. Rev. Lett. 107, 065702 (2011).
- Zheng et al. (2014) Z. Zheng, R. Ni, F. Wang, M. Dijkstra, Y. Wang, and Y. Han, “Structural signatures of dynamic heterogeneities in monolayers of colloidal ellipsoids,” Nature Commun. 5, 3829 (2014).
- Pusey and van Megen (1986) P. N. Pusey and W. van Megen, “Phase behaviour of concentrated suspensions of nearly hard colloidal spheres,” Nature 320, 340–342 (1986).
- Weeks (2017) E. R. Weeks, “Introduction to the colloidal glass transition,” ACS Macro Lett. 6, 27–34 (2017).
- Vivek et al. (2017) S. Vivek, C. P. Kelleher, P. M. Chaikin, and E. R. Weeks, “Long-wavelength fluctuations and the glass transition in two dimensions and three dimensions,” Proc. Nat. Acad. Sci. 114, 1850–1855 (2017).
- Crocker and Grier (1996) J. C. Crocker and D. G. Grier, “Methods of digital video microscopy for colloidal studies,” J. Colloid Interface Sci. 179, 298–310 (1996).
- Shiba et al. (2016) H. Shiba, Y. Yamada, T. Kawasaki, and K. Kim, “Unveiling dimensionality dependence of glassy dynamics: 2D infinite fluctuation eclipses inherent structural relaxation,” Phys. Rev. Lett. 117, 245701 (2016).
- Illing et al. (2017) B. Illing, S. Fritschi, H. Kaiser, C. L. Klix, G. Maret, and P. Keim, “Mermin–Wagner fluctuations in 2D amorphous solids,” Proc. Nat. Acad. Sci. 114, 1856–1861 (2017).
- Peierls (1934) R. Peierls, “Bemerkungen über umwandlungstemperaturen,” Helvetica Physica Acta 7, 81–83 (1934).
- Landau (1937) L. D. Landau, “Zur theorie der phasenumwandlungen II,” Phys. Zurn. Sowjetunion 11 (1937).
- Mermin and Wagner (1966) N. D. Mermin and H. Wagner, “Absence of ferromagnetism or antiferromagnetism in one- or two-dimensional isotropic Heisenberg models,” Phys. Rev. Lett. 17, 1133–1136 (1966).
- Mermin (1968) N. D. Mermin, “Crystalline order in two dimensions,” Phys. Rev. 176, 250–254 (1968).
- Klix, Maret, and Keim (2015) C. L. Klix, G. Maret, and P. Keim, “Discontinuous shear modulus determines the glass transition temperature,” Phys. Rev. X 5, 041033 (2015).
- Mazoyer et al. (2009) S. Mazoyer, F. Ebert, G. Maret, and P. Keim, “Dynamics of particles and cages in an experimental 2d glass former,” Europhys. Lett. 88, 66004 (2009).
- Han et al. (2006) Y. Han, A. M. Alsayed, M. Nobili, J. Zhang, T. C. Lubensky, and A. G. Yodh, “Brownian motion of an ellipsoid,” Science 314, 626–630 (2006).
- Cugliandolo, Gonnella, and Suma (2015) L. F. Cugliandolo, G. Gonnella, and A. Suma, “Rotational and translational diffusion in an interacting active dumbbell system,” Phys. Rev. E 91, 062124 (2015).
- Sarmiento-Gómez et al. (2016) E. Sarmiento-Gómez, J. R. Villanueva-Valencia, S. Herrera-Velarde, J. A. Ruiz-Santoyo, J. Santana-Solano, J. L. Arauz-Lara, and R. Castañeda Priego, “Short-time dynamics of monomers and dimers in quasi-two-dimensional colloidal mixtures,” Phys. Rev. E 94, 012608 (2016).
- Bhattacharya, Blawzdziewicz, and Wajnryb (2005) S. Bhattacharya, J. Blawzdziewicz, and E. Wajnryb, “Hydrodynamic interactions of spherical particles in suspensions confined between two planar walls,” J. Fluid Mech. 541, 263–292 (2005).
- Vollmayr-Lee (2004) K. Vollmayr-Lee, “Single particle jumps in a binary Lennard-Jones system below the glass transition,” J. Chem. Phys. 121, 4781–4794 (2004).
- Mazza et al. (2007) M. G. Mazza, N. Giovambattista, H. E. Stanley, and F. W. Starr, “Connection of translational and rotational dynamical heterogeneities with the breakdown of the stokes-einstein and stokes-einstein-Debye relations in water,” Phys. Rev. E 76, 031203 (2007).
- Weeks et al. (2000) E. R. Weeks, J. C. Crocker, A. C. Levitt, A. Schofield, and D. A. Weitz, “Three-Dimensional direct imaging of structural relaxation near the colloidal glass transition,” Science 287, 627–631 (2000).
- Lombardo, Debenedetti, and Stillinger (2006) T. G. Lombardo, P. G. Debenedetti, and F. H. Stillinger, “Computational probes of molecular motion in the lewis-wahnström model for ortho-terphenyl,” J. Chem. Phys. 125, 174507 (2006).
- Kurita and Weeks (2010) R. Kurita and E. R. Weeks, “Glass transition of two-dimensional binary soft-disk mixtures with large size ratios,” Phys. Rev. E 82, 041402 (2010).
- Glotzer and Solomon (2007) S. C. Glotzer and M. J. Solomon, “Anisotropy of building blocks and their assembly into complex structures,” Nature Materials 6, 557–562 (2007).
- Hall et al. (1998) D. B. Hall, D. D. Deppe, K. E. Hamilton, A. Dhinojwala, and J. M. Torkelson, “Probe translational and rotational diffusion in polymers near : roles of probe size, shape, and secondary bonding in deviations from Debye–Stokes–Einstein scaling,” J. Non-Crystalline Solids 235, 48–56 (1998).