Acceleration of Cosmic Ray Electrons at Weak Shocks in Galaxy Clusters
Abstract:
According to structure formation simulations, weak shocks with typical Mach number, , are expected to form in merging galaxy clusters. The presence of such shocks has been indicated by X-ray and radio observations of many merging clusters. In particular, diffuse radio sources known as radio relics could be explained by synchrotron-emitting electrons accelerated via diffusive shock acceleration (Fermi I) at quasi-perpendicular shocks. Here we also consider possible roles of stochastic acceleration (Fermi II) by compressive MHD turbulence downstream of the shock. Then we explore a puzzling discrepancy that for some radio relics, the shock Mach number inferred from the radio spectral index is substantially larger than that estimated from X-ray observations. This problem could be understood, if shock surfaces associated with radio relics consist of multiple shocks with different strengths. In that case, X-ray observations tend to pick up the part of shocks with lower Mach numbers and higher kinetic energy flux, while radio emissions come preferentially from the part of shocks with higher Mach numbers and higher cosmic ray (CR) production. We also show that the Fermi I reacceleration model with preexisting fossil electrons supplemented by Fermi II acceleration due to postshock turbulence could reproduce observed profiles of radio flux densities and integrated radio spectra of two giant radio relics. This study demonstrates the CR electrons can be accelerated at collisionless shocks in galaxy clusters just like supernova remnant shock in the interstellar medium and interplanetary shocks in the solar wind.
1 Introduction
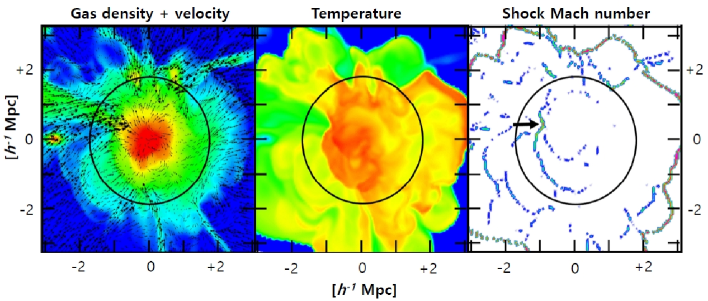
Cosmological hydrodynamic simulations have shown that shock waves form due to supersonic flows in the intracluster medium (ICM) during the structure formation in the Universe [1, 2]. The evolution of such shocks indicates that shock surfaces behave like spherical bubbles blowing out from the cluster center and could last for the dynamical time scale of clusters, Gyr. This implies that shock bubbles are likely to expand out well beyond the virial radius of galaxy clusters. Figure 1 illustrates that the supersonic flows penetrating deeply in the ICM along neighboring filaments could induce shocks near the virial radius, while accretion flows infalling onto the cluster induce strong accretion shocks several Mpc away from the cluster center [3].
It is well accepted that cosmic ray (CR) particles are produced via the diffusive shock acceleration (DSA) process through their interactions with MHD waves in the converging flows across astrophysical shocks [4]. In the test particle limit where the CR pressure is dynamically insignificant, it predicts that the CR momentum spectrum at the shock with the sonic Mach number has a power-law form, , where [5]. Hence, the DSA model can provide a natural explanation for the spatially resolved synchrotron radiation spectrum at the shock location, , where the radio spectral index is .
Diffuse radio structures known as the ‘radio relics’ have been detected in many merging clusters, and they are interpreted as synchrotron emission from relativistic electrons accelerated at merger-driven shocks. Two famous giant radio relics are nicknamed as the ‘Sausage relic’ [6] and the ‘Toothbrush relic’ [8] because of their arc-like or linear shapes. Such elongated morphology is consistent with the spatial distribution of shocks near in Figure 1. Many of the observed features of these radio relics can be explained by DSA model: (1) thin elongated shapes, (2) gradual spectral steepening from the relic edge toward the cluster center, (2) power-law-like integrated spectrum with the spectral index, , and (3) high polarization levels up to 50% that is expected from the shock compression of turbulent magnetic fields [6, 7]. In order to study the origin of radio relics, we perform DSA simulations for CRe at structure formation shocks and compare the model predictions with the observational data of the aforementioned relics.
2 Numerical Calculation
2.1 Numerical Modeling for DSA with Postshock Turbulent Acceleration
We follow the electron acceleration via DSA (Fermi I) at 1D spherical shocks, and radiative cooling and turbulent (Fermi II) acceleration in the postshock region by solving the following diffusion-convection equation:
| (1) |
where is the pitch-angle-averaged phase space distribution function for CRe, is the flow velocity, , is the electron mass, and is the speed of light [11]. Here is the radial distance from the cluster center.
The electron energy loss term, , accounts for Coulomb scattering, synchrotron emission, and iC scattering off the cosmic background radiation. We adopt a Bohm-like spatial diffusion coefficient, for relativistic electrons, where the normalization factor, , with expressed in units of . Moreover, we explore a scenario in which the postshock electrons gain energy by Fermi II acceleration via transit time damping (TTD) resonance with compressive fast-mode MHD turbulence [12]. The momentum diffusion coefficient for TTD resonance can be modeled as
| (2) |
where is an effective acceleration time scale for turbulent acceleration [10]. In order to model the decay of turbulence behind the shock, we assume the turbulent acceleration time increases behind the shock on the scale of as , where and kpc are adopted in the simulations considered here.
2.2 Reacceleration Model
Here we consider the reacceleration model, in which a shock propagates into the preshock region with preexisting low-energy CRe specified by the following power law spectrum with exponential cutoff :
| (3) |
where the slope and the cutoff are adopted. The normalization factor, , is adjusted by the ratio of the preexisting CRe pressure to the gas pressure in the preshock region, . Typically, the models with produce the radio flux levels that can match the amplitude of observed flux densities for the two relic (see Table 1).
In the test particle regime for weak shocks, the reaccelerated spectrum of at the shock can be calculated analytically by
| (4) |
where is the injection momentum above which CR particles participate in the Fermi I acceleration [5]. If the DSA slope, , is smaller than the slope, , of the preexisting population, . In that case, the only significant role of preexisting low-energy CRe is to provide seed particles to be injected to the DSA process.
2.3 Shock Model Parameters
Table 1. Parameters for Model Spherical Shocks
| Model | |||||||||||
|---|---|---|---|---|---|---|---|---|---|---|---|
| (keV) | () | (Myr) | (keV) | () | () | ||||||
| Sausage | 2.7 | 4.6 | 4.0 | 2.1 | 1 | 211 | 3.21 | 8.6 | |||
| Toothbrush | 1.5 | 2.8 | 3.6 | 3.0 | 1 | 144 | 3.03 | 11.2 |
: Mach number inferred from X-ray observations
: Mach number estimated from observed radio spectral index at the relic edge
: initial shock Mach number at the onset of the simulations ()
: gas temperature in the preshock ICM
: magnetic field strength in the preshock ICM
: shock age when the simulated results match the observations
: shock Mach number at
: postshock temperature at
: shock speed at
: the ratio of seed CR electron pressure to gas pressure in the preshock region
The subscripts 1 and 2 denote the states upstream and downstream of shock, respectively.
Here we assume that the shock dynamics can be approximated by a self-similar blast wave that propagates through the isothermal ICM with the hydrogen number density profile of . So the shock radius and velocity evolves roughly as and , respectively, where is the time since the point explosion for the spherical blast wave [13]. Table 1 summarizes two sets of the model parameters that can represent the Sausage and the Toothbrush relic. The second and third columns show the shock Mach number inferred from X-ray and radio observations, respectively [14, 15]. The ICM temperature, , specifies the sound speed of the preshock gas, while the shock Mach number at the onset of the simulation, , determines the initial shock speed. In our simulations, the spherical shock slows down in time, while the postshock electrons advect downstream and cool radiatively behind the shock. So we selected the best time of ‘observation’, , by comparing the predicted profiles of radio flux densities and the integrated radio spectrum with the observed data of the two relics.
The shock properties at given in Table 1 are in reasonable agreement with the observations of the two relics. In the case of the Sausage relic the discrepancy between and is alleviated greatly by . But for the Toothbrush relic, is still higher than . We note that a radio relic may be associated with multiple shocks, and X-ray observations tend to pick up shocks with lower along a given line-of-sight [16]. So inferred from X-ray observations could be lower than estimated from radio spectral index.
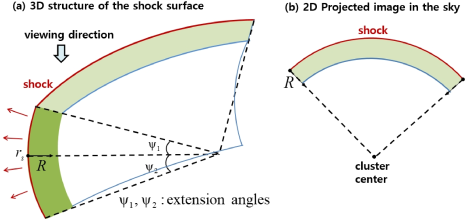
We assume that the Sausage and the Toothbrush relic can be represented by a wedge-like patch of a spherical shell with the radius shown in Figure 2, whose depth along the line-of-sight is specified by the extension angles and . Here is the downstream distance from the shock front. The extension angles should be small, typically , in order to reproduce thin elongated images. The inner radius of the spherical shell containing CRe is roughly defined by the electron cooling length, , where is the cooling time of electrons with the Lorentz factor .
In the case of the Sausage relic, the observed steepens above 2 GHz, which is inconsistent with a single power-law energy spectrum of relativistic electrons that are expected to be accelerated by a steady planar shock [14]. Such a spectral curvature could be explained, if the relic is generated by the shock that sweeps through and moves out of a finite-size cloud with preexisting CRe [9]. So in the case of the Sausage relic we assume that the shock encounters a cloud of size kpc containing , and then exits out of it at Myr. Since the injection of CRe stops from to Myr, the volume-integrated electron energy spectrum steepens toward high energies. So the elapsed period of Myr controls the degree of the spectral curvature of in the model for the Sausage relic.
3 Results
Using the CRe energy spectrum and the magnetic field strength in the model DSA simulations, we first calculate the synchrotron emissivity of each spherical shell. The radio surface brightness, , is calculated by adopting the wedge-like volume of radio-emitting electrons, specified with the two extension angles relative to the sky plane, and , as shown in Figure 2:
| (5) |
where and are the path lengths along line of sight beyond and in front of the sky plane, respectively.
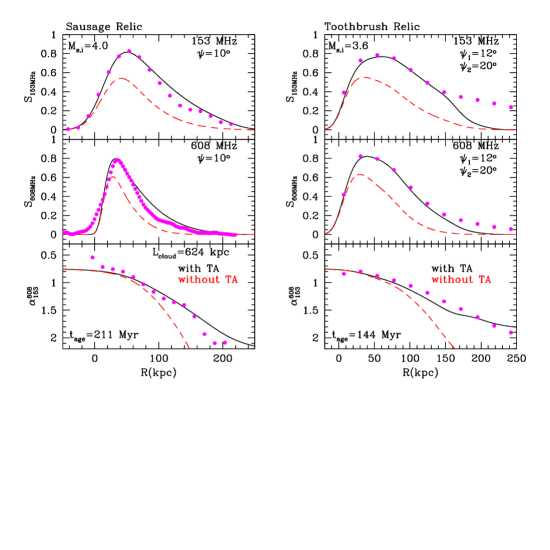
The predicted intensity, , are convolved with relevant telescope beams in order to obtain mock radio flux density distribution, . Figure 3 demonstrates the mock flux profiles at are in good agreement with the observation data for the Sausage and the Toothbrush relic and the Fermi II acceleration due to postshock turbulence plays a crucial role.
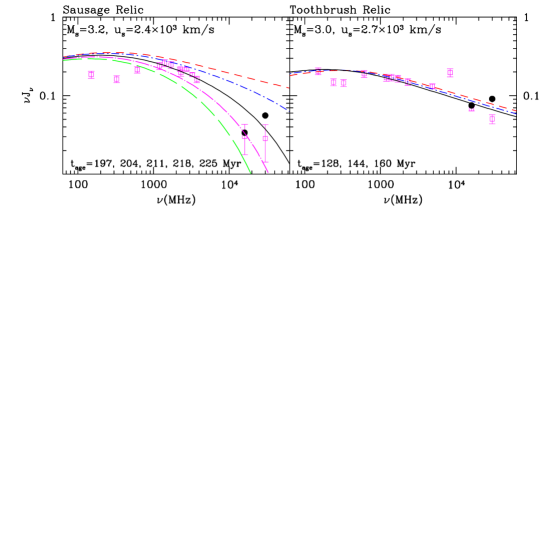
Figure 4 shows the time evolution of for the two relics. For the Sausage relic (left-hand panel), the red dashed line shows the spectrum at the first epoch just before the shock exits out of the cloud. Then the blue dot-dashed, black solid, magenta dot-long dashed, and green long dashed lines present the spectra with progressively steeper curvatures at four later epochs in chronological order. In the case of the Toothbrush relic (right-hand) the integrated spectrum changes only slightly in time. The black solid lines at are in reasonable agreement with the observed spectra in both relics.
4 Conclusions
Here we explore a reaccelration model in which a shock of sweeps through a preshock cloud containing low-energy fossil electrons, and CR electrons are further accelerated by postshock turbulence via Fermi II process. Transit time damping resonance off compressive MHD turbulence in the postshock flow is considered. We find that turbulent acceleration with yr is required in order to match the observed broad profiles of the radio flux density, , of the Sausage and the Toothbrush relic.
We demonstrate that our reacceleration model can reproduce the observed profiles of , , and the spectral index as well as the volume-integrated spectrum of the Sausage radio relic [14] and the Toothbrush relic [15]. The observed spectral curvature in of the Sausage relic can be explained by the finite size of the region containing fossil CRe. The amount of fossil CRe required to explain the observed levels of is order of of the gas pressure in the ICM. The shock parameters for the best fitting models are given in Table 1. This reacceleration scenario is consistent with the observational fact that only a small fraction () of merging clusters host radio relics, since radio relics are generated only in the presence of fossil CRe.
This study confirms the scenario that CR electrons are accelerated at quasi-perpendicular ICM shocks in galaxy clusters, just like supernova remnant shocks in the interstellar medium. Although CR protons are expected to be accelerated at quasi-parallel ICM shocks, gamma-ray emission from galaxy clusters due to decay, which results from inelastic collisions between shock-accelerated CR protons and thermal protons, have not been detected so far [18]. This remains to be an important outstanding problem that needs to be investigated further through plasma simulations.
5 Acknowledgments
HK was supported by Basic Science Research Program through the National Research Foundation of Korea funded by the Ministry of Education (2014R1A1A2057940). DR was supported by the National Research Foundation of Korea through grant 2016R1A5A1013277. TWJ was supported by the US National Science Foundation through grant AST1211595. The authors thank A. Stroe and R. J. van Weeren for providing the radio flux data for the Sausage relic in [14] and the Toothbrush relic in [15], respectively.
References
- [1] D. Ryu, H. Kang, E. Hallman, & T. W. Jones, Cosmological Shock Waves and Their Role in the Large-Scale Structure of the Universe, ApJ, 593 (2003), 599
- [2] F. Vazza, G. Brunetti, & C. Gheller, Shock Waves in Eulerian Cosmological Simulations: Main Properties and Acceleration of Cosmic Rays, MNRAS, 395 (2009), 1333
- [3] S. E. Hong, D. Ryu, H. Kang, & R. Cen, Shock Waves and Cosmic Ray Acceleration in the Outskirts of Galaxy Clusters, ApJ, 785 (2014), 133
- [4] A. R. Bell, The Acceleration of Cosmic Rays in Shock Fronts. I, MNRAS, 182 (1978), 147
- [5] L. O’C. Drury, An Introduction to the Theory of Diffusive Shock Acceleration of Energetic Particles in Tenuous Plasmas, Rept. Prog. Phys., 46 (1983), 973
- [6] R. J. van Weeren, H. J. A. Röttgering, M. Brüggen, & M. Hoeft, et al., Particle Acceleration on Megaparsec Scales in a Merging Galaxy Cluster, Science, 330 (2010), 347
- [7] G. Brunetti, & T. W. Jones, Cosmic Rays in Galaxy Clusters and Their Nonthermal Emission, Int. J. of Modern Physics D, 23 (2014), 30007
- [8] R. J. van Weeren, H. J. A. Röttgering, H. T. Intema, et al., The “toothbrush-relic”: evidence for a coherent linear 2-Mpc scale shock wave in a massive merging galaxy cluster?, A&Ap, 546 (2012), A124
- [9] H. Kang, & D. Ryu, Re-Acceleration Model for Radio Relics with Spectral Curvature, ApJ, 823 (2016), 13
- [10] H. Kang, D. Ryu, & T. W. Jones, Shock Acceleration Model for the Toothbrush Radio Relic, ApJ, 840 (2017), 42
- [11] J. Skilling, Cosmic Ray Streaming. I - Effect of Alfvén Waves on Particles, MNRAS, 172 (1975), 557
- [12] G. Brunetti, & A. Lazarian, Compressible turbulence in galaxy clusters: physics and stochastic particle reacceleration, MNRAS, 378 (2007), 245
- [13] D. Ryu, & E. T. Vishniac, The Dynamic Instability of Adiabatic Blast Waves, ApJ, 368 (1991), 411
- [14] A. Stroe, T. W. Shimwell, C. Rumsey, et al., The Widest Frequency Radio Relic Spectra: Observations from 150 MHz to 30 GHz, MNRAS, 455 (2016), 2402
- [15] R. J. van Weeren, G. Brunetti, M. Brüggen, et al., LOFAR, VLA, AND Chandra Observations of the Toothbrush Galaxy Cluster, ApJ, 818 (2016), 204
- [16] S. E. Hong, H. Kang, D. Ryu, Radio and X-ray shocks in clusters of galaxies, ApJ, 812 (2015), 49
- [17] K. Basu, F. Vazza, J. Erler, & M. Sommer, The impact of SZ effect on cm-wavelength (1-30 GHz) observation of galaxy cluster radio relics, A&AP, 591 (2016), A142
- [18] M. Ackermann et al., Search for Cosmic-Ray-induced Gamma-Ray Emission in Galaxy Clusters, ApJ, 787 (2014) 18