(190.3270) Kerr effect; (190.1450) Bistability;(190.5330) Photorefractive optics.
A self-tuning optical resonator
Abstract
We demonstrate a nonlinear optical resonator that tunes itself onto resonance with an input beam. In a monolithic Fabry-Perot cavity implemented in rubidium-doped periodically-poled potassium titanyl phosphate, an intensity-dependent refractive index produces line-pulling by multiple free-spectral ranges (FSRs). In this condition, the cavity passively maintains optical resonance in the face of FSR-scale excursions of the drive laser frequency: when one resonant operating-point becomes unstable, the resonator rapidly transitions to another resonant operating point. We demonstrate stable second-harmonic generation with no active feedback to laser or cavity. The self-tuning effect appears to be supported by a very strong, previously unreported optical nonlinearity.
Dispersive optical nonlinearities enable all-optical functionalities including optical memories [1, 2], optical switches [3], and optical signal processors [4]. Renewed interest in these devices is driven by their potential to reduce system complexity and latency, for example in chip-level optical interconnects.
Here we demonstrate a new nonlinear-optical device functionality, the self-tuning optical resonator, applied as a second harmonic generation device. Many nonlinear optical applications use resonators to boost local intensities, enhancing the nonlinear effect of interest. Higher resonator finesse generally gives greater enhancement, but makes more challenging the task of maintaining optical resonance, which to date requires electronic solutions. This tuning challenge is somewhat mitigated when dispersive intra-cavity optical nonlinearities can shift the cavity resonance in function of the intra-cavity power, leading to broadened and asymmetric lines without increasing the cavity finesse, hysteresis, and optical bi-stability. The self-tuning resonator employs an extreme version of this effect, in which the line-pulling can reach multiple FSRs, giving the system multiple stable points, all of which are close to resonance. When the input laser frequency is moved, the system, once the stable point reaches the peak transmission and becomes unstable, automatically finds the next closest to resonance stable point.
The experimental setup is shown in Fig. 1. A single crystal device, described in detail in [5], was constructed from a rubidium-doped potassium titanyl phosphate (RKTP) crystal with dimensions of . The RKTP crystal was poled with poling period in the middle section (poled volume ), supplied by KTH Stockholm [6]. The crystal was spherically polished on both sides with the radius of and coated to create desired mode shape and form a stable resonator for both the fundamental and second harmonic (SH) wavelengths. Side 1 is coated to be completely reflective at , and for , whereas side 2 is completely reflective for the and reflective for the , giving the resulting finesse 20.5 for the fundamental and 8.4 for the SH. In consequence, when on resonance the fundamental intra-cavity power is approximately 25 times larger than the input power. The waist of the fundamental beam in the centre of the crystal is . Independent temperature controls of the central and end sections are used to achieve simultaneous phase matching and double resonance.
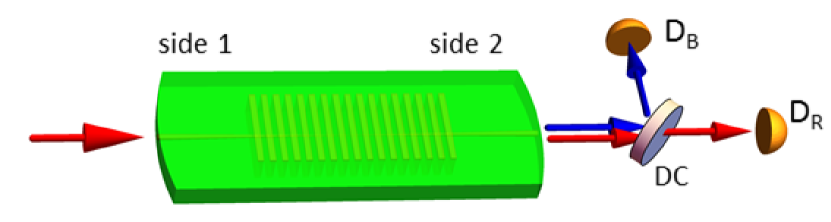
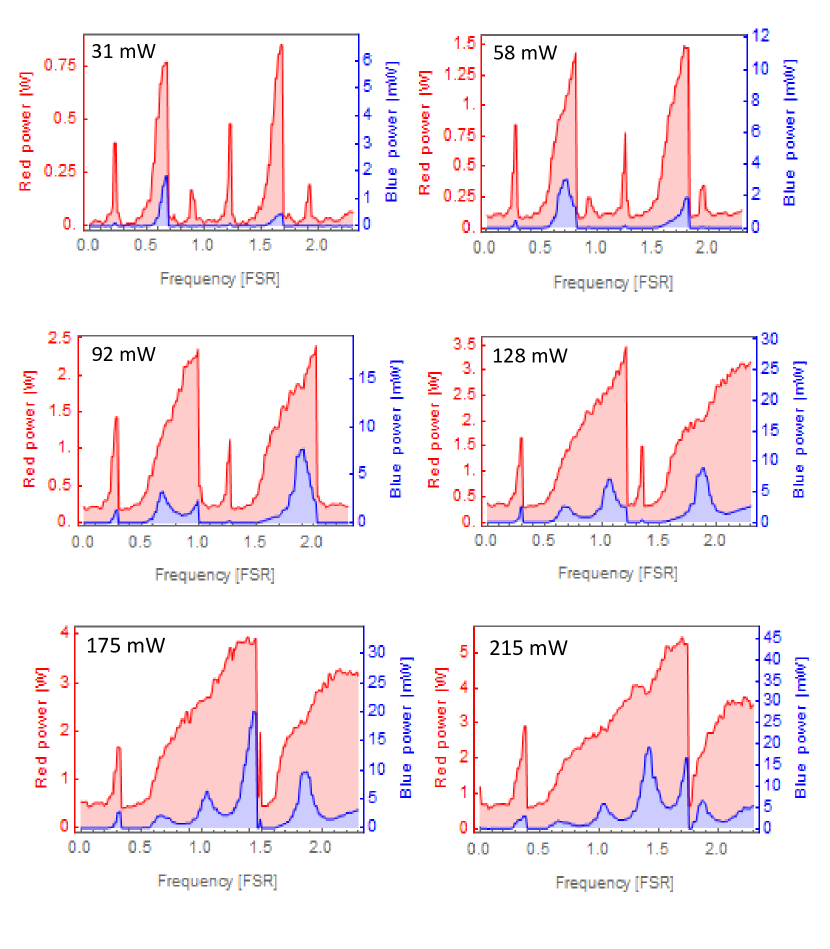
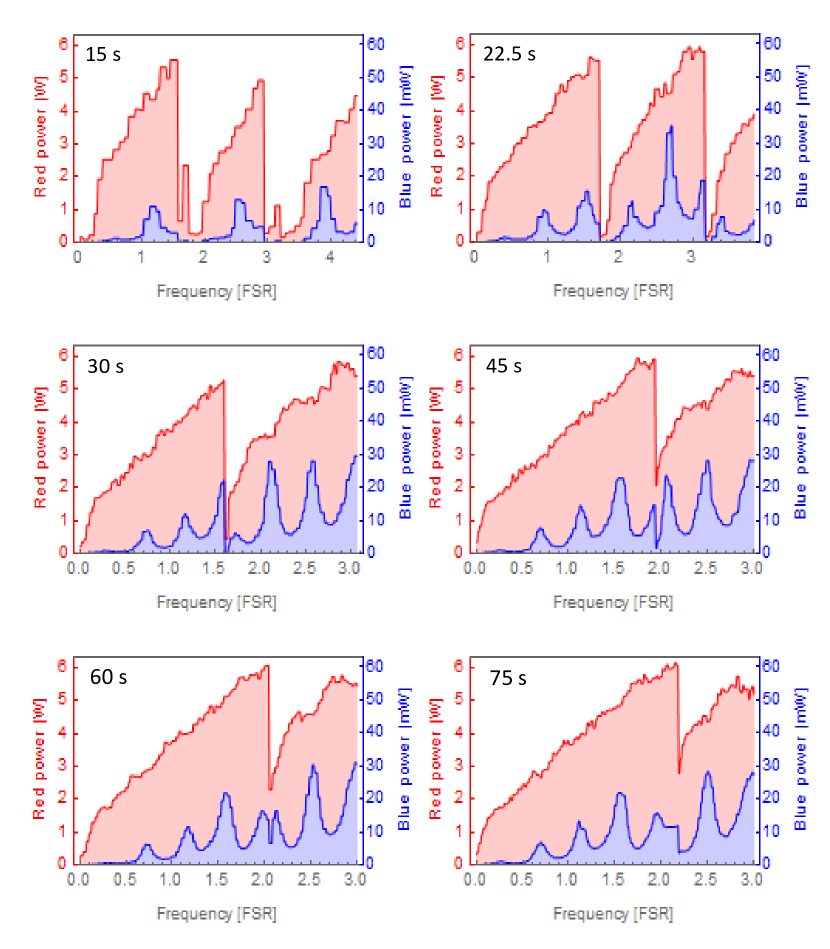
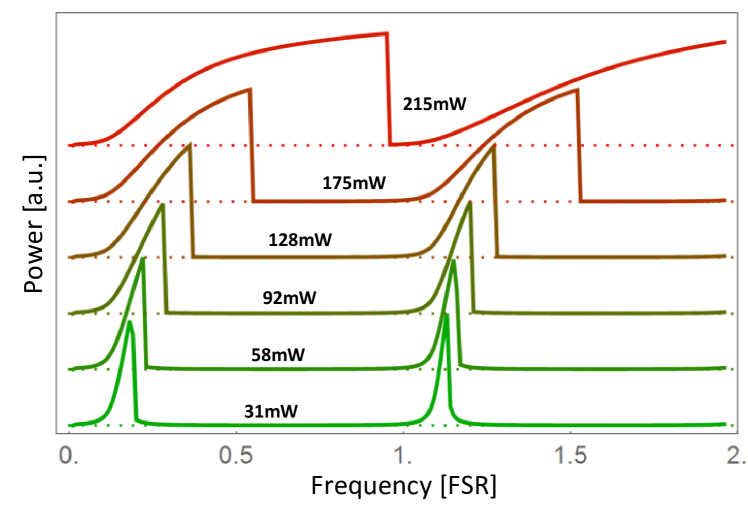
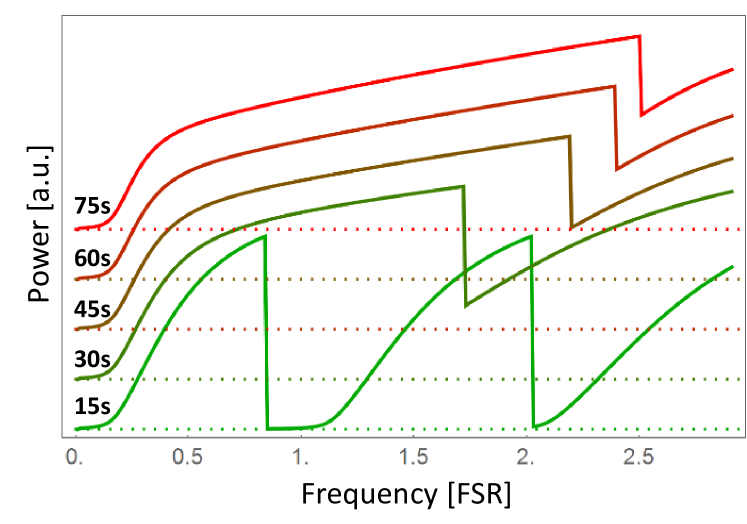
The device is pumped with up to of tunable light at (yielding maximum power density inside the crystal of ), and fundamental and SH wavelengths are separately collected at the output. The light source used in the experiment was a distributed Bragg reflector laser (Photodigm PH795DBR) emitting cw light with a bandwidth of , amplified by a tapered amplifier (Eagleyard Photonics). The light frequency scan was realized by varying the laser current in steps corresponding to frequency change. Both fundamental and SH powers at the cavity output were measured using Thorlabs DET36A detectors (bandwidth ). As shown in Fig. 2, optical bistability is clearly seen when scanning the pump frequency, evidenced by asymmetrical deformation of the cavity resonance, hysteresis, and abrupt transitions from high- to low-power stable points, with all these effects growing with pump power. Kerr bistability is well known to produce such effects, but what we observe here cannot be explained with a simple Kerr nonlinearity. As shown in Fig. 3, the observed effects depend strongly on the speed of the scan, continuing to increase in prominence on long time-scales: We can deduce from Fig. 3 that the timescale of the resonance-dragging effect is , much longer than any optical time-scale in the system, such as cavity ring-down time. At the same time, the jumps from a stable point at one peak to directly to a stable point at another, visible in Fig. 3, appear to be very fast (compared to the detector response time below ), suggesting the deformation of cavity spectrum depends on the instantaneous power in the cavity as well as its long-time average, indicating a refractive index depending in (at least) second order on the intensity. The maximum observed photo-induced refractive index change is of approximately , which for the power density in the experiment corresponds to the Kerr constant 111Here Kerr constant is defined so that refractive index change due to power density at wavelength yields . Further on, for convenience we use Kerr coefficient , defined so that , with being the incident electric field. of . Further discussion of the nonlinearity is given at the end of this Letter.
The observed nonlinearity has an evident benefit in maintaining resonance in the system: due to the strong nonlinearity, at higher powers the cavity line is pulled by more than a FSR. As a result, when the system jumps from a resonant stable point, it drops to another stable point that is also nearly resonant. As seen in Fig. 3, at the highest power and slowest scan, the system maintains of the intra-cavity pump power after such a jump and then rises toward full power. Resonant behavior can thus be maintained even without frequency stabilization. We refer to this as cavity self-stabilization. By setting the frequency to achieve a desired power (up to 95 of the maximum transmission), we have observed that the intra-cavity power is stable within few percent over hours, without any active frequency control. In in practice we can easily stabilize the cavity length for the red at least 97 of the maximum power of the transmission with output power fluctuations of less than 1 and stability of several hours using a simple slow () side-of-fringe stabilization, provided the temperatures of the three sections of the crystal are stabilized. This moreover permits slow adjustment of the temperatures of the various crystal sections to achieve blue resonance.
The bistability effects described above clearly show two time-scales, notable in the fast change from one stable state to another, and in the accumulation time. The effect does not appear to depend on the presence of the SH - the bistability occurs also when the SH is not generated, either because it is not resonant, the fundamental pump polarization is rotated, or because the poled section is far from the phase-matching temperature of (we observe similar behavior for temperatures ranging from to ). The variations of the power of the SH light when pump frequency is scanned depicted in Figs. 2 and 3 are determined by combination of pump power in the cavity, SH cavity resonance and interference between light generated forward and backward directions in the cavity, and appear not to be affected by the new nonlinear effect we observe in fundamental light.
While a thermal effect involving the temperature of the whole device could in principle operate on the timescale, this explanation appears implausible: because RKTP is highly transparent at , optical heating of the crystal is mostly due to absorption of the SH light: the roundtrip loss is estimated to be . Thermal changes in the cavity due to presence of fundamental light are hardly noticeable on the crystal temperature sensors, which is not the case with SH light.
Moreover, the observed effects cannot be attributed to fast changes in the local temperature, as thermooptical effect caused by them would be expected to influence the SH resonance condition more than the fundamental [7], whereas the effect we see does not seem to deform the shape of the SH resonances at all. We can also rule out blue light induced infrared absorption (BLIIRA) as an explanation, despite its long (several minutes) timescale [8] because an absorptive effect alone cannot cause the peak deformation we observe: while absorptive nonlinearities can produce bistability, they cannot pull cavity lines many linewidths away from their cold-cavity frequencies. Similarly, the cavity behavior we observe cannot be attributed to the photorefractive damage due to multi-photon absorption (gray tracking) desecribed in [9].
The effect most closely resembles photorefractive effects, in which optically-excited carriers become trapped for long times in impurity levels [10] and thereby contribute to the linear refractive index in function of the intensity history of the material. Here, in contrast, what appears to depend on the intensity history is the nonlinear refractive index, or optical Kerr coefficient for the wavelength. For this reason, we call this the photo-Kerr effect. These same effects were observed in each of three monolithic RKTP resonators we tested, with one of the three showing cavity-pulling by roughly less than the other two at the same input power.
We find the behavior can be reproduced by a model in which a fast Kerr nonlinearity is present, with a Kerr coefficient that grows at a rate proportional to the intra-cavity red power, and decays on a time-scale. The model describes the multi-stable and hysteretic response of the fundamental and SH fields in the driven resonator, subject to nonlinear propagation equations of the form
| (1) | |||||
| (2) |
where and are slowly-varying envelopes of the fundamental and SH fields, respectively, (characterized by wavevectors and ) and are nonlinear coupling coefficients. The refractive index of the fundamental light at frequency is denoted as , and stands for the speed of light. The Kerr coefficient evolves slowly as
| (3) |
where is the decay rate and is a coupling constant, allowing the model to describe both fast and slow () time-scales.
Since the intracavity power is the variable accessible in the experiment, let us substitute where is a mode-shape dependent constant with the units of . To simulate a scan, as in Figs. 2 and 3, we define a small time step and update as
| (4) |
where , and update the fields changing their frequency with the rate according to the scan speed and finding the steady state solution of the Eq. (2).
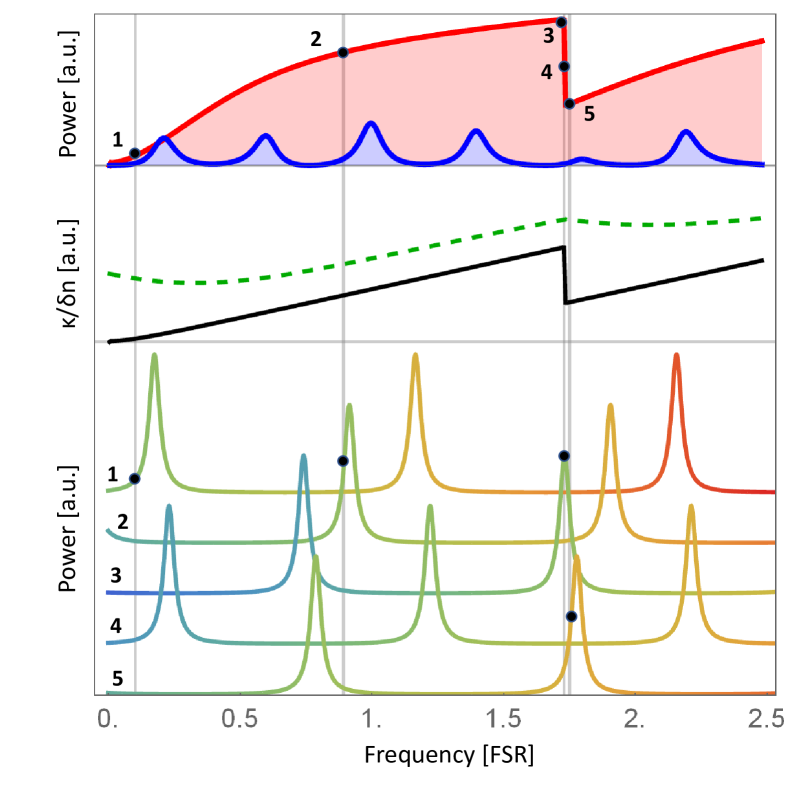
Results from the model are shown in Figs. 4, 5 and 6. Fig. 4 illustrates the bistability mechanism and shows how the photo-Kerr effect produces self-stabilization near a cavity resonance, presenting results calculated at the phase-matching temperature. Following the fundamental light frequency scan, at point 1 (marked in the upper part of the figure and), the red field encounters a resonance. At point 2, the side-of-resonance condition is maintained by the combined effects of resonance and nonlinear refractive index. accumulates, allowing the resonance to shift by more than one FSR. When the top of the resonance peak is reached (point 3), the resonance cannot shift anymore and the system becomes unstable. The power starts to drop and cavity resonance quickly retreats (point 4). Because the peak was shifted by more than one FSR, the system encounters another stable side-of-resonance condition (orange in the figure) as the nonlinear shift reduces (point five). As the scan proceeds the resonances once again shift and the process repeats.
The dependence of cavity peak deformation on the power calculated from the theoretical model is presented in Fig. 5. For simplicity, the calculation is performed out of phase matching temperature and only the fundamental light power is shown in Figs. 5 and 6. Similar dependence on the scan speed can be found in the Fig. 6. The model reproduces qualitatively the behaviour of the cavity.
Model parameters that give reasonable agreement with observation are decay time (corresponding to ), , the initial Kerr coefficient multiplied by the inverse of geometry constant , and time step . The same , , and parameters are used for results in Figs. 4, 5 and 6.
We have described a self-tuning nonlinear optical resonator, in which a strong dispersive optical nonlinearity produces cavity line-pulling that can reach up to multiple FSRs. In these conditions, optical multi-stability maintains resonance of the cavity, because multiple stable points involve significant intra-cavity power and near-resonance. We have used the self-tuning device for cavity-enhanced second-harmonic generation with no active tuning. The effect appears to derive from a previously unreported optical nonlinearity, in which the optical Kerr coefficient of a material strongly depends on the long-time average of the intensity in the material. Modeling with nonlinear optical propagation equations well reproduces the observed behavior, and indicates that the new nonlinearity is far stronger than the ordinary Kerr effect in the host material.
Funding Information
This work was supported by European Research Council (ERC) projects AQUMET (280169) and ERIDIAN (713682); European Union QUIC (641122); Ministerio de Economia y Competitividad (MINECO) Severo Ochoa programme (SEV-2015-0522) and projects MAQRO (Ref. FIS2015-68039-P), XPLICA (FIS2014-62181-EXP); Agència de Gestió d’Ajuts Universitaris i de Recerca (AGAUR) project (2014-SGR-1295); Fundació Privada CELLEX; J.Z. was supported by the FI-DGR PhD-fellowship program of the Generalitat of Catalonia.
Acknowledgments
We thank Carlota Canalias and Andrius Zukauskas from KTH Royal Institute of Technology in Stockholm for valuable discussions and for fabricating the RKTP crystals.
References
- [1] D. A. Parthenopoulos and P. M. Rentzepis, Science 245, 843 (1989).
- [2] F. T. S. Yu and S. Jutamulia, Optical Signal Processing, Computing, and Neural Networks (John Wiley & Sons, Inc., New York, NY, USA, 1992), 1st ed.
- [3] R. Yu, S. Cheung, Y. Li, K. Okamoto, R. Proietti, Y. Yin, and S. J. B. Yoo, Optics Express 21, 32655 (2013).
- [4] W. Liu, M. Li, R. S. Guzzon, E. J. Norberg, J. S. Parker, M. Lu, L. A. Coldren, and J. Yao, Nat Photon 10, 190 (2016).
- [5] J. A. Zielińska, A. Zukauskas, C. Canalias, M. A. Noyan, and M. W. Mitchell, Opt. Express 25, 1142 (2017).
- [6] A. Zukauskas, V. Pasiskevicius, and C. Canalias, Opt. Express 21, 1395 (2013).
- [7] K. Kato and E. Takaoka, Appl. Opt. 41, 5040 (2002).
- [8] S. Tjörnhammar, V. Maestroni, A. Zukauskas, T. K. Uždavinys, C. Canalias, F. Laurell, and V. Pasiskevicius, Opt. Mater. Express 5, 2951 (2015).
- [9] J. K. Tyminski, Journal of applied physics 70, 5570 (1991).
- [10] P. Günter and J. Huignard, Photorefractive Materials and Their Applications 3: Applications (Springer, 2007).