Mid-infrared flare of TDE candidate PS16dtm: Dust echo and implications for the spectral evolution
Abstract
PS16dtm was classified as a candidate tidal disruption event (TDE) in a dwarf Seyfert 1 galaxy with low-mass black hole () and has presented various intriguing photometric and spectra characteristics. Using the archival WISE and the newly released NEOWISE data, we found PS16dtm is experiencing a mid-infrared (MIR) flare which started days before the first optical detection. Interpreting the MIR flare as a dust echo requires close pre-existing dust with a high covering factor, and suggests the optical flare may have brightened slowly for some time before it became bright detectable from the ground. More evidence is given at the later epochs. At the peak of the optical light curve, the new inner radius of the dust torus has grown to much larger size, a factor of 7 of the initial radius due to strong radiation field. At days after the first optical detection, the dust temperature has dropped well below the sublimation temperature. Other peculiar spectral features shown by PS16dtm are the transient, prominent FeII emission lines and outflows indicated by broad absorption lines detected during the optical flare. Our model explains the enhanced Fe II emission from iron newly released from the evaporated dust. The observed broad absorption line outflow could be explained by accelerated gas in the dust torus due to the radiation pressure.
Subject headings:
galaxies: individual (PS16dtm) — galaxies: active — galaxies: nuclei1. Introduction
When a star passes within the tidal radius of a supermassive black hole (SMBH), it will be tidally disrupted and partially accreted by the central black hole, producing luminous flares in the soft X-ray, UV and optical wavelengths. The flare usually lasts a few months to years (decaying as ) and releases a total energy of erg for a solar-type star (see Rees 1988; Phinney 1989). This phenomenon is known as tidal disruption event (TDE). Despite that TDE is a ubiquitous consequence of the existence of SMBHs at the cores of galaxies, yet almost all known TDEs are discovered in dormant galaxies but not in active galactic nuclei (AGN). In fact, there’s no physical process specifically forbids disruptions from occurring and the rates are expected to be even higher when the black holes are originally active (Hills 1975; Karas & Subr 2007). The problem is that it’s much more challenging to identify TDEs in AGNs. First, the TDE flare manifests itself as a much lower contrast signal relative to the permanently bright accretion disk, while the discoveries of TDEs are usually triggered by a sudden and intense brightening of the galaxy centers in time-domain surveys. Second and the most intractable problem is one can barely connect any particular flare in a classical AGN with a TDE, because the long-lived accretion itself can potentially cause high-amplitude variability, by some special instability of the accretion disk. Given the number of transients now discovered by time domain surveys, and the limited resources for spectroscopic follow-up, transients coincident with the centers of active galaxies have often been attributed solely to AGN variability. Observationally, quite a few studies of the outburst signatures in Seyfert galaxies have considered the possibility of TDEs in AGNs (e.g., Peterson & Ferland 1986; Brandt et al 1995), while none of them can draw convincing conclusion due to the potential intrinsic variability (see section 7 in Komossa 2015).
Recently, Blanchard et al (2017) have claimed that they have discovered a TDE candidate PS16dtm in SDSS J015804.75-005221.8 (hereafter J0158 for short), which is a Seyfert 1 galaxy with low-mass black hole ( , Greene & Ho 2007; Xiao et al. 2011). This event shows several distinctive characteristics revealed by multi-wavelength photometric and spectroscopic follow-up monitorings: (1) the light curve has brightened by about two magnitudes in 50 days relative to the archival host brightness and then exhibited a plateau phase for about 100 days. (2) it is undetected in the X-rays by Swift/XRT to a limit an order of magnitude below an archival XMM-Newton detection. (3) the spectra, spanning UV to near-IR, exhibit multicomponent hydrogen emission lines and strong Fe II emission complexes, show little evolution with time, and closely resemble the spectra of NLS1s while being different from those of Type IIn SNe. (4) the UV spectra shows a broad Mg II absorption component, indicative of an outflow. These features make it quite distinctive from known TDEs found in normal galaxies and may provide us an unique opportunity to understand the physical mechanisms associated with both TDEs and AGNs, such as the arising of Fe II lines in NLS1s and the driven mechanism of broad absorption line (BAL) quasars.
In this paper, we report a mid-infrared (MIR) flare detected in the location coincident with PS16dtm using data from the Wide-field Infrared Survey Explorer (WISE; Wright et al. 2010; Mainzer et al. 2014). Recent detections of MIR flares in TDEs are all explained successfully as the dust echoes (Jiang et al. 2016; Dou et al. 2016, 2017; van Velzen et al. 2016). The MIR echoes can help us probe the dusty medium within a few parsecs surrounding SMBHs and measure the total energy released during the event. The MIR flare found in PS16dtm may also give us useful insights to unveil its nature and explain its various interesting properties mentioned above. We assume a cosmology with km s-1 Mpc-1, , and . At a redshift of , PS16dtm (associated with J0158) has a luminosity distance of 365.4 Mpc.
2. Mid-infrared and optical light curves
The WISE has performed a full-sky imaging survey in four broad mid-infrared bandpass filters centered at 3.4, 4.6, 12 and 22 m (labeled W1-W4) from 2010 February to August. The solid hydrogen cryogen used to cool the W3 and W4 instrumentation was depleted later and it was placed in hibernation in 2011 February. WISE was reactivated and renamed NEOWISE-R since 2013 October, using only W1 and W2, to hunt for asteroids that could pose as impact hazard to the Earth. WISE has scanned a specific sky area every half year and thus yielded 9-11 times of observations for every object up to now. For each epoch, there are 10-20 single exposures. We use only the best quality single frame images by selecting only detections with data quality ag ’qual_frame’¿0.
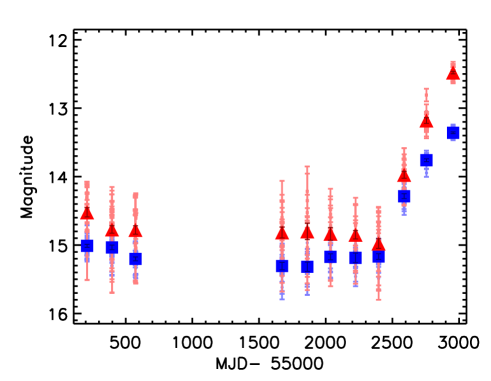
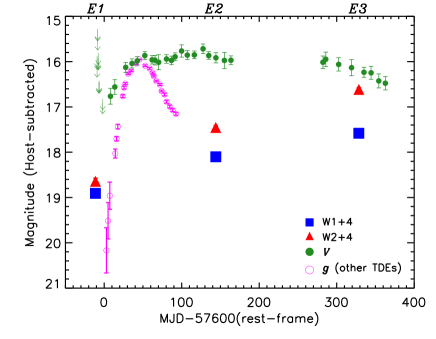
J0158 is a point-like source in all of the WISE images and there’s no any potential contamination within 20″. We have collected all of its WISE photometric data, including from ALLWISE and NEOWISE-R catalogs. The data are distributed in 11 epochs at intervals of about six months up to 2017 July. The light curves in W1 and W2 are presented in Figure 1. First, no reliable variability is detected within each epoch and thus we then average these data to obtain a mean value at each epoch following our previous works (Jiang et al. 2012; 2016). Second, there’s no significant variability in the first 8 epochs; possible slight variation can be due to the usual AGN fluctuation. We take these 8 epochs as the quiescent state, in which the MIR emission can be considered as the background emission from the host galaxy and AGN, contributing an averaged magnitude of and at W1 and W2, respectively. However, it has become mag brighter in both bands from the ninth epoch, that is MJD=57,587 or 2016 July 18. The flux get even more higher in the next two epochs, suggesting it is a MIR flare. We have presented the background-subtracted light curves in the top panel of Figure 3 and denoted the three brightened epochs as ”E1”, ”E2” and ”E3”.
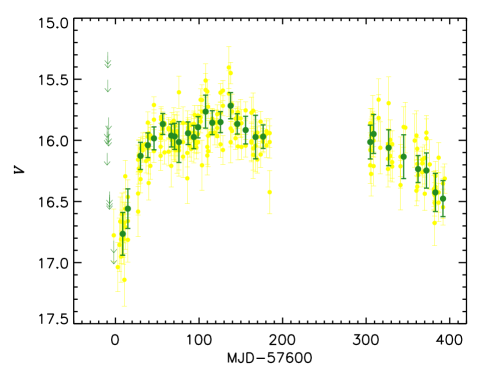
We have noticed that as metioned in Blanchard et al. (2017), PS16dtm was discovered by Pan-STARRS Survey for Transients (PSST; Huber et al. 2015) on 2016 Aug 12 (MJD=57,612) and by the All-Sky Automated Survey for Supernovae (ASAS-SN; Shappee et al. 2014) on 2016 July 29 (MJD=57,598), that is 25 and 11 days later than ”E1”, respectively. In order to check and update its optical light curve, we have retrieved the -band photometry up to now from ASAS-SN light curve server (Kochanek et al. 2017) 111https://asas-sn.osu.edu/ and presented them in Figure 2. PS16dtm has risen to its optical peak within days since its detection and then kept at an almost constant level for days. After more days, it enters into the visibility window of ASAS-SN again and shows a slow declining trend, matching with a TDE scenario.
As J0158 is undetected by ASAS-SN before the outburst, we turn to an estimation of the quiescent magnitude from the SDSS photometry taken at more than a decade before (MJD=52,224). We adopted the transformation (=g-0.52*(g-r)-0.03) introduced in Jester et al. (2015), yielding with an error of 0.05, that is indeed far below the ASAS-SN detection limit (). The background-subtracted -band light curves are shown in Figure 3.
3. Analyses and Results
3.1. The early detection of the MIR flare: not inconsistent with a dust echo
Previous detections of MIR flares in TDEs are all attributed to dust echoes in view of the basic fact that the MIR flares lag behind the optical (Jiang et al. 2016; Dou et al. 2016, 2017; Van velzen et al. 2016). Nevertheless, the WISE detection time of the PS16dtm MIR flare is suprisingly earlier than the optical detection. At the face value, it is hard to explain the MIR flare of PS16dtm as a dust echo as usual. However, the particularities of the event must be taken into consideration to see whether the contradiction is explicable or not.
First, the host of PS16dtm before the outburst is a low-luminosity Seyfert 1 galaxy with erg s-1 (Pons & Watson 2014) and (5100Å)/=0.5 (Blanchard et al. 2017). The bolometric luminosity () can be roughly estimated as (5100Å)= erg s-1 (Kaspi et al. 2000), that’s assuming a BH mass (Xiao et al. 2011). At this quiescent state, the inner radius of dusty torus can be estimated from the sublimation radius (e.g. Namekata & Umemura 2016). For a typical AGN spectrum, the dust sublimation radius is given by
| (1) |
where is the bolometric luminosity of AGN, is the sublimation temperature of dust grain, and is the grain radius. On the other hand, the torus inner radius can be estimated from the -band reverberation mapping result (e.g. Suganuma et al. 2006; Kishimoto et al. 2007). For example, Kishimoto et al (2007) has given a time-lag radii as function of -band luminosity by fitting data points from Suganuma et al (2006):
| (2) |
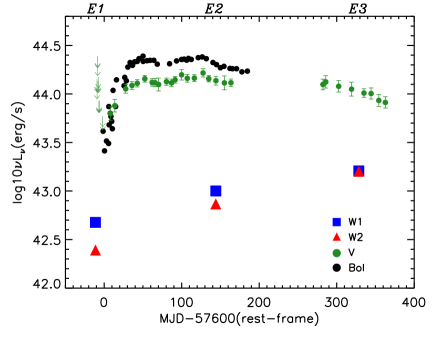
Both methods yield a physical scale of or 10 light days for the BH in J0158. The small distance of the dusty torus to the continuum source may explain the early detection of the MIR flare because the time-delay is too short to measure. Naively assuming that the increased MIR flux is coming from the dust thermal emission heated by the TDE, the derived blackbody temperature is presented in Figure 4. The blue W1-W2 color (0.27 magnitudes) at E1 corresponds to a blackbody temperature of K, supporting that the dust responsible for the early MIR flare is located at around sublimation radius. Second, at the early rising phase, the MIR luminosity is of the bolometric one (see bottom panel of Figure 3), indicating that the covering factor of the dust is fairly high. In this scenario, the surrounding dust may absorb a significant fraction of UV-optical photons and then re-emit in the IR, attenuating the optical flare but boosting the MIR flare. Third, it’s difficult to detect TDEs in active galaxies in the early rising, prevented by the dilution of the background emission, including the intrinsic BH accretion and instability. In contrast, the MIR emission is dominated by hot dust heated by black hole accretion and much less diluted by the host galaxy. Moreover, the photometry basing on ground-based optical survey is severely limited by sky conditions, such as the moon phase impact on PS16dtm before its detection by ASAS-SN.
Above three, the puzzling fact that the flare was detected in MIR earlier than optical is unusual but not unreasonable. The optical flare should have been rising for some time before it became bright enough for ASAS-SN to detect. If that is the case, the rising timescale of this event is probably longer than other TDEs. It’s interesting to compare the optical light curves of PS16dtm with two other well-known TDEs monitored since early rising stage (PTF09ge and PS1-10jh) shown in Arcavi et al. (2014). Obviously, the rising slope of PS16dtm is much smoother, agreeing with our expectation. Further studies of the physical nature behind different rising behaviours is valuable to explore when we have more well-sampled TDE light curves in the future.
This problem can be also reconciled in alternative ways under the TDE scenario. According to the calculation of Guillochon & Ramirez-Ruiz (2015), there is a delay between the flare and the disruption of the star of order years for BH mass of . With such delay, the unbound debris can reach a distance of a light month when we see optical flare. If the unbound debris collides with molecular clouds in dust torus, it will produce strong shocks and emit UV/X-rays, which can heat the surrounding dust. If a substantial fraction of kinetic energy of the debris is converted to the radiation energy, it may explain the early emission of the observed MIR flare. The other interpretation has to do with the uncertain origin of optical emission in TDE disks. Naive models of TDE disks predict that most emission should be in the soft X-ray/EUV, and the optical emission should be orders of magnitude dimmer than what we have observed for optically discovered TDEs (Miller 2015). The most common solution to this puzzle is that TDEs create some kind of ”reprocessing layer” at times of Schwarzschild radii to absorb and downgrade the hard photons from the central engine. This layer could either be a quasi-static bound envelope of poorly circularized debris (Metzger & Stone 2016) or some sort of outflowing wind (Guillochon et al. 2014). It is possible that this reprocessing layer takes some time to set up, and thus the optical emission lags behind the MIR emission heated by the bare, unreprocessed X-ray/EUV emission from the inner accretion disk. These scenarios are interesting and possible, yet current data for PS16dtm are insufficient to test and can only be checked by other X-ray discovered TDEs.
3.2. Further evidence for the MIR flare as a dust echo
As the bolometric luminosity of PS16dtm increases, dust in the inner region evaporates gradually, pushing the inner side of dusty torus outward. The peak luminosity of the flare ( erg s-1) determines a new torus inner radius of about times larger than its quiescent size, or 70 light days (). During this process, the time lag effect on the light curve becomes important because the UV continuum rising timescale (of order 30 days) is shorter than the light crossing time scale. Basing on this evolution picture, more evidence for the dust echo appears at the second and third WISE detection epoch (E2 and E3), that’s rest-frame and 330 days after the optical detection.
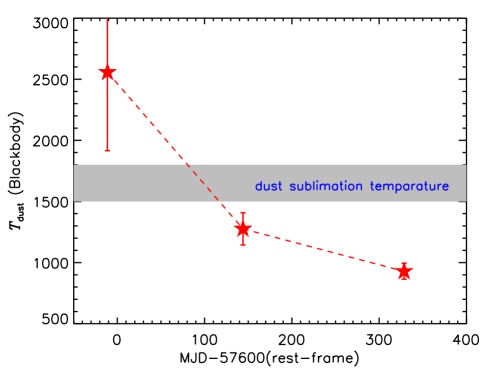
The bolometric luminosity at E2 remains nearly the same as the peak, while the MIR color becomes much redder (W1-W2=0.65) than E1 (see Figure 3), indicating a blackbody dust temperature of K. This fact implies that the average dust temperature () may have dropped to well below the sublimation temperature (see Figure 4); the dominated IR emission comes from further away, and the dust around the inner region must be optically thin. It’s also notable that the IR luminosity is only a small fraction () of bolometric luminosity at E2, implying a smaller covering factor at E2 than E1 as a result of dust sublimation. Since the optical light curve is almost flat and declining very slowly at E3, the dust emission from inner region should not change much. However, the dust emission located more further out is add-on and thus it will lead to a continuously rising light curve yet a declining dust temperature in the case of extended optically thin dust. The prediction is exactly consistent with the WISE observation at E3, which has a higher MIR liminosity yet redder color (W1-W2=0.97), namely lower dust temperature ( K).
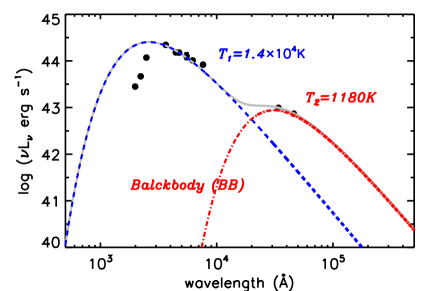
To obtain a stricter value and more quantitive calculation, we have collected the UV-optical-IR photometric data observed quasi-simultaneous with E2 (see Figure 5). First, we tried to fit the spectral energy distribution (SED) with double-blackbody model, yielding a of K. During the fit, we have fixed the blackbody temperature responsible for the UV-optical emission to K as given in Blanchard et al. (2017). Assuming the equilibrium temperature is determined by the balance between the radiative heating by the absorption of UV-optical photons and the thermal re-emission in the IR:
| (3) |
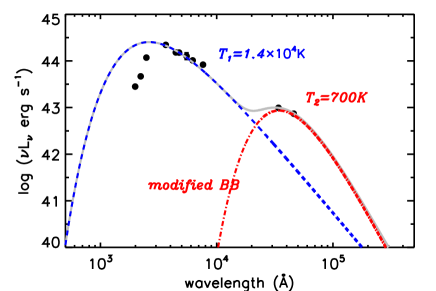
The calculated is erg s-1, comparable yet slightly higher than the observed peak . Here we have used the dust distance calculated from a light travel time of 120 days, that is the time interval since the peak. Similar to the case of ASASSN-14li (Jiang et al. 2016), the blackbody assumption for the dust emission could be over-simplistic and the dust absorption efficiency () should be taken into account. The value is quite uncertain: it approaches zero for very large grain (grey case); while for small grains, strongly depends on the composition, i.e. for graphite, for silicate, and for SiC. If we adopt (see formula 8.16 in Kruegel 2003):
| (4) |
we get and an integrated IR luminosity of erg s-1, calling for of erg s-1and erg s-1 for dust with MRN size distribution (Mathis et al. 1977) and an average size of m, respectively. This can be taken as a lower limit for the dust temperature and required .
Although with large uncertainties caused by the dust absorption efficiency and grain size, we can conclude that the derived is basically comparable to the observed peak luminosity of PS16dtm, providing a substantial evidence of the dust echo associated with the TDE.
3.3. The rapid emergence of Fe II lines: metal released from the evaporated dust?
In the introduction, we have mentioned that various intriguing spectral characteristics have been found in PS16dtm after its discovery. Most remarkably, the optical spectra of PS16dtm show complex emission structures with narrow and broad components in the range Å arising primarily from the Fe II multiplets. Moreover, the Fe II lines overall become stronger revealed by monitored spectrum spanning +25 to +189 rest-frame days since the beginning of the rise (MJD 57600). The rapid emergence of prominent optical Fe II lines makes PS16dtm resemble a classical NLS1. The physical mechanism that drives the formation of Fe II lines in NLS1s is still a mystery although it’s well known that Fe II strength is generally correlated with the Eddington ratio (e.g., Boroson & Green 1992; Dong et al. 2011). PS16dtm may offer us a marvellous opportunity to explore the mechanism taking advantage of the dynamic transition process from a normal type 1 AGN to a NLS1 witnessed by us.
To explain its IR light curve, a simple model for PS16dtm is proposed as follows. After the TDE occurred, the rising bolometric luminosity inevitably evaporated the proximate dust gradually until the peak of the flare. The new inner radius of the torus recedes to light days and the original dust between 10 to 70 light days is replaced with a gas torus. This part of gas is exposed to the radiation field, so it will be ionized and emit emission lines. Its velocity is lower than the intermediate-width line gas since it is more further out (), consistent with the fact that the observed intermediate-width component of H line has become narrower while its equivalent width increased (Blanchard et al. 2017). On the other hand, the metal released from dust will be ionized and give pronounced metal lines, particular Fe II emission lines. However, previous studies show that Fe II emission cannot be fully explained in the framework of photoionization models (Collin & Joly 2000; Sigut & Pradhan 2003; Baldwin et al. 2004), additional mechanisms such as collisional excitation might also act (e.g. Joly 1981; Véron-Cetty et al. 2006). The unbound debris ejected from the disrupted star may produce intense shocks by interacting with the gas torus and excite the iron, hence collisional excitation is likely also essential here.
A rough estimate of area of Fe II emitting region can be made by comparing the constant temperature collisional excitation model of Joly (1987), which gave an estimate of Fe II flux per unit surface area whatever the detailed heating mechanism. Using the highest Fe II intensity () in their calculation ( K, ) and a observed intensity of (see Figure 8 of Blanchard et al. 2017), we can reach a conclusion that Fe II emission area is equivalent to a spherical surface of radius of cm or light month. This is a lower limit, yet comparable with the size of photon traveling from the initial outburst, implying that the physical conditions to account for the strong Fe II in PS16dtm is indeed critical.
3.4. Broad absorption line outflow: driven by radiation pressure?
While the optical spectra of PS16dtm matches strikingly with NLS1s, its NUV spectra taken by HST/STIS appears very similar to BAL quasars, exhibiting a broad absorption trough at around 2700 Å with a velocity width of (Blanchard et al. 2017). This feature can be attributed to the blueshifted absorption of Mg II doublet and suggests an outflow with velocity of . Can the outflow be driven by the radiation pressure amplified dramatically by the TDE?
First of all, the radiation pressure the gas experienced becomes higher and higher along with the rising of the bolometric luminosity. At the Eddington luminosity, the radiative acceleration is significantly larger than the gravitational acceleration by a factor of (100-1000) depending on the gas column density (Castor et al. 1975; Abbott 1982; Risaliti & Elvis 2010). For gas at around the original torus inner radius, that is 10 light days away from the black hole, its escape velocity () is , and the dynamical time scale is 100-300 days (). Within , the gas can be accelerated to a velocity of times of the escape velocity, that is . This may be sufficient to explain the observed BAL outflow.
Before PS16dtm, only three TDEs have been spectroscopically observed in UV, among which PTF15af and iPTF16fnl are X-ray weak and their UV spectra show BALs, while ASASSN-14li is X-ray bright and its UV spectrum does not present BALs (Yang et al. 2017). PS16dtm shows the same coincidence. This behaviour is exactly in analogy to quasars with and without BALs. Despite still with controversy, it is commonly assumed that soft X-rays from accretion disk is filtered by a thick shielding gas which prevent over-ionization of the outer layer gas and ensure effective radiative acceleration via UV resonance absorption lines (Murray et al. 1995). This may be particularly true for TDE, whose X-ray spectra are generally very soft, thus a rather moderately thick gas will produce strong absorption. Further more UV-spectra and X-ray follow-ups of TDEs are necessary to verify the coincidence or not.
4. Summary
Classified as a candidate TDE in a Seyfert 1 galaxy with low-mass BH, PS16dtm has shown interesting properties in both photometric and spectral evolutions (Blanchard et al. 2017). Surprisingly, we found that the MIR flare was detected 11 days earlier than its optical discovery by ASAS-SN, even earlier than Pan-STARRS. At the face value, this observation appears to be inconsistent with the dust echo interpretation proposed for other TDEs, however, the three unique features associated with this event, including close pre-existing dust, high dust covering factor and significant noise in very early-time optical light curves due to the host galaxies, can indeed provide a satisfactory. Given the low and before the event, the torus inner radius is only light days. At the first epoch (E1), the MIR color corresponds to a blackbody temperature higher than the dust sublimation temperature, implying the dust is located very close to the black hole and evaporating. Moreover, at the rising stage, the MIR luminosity is comparable with the bolometric luminosity, meaning the dust covering factor is not low. At the second and third WISE detection epoch (E2 and E3), that is and 330 days later, the dust temperature has dropped below the sublimation temperature and more clearer evidence for the dust echo is provided. Particularly, the equilibrium between the dust heating and cooling at E2 results in a bolometric luminosity of erg s-1, depending on the dust absorption efficiency an grain size, that is basically consistent with the observed peak luminosity. Other possibilities to explain the earlier detection of the flare in MIR than optical have also been briefly discussed, such as the delay between the optical flare and the disruption, the ”reprocessing layer” origination of the optical flare.
In summary, we can still understand the MIR flare of PS16dtm as the dust echo of the tidal disruption flare. In this case, infrared variability is detected before the optical flare, suggesting that IR surveys may trigger follow-up in other band, that is important for future infrared survey. This unique object has also fallen in our sample of nearby galaxies presenting dramatical MIR flares selected from WISE database (Jiang et al. in preparation), encouraging us to further discover TDEs using MIR echoes, which is expected to be very efficient for those obscured targets.
We have also tried to interpret the newly-emerged prominent Fe II emission and Mg II BAL under the TDE scenario. As the bolometric luminosity increases, the inner dust evaporates gradually until to the peak luminosity. The new torus inner radius has increased to light days and the region between 10 and 70 light days is replaced with a gas torus. The metal released from dust will contribute to the generation of strong Fe II emission lines. In addition to the photoionization, collisional excitation triggered by the interaction between the tidal debris and gas maybe also be essential for the increasing Fe II emission. On the other hand, the exposed gas can be accelerated by the radiation pressure to a observed velocity (Blanchard et al. 2017) within a dynamical time scale, resulting in the observed Mg II BAL. The non-detection of X-ray in PS16dtm is in analogy to BAL quasars, in which X-ray is largely absorbed by the shielding gas.
Lastly, we caution that the TDE nature of PS16dtm is not unquestionable in light of its odd properties, especially the optical light curve stays persistently at Eddington luminosity for almost half a year instead of decaying immediately with time as theory-predicated form. The MIR flare found in this work has been interpreted as a TDE echo, but can also an echo of outburst induced by other unknown physical processes. Further follow-up monitorings may help us disentangle the mysteries of this unique object.
References
- Abbott (1982) Abbott, D. C. 1982, ApJ, 259, 282
- Arcavi et al. (2014) Arcavi, I., Gal-Yam, A., Sullivan, M., et al. 2014, ApJ, 793, 38
- Baldwin et al. (2004) Baldwin, J. A., Ferland, G. J., Korista, K. T., Hamann, F., & LaCluyzé, A. 2004, ApJ, 615, 610
- Blanchard et al. (2017) Blanchard, P. K., Nicholl, M., Berger, E., et al. 2017, ApJ, 843, 106
- Boroson & Green (1992) Boroson, T. A., & Green, R. F. 1992, ApJS, 80, 109
- Brandt et al. (1995) Brandt, W. N., Pounds, K. A., & Fink, H. 1995, MNRAS, 273, L47
- Collin & Joly (2000) Collin, S., & Joly, M. 2000, NewAstronomy, 44, 531
- Castor et al. (1975) Castor, J. I., Abbott, D. C., & Klein, R. I. 1975, ApJ, 195, 157
- Dong et al. (2011) Dong, X.-B., Wang, J.-G., Ho, L. C., et al. 2011, ApJ, 736, 86
- Dong et al. (2016) Dong, S., Chen, P., Bose, S., et al. 2016, The Astronomer’s Telegram, 9843,
- Dou et al. (2016) Dou, L., Wang, T., Jiang, N., et al. 2016, ApJ, 832, 188
- Dou et al. (2017) Dou, L., Wang, T., Yan, L., et al. 2017, ApJ, 841, L8
- Greene & Ho (2007) Greene, J. E., & Ho, L. C. 2007, ApJ, 670, 92
- Guillochon et al. (2014) Guillochon, J., Manukian, H., & Ramirez-Ruiz, E. 2014, ApJ, 783, 23
- Guillochon & Ramirez-Ruiz (2015) Guillochon, J., & Ramirez-Ruiz, E. 2015, ApJ, 809, 166
- Hills (1975) Hills, J. G. 1975, Nature, 254, 295
- Huber et al. (2015) Huber, M., Chambers, K. C., Flewelling, H., et al. 2015, The Astronomer’s Telegram, 7153,
- Jester et al. (2005) Jester, S., Schneider, D. P., Richards, G. T., et al. 2005, AJ, 130, 873
- Jiang et al. (2012) Jiang, N., Zhou, H.-Y., Ho, L. C., et al. 2012, ApJ, 759, L31
- Jiang et al. (2016) Jiang, N., Dou, L., Wang, T., et al. 2016, ApJ, 828, L14
- Joly (1981) Joly, M. 1981, A&A, 102, 321
- Joly (1987) Joly, M. 1987, A&A, 184, 33
- Karas & Šubr (2007) Karas, V., & Šubr, L. 2007, A&A, 470, 11
- Kaspi et al. (2000) Kaspi, S., Smith, P. S., Netzer, H., et al. 2000, ApJ, 533, 631
- Kochanek et al. (2017) Kochanek, C. S., Shappee, B. J., Stanek, K. Z., et al. 2017, PASP, 129, 104502
- Komossa (2015) Komossa, S. 2015, Journal of High Energy Astrophysics, 7, 148
- Kishimoto et al. (2007) Kishimoto, M., Hönig, S. F., Beckert, T., & Weigelt, G. 2007, A&A, 476, 713
- Kruegel (2003) Kruegel, E. 2003, The physics of interstellar dust, by Endrik Kruegel. IoP Series in astronomy and astrophysics, ISBN 0750308613. Bristol, UK: The Institute of Physics, 2003.,
- Mainzer et al. (2014) Mainzer, A., Bauer, J., Cutri, R. M., et al. 2014, ApJ, 792, 30
- Mathis et al. (1977) Mathis, J. S., Rumpl, W., & Nordsieck, K. H. 1977, ApJ, 217, 425
- Metzger & Stone (2016) Metzger, B. D., & Stone, N. C. 2016, MNRAS, 461, 948
- Miller (2015) Miller, M. C. 2015, ApJ, 805, 83
- Murray et al. (1995) Murray, N., Chiang, J., Grossman, S. A., & Voit, G. M. 1995, ApJ, 451, 498
- Namekata & Umemura (2016) Namekata, D., & Umemura, M. 2016, MNRAS, 460, 980
- Peterson & Ferland (1986) Peterson, B. M., & Ferland, G. J. 1986, Nature, 324, 345
- Phinney (1989) Phinney, E. S. 1989, The Center of the Galaxy, 136, 543
- Pons & Watson (2014) Pons, E., & Watson, M. G. 2014, A&A, 568, A108
- Rees (1988) Rees, M. J. 1988, Nature, 333, 523
- Risaliti & Elvis (2010) Risaliti, G., & Elvis, M. 2010, A&A, 516, A89
- Shappee et al. (2014) Shappee, B. J., Prieto, J. L., Grupe, D., et al. 2014, ApJ, 788, 48
- Sigut & Pradhan (2003) Sigut, T. A. A., & Pradhan, A. K. 2003, ApJS, 145, 15
- Suganuma et al. (2006) Suganuma, M., Yoshii, Y., Kobayashi, Y., et al. 2006, ApJ, 639, 46
- van Velzen et al. (2016) van Velzen, S., Mendez, A. J., Krolik, J. H., & Gorjian, V. 2016b, ApJ, 829, 19
- Véron-Cetty et al. (2006) Véron-Cetty, M.-P., Joly, M., Véron, P., et al. 2006, A&A, 451, 851
- Wright et al. (2010) Wright, E. L., Eisenhardt, P. R. M., Mainzer, A. K., et al. 2010, AJ, 140, 1868-1881
- Xiao et al. (2011) Xiao, T., Barth, A. J., Greene, J. E., et al. 2011, ApJ, 739, 28
- Yang et al. (2017) Yang, C., Wang, T., Ferland, G. J., et al. 2017, ApJ, 846, 150